SOLANA → Pre-breakout consolidation relative to 136.00BINANCE:SOLUSDT relative to the range support forms a false breakdown. The market reacts quite positively and the price recovers, forming a consolidation in front of strong resistance
Bitcoin is also in consolidation, as well as SOL, in general the movements coincide, but lately bitcoin is leading relative to the stock market.
SOL is in consolidation in front of a strong resistance level at 136.00. The primary test may end with a small correction to 0.5 fibo, or consolidation near the level, but a breakout and price consolidation above the current consolidation will be a positive signal for continued growth. The global trend reversal is out of the question, we are aiming at local targets, such as 140, 147, 152.
Resistance levels: 147,152
Support levels: 129, 123, 111
In general, the global market situation is bearish, the local situation is neutral as the price is in a sideways range. A false breakdown was formed against the support of the current range. Technically, due to liquidity imbalance (after the false breakdown) the price may head towards such zones as 147 - 152
Regards R. Linda!
SOLUSDT.3S trade ideas

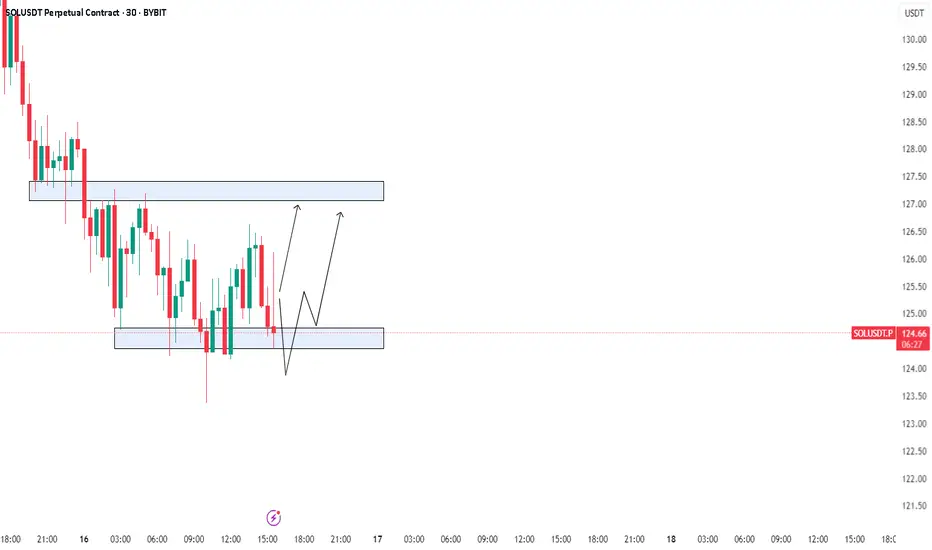
SOL – Small pullback to then grab the liquidity?This 1H chart of SOLUSDT on Bybit showcases a clean bullish continuation setup after a strong impulsive move upward. The current price action suggests a strategic retracement into a high-probability zone of interest before a potential continuation toward buy-side liquidity.
---
1. Market Structure & Context:
- SOL has shifted market structure to the upside following a strong impulse that broke previous lower highs.
- The current pullback resembles a classic bullish retracement, aligning with smart money concepts where price revisits inefficiencies and discount zones before continuation.
- The low on the retracement appears to be forming a higher low relative to the previous structure.
---
2. Fair Value Gap (FVG) + Golden Pocket Zone:
- The blue box represents a clear Fair Value Gap created during the recent rally — a price imbalance often targeted for entries by institutions.
- Overlaying that zone is the Fibonacci golden pocket (0.618–0.65), a highly reactive retracement area in bullish moves.
- The confluence of FVG and the golden pocket makes this a powerful demand zone, supported by historical order flow behavior.
---
3. Fibonacci Levels & Price Action:
- 0.618–0.65 zone: Ideal entry region during bullish retracements. Price is currently reacting within this band.
- 0.786 level: A deeper retracement level that still supports bullish continuation if respected — though it marks the edge of the current FVG.
- The equilibrium between these levels represents a discount area for accumulation.
---
4. Liquidity Outlook – Buy-Side Liquidity (BSL):
- A clear BSL (Buy-Side Liquidity) sits above the previous local high.
- Price is likely to target this level as the next point of liquidity collection once the retracement completes.
- The green arrowed path shows the anticipated flow: a short-term dip into the FVG before a bullish move to sweep the BSL.
---
5. Trade Narrative:
- This setup reflects an entry based on optimal trade theory — retracement into a zone of inefficiency and discount (FVG + golden pocket).
- Bullish continuation is expected if this zone holds, especially with confluence from market structure and resting liquidity overhead.
- Ideal confirmation may involve lower timeframe bullish breaks of structure inside the FVG.
---
Summary:
SOL is offering a textbook retracement setup on the 1H, with price pulling back into a confluence of a Fair Value Gap and golden pocket (0.618–0.65). If the zone is respected, the next likely destination is the buy-side liquidity resting above previous highs. The reaction within this area will be key to validating the bullish scenario.

Trading opportunity for SOLUSDTBased on technical factors there is a Sell position in :
📊 SOLUSDT
🔴 Sell Now
🪫Stop loss 151.00
🔋Target 97.00
📏 R/R 2
💸RISK : 1%
We hope it is profitable for you ❤️
Please support our activity with your likes👍 and comments📝

SOLANA I Monthly CLS I KL - OB I Model 1 , Target 50% than CLSHey, Market Warriors, here is another outlook on this instrument
If you’ve been following me, you already know every setup you see is built around a CLS range, a Key Level, Liquidity and a specific execution model.
If you haven't followed me yet, start now.
My trading system is completely mechanical — designed to remove emotions, opinions, and impulsive decisions. No messy diagonal lines. No random drawings. Just clarity, structure, and execution.
🧩 What is CLS?
CLS is real smart money — the combined power of major investment banks and central banks moving over 6.5 trillion dollars a day. Understanding their operations is key to markets.
✅ Understanding the behaviour of CLS allows you to position yourself with the giants during the market manipulations — leading to buying lows and selling highs - cleaner entries, clearer exits, and consistent profits.
🛡️ Models 1 and 2:
From my posts, you can learn two core execution models.
They are the backbone of how I trade and how my students are trained.
📍 Model 1
is right after the manipulation of the CLS candle when CIOD occurs, and we are targeting 50% of the CLS range. H4 CLS ranges supported by HTF go straight to the opposing range.
📍 Model 2
occurs in the specific market sequence when CLS smart money needs to re-accumulate more positions, and we are looking to find a key level around 61.8 fib retracement and target the opposing side of the range.
👍 Hit like if you find this analysis helpful, and don't hesitate to comment with your opinions, charts or any questions.
⚔️ Listen Carefully:
Analysis is not trading. Right now, this platform is full of gurus" trying to sell you dreams based on analysis with arrows while they don't even have the skill to trade themselves.
If you’re ever thinking about buying a Trading Course or Signals from anyone. Always demand a verified track record. It takes less than five minutes to connect 3rd third-party verification tool and link to the widget to his signature.
"Adapt what is useful, reject what is useless, and add what is specifically your own."
— David Perk aka Dave FX Hunter ⚔️

SOL Bulls Strike Back — But Is It Sustainable?Solana continues to respect technicals with precision — after a +42.9% move from the $95 low, we're now at a pivotal moment in price structure. Let’s break down what’s happening and where the high-probability setups lie.
📍 Key Bounce Zone – Golden Pocket Confluence
Local Low: $95.26
Golden Pocket Zone (0.618–0.666): $97.09–$94.82
This area acted as a major demand zone, with price sharply rebounding.
First Volume Spike: Followed by retracement into Golden Pocket Zone at $102.
Second Volume Spike: Occurred right after touching Anchored VWAP ($108.21) from the $95.26 low, which added beautiful confluence with the Golden Pocket Zone – a secondary high-conviction long entry.
📈 Rally to Resistance – Short-Term Climax
After the anchored VWAP retest, SOL rallied into the key resistance zone aligned with the 0.786 Fib retracement from the previous down move — a historically reactive level and a prime profit-taking zone.
Monthly 21 EMA ($135.83) and the monthly 21 SMA ($133) — both key dynamic resistance zones.
Low-volume retest of that key high suggests buyer exhaustion, not continuation — a classic setup for a short-term reversal.
🧭 Current Market Structure
Current Price Action: Trading above both the weekly open ($128.38) and the monthly open ($124.54).
This forms a critical S/R zone between $124–$128, now acting as a potential battleground for bulls and bears.
As long as price stays above this zone, momentum remains with the bulls.
🔍 What to Watch Next – Reclaim or Reject?
Key Support to Watch:
$125 (psychological level) and monthly open at $124.54 – This zone is likely to be liquidity-hunted. Expect a sweep of this low, look for the reaction.
Daily Support Confluence: currently at 21 EMA: $123.77 & 21 SMA: $123.27
1.) 📈 Scenario A – Bullish Reclaim:
If SOL sweeps the low and shows strong buying reaction (bullish engulfing candle, volume spike), it sets up a potential long opportunity towards the weekly open, to watch for the next reaction.
2.) 📉 Scenario B – Failed Hold:
If there's no bullish reaction at $124–$125, expect further downside.
First target = $122
Second target = $120.65
🎯 Tactical Game Plan
Bulls:
Watch for reaction at $124–$125 – potential scalp long with tight SL.
Confirmation on volume expansion and break of $128.38 for continuation.
Re-enter long after clean retest of weekly open from above.
Bears:
Short setup possible if weekly/monthly open is broken and retested as resistance.
First TP = $122, second TP = $120.65.

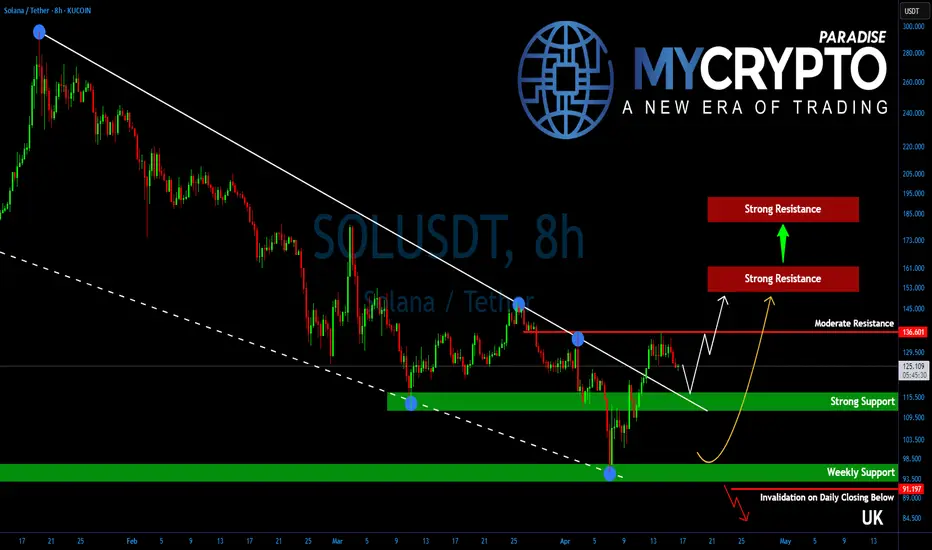
Solana Is One Breakout Away From a Bullish Explosion!Yello, Paradisers! Did you notice how #SOLUSD has been quietly positioning itself while the rest of the market remains uncertain? If you're not paying attention right now, you could be missing one of the cleanest setups on the charts.
💎After several weeks of downside grind and tight consolidation, Solana has just broken out of a falling wedge—a powerful bullish pattern that typically signals trend reversals or the start of a strong upside leg. This breakout wasn’t random either. It occurred after SOL successfully defended a key higher time frame support zone, signaling strength behind the move.
💎For #SOLUSDT, all eyes are on the $136.50 resistance level. This is a critical structural pivot. A clean break and close above this level would confirm a shift in higher time frame momentum from neutral to bullish. Until that happens, bulls still need to proceed with caution—but the setup is clearly developing in their favor.
💎Adding conviction to the idea of a bullish breakout are several supporting factors. Oscillators are showing bullish divergences, a classic sign that seller momentum is fading. At the same time, a golden cross formation on the 12-hour chart is getting closer which typically precedes sustained trend reversals and stronger moves to the upside.
💎If bulls succeed in reclaiming $136.50, the next price targets are $155–$160 as the initial strong resistance zone where some profit-taking could occur. If bulls hold strength, SOL is likely to head further higher and aim for $180–$190, which lines up with the target of the wedge pattern. This is a strong resistance zone and a level which could mark end of the corrective phase for Solana.
💎On the downside, immediate support lies between $110–$115. This is a well-defined range of demand and should offer strong buying interest if any short-term pullbacks occur.
Paradisers, strive for consistency, not quick profits. Treat the market as a businessman, not as a gambler.
MyCryptoParadise
iFeel the success🌴
SHORT SOLUSDT SOONI believe we may be setting up for a potential short opportunity between the 138 and 150 levels. This appears to be an expanded flat, which is one of the most common corrective patterns seen in wave 4.
Wave B has already successfully bounced off the 1.38 Fibonacci level, which adds further confidence to this structure. Currently, it looks like we're in the process of completing wave C, which would finalize the correction and potentially mark the beginning of the next impulsive move downward.

Elliott Wave Update – Structure OverviewBINANCE:SOLUSDT
We may have found a potential local bottom at yellow Wave A, and are now tracking a move towards yellow Wave B.
This yellow Wave B appears to be unfolding as a 1-2-3-4-5 structure:
Waves 1-2-3 are likely completed.
Waves 4 and 5 could still be ahead.
This full impulse may form part of a larger A-B-C correction, completing the final yellow Wave B.
In the black wave count, the 1-2-3 move is finished.
Within Wave 3, we saw a clean internal 1-2-3-4-5, confirming the completion of that wave.
Currently, I’m tracking the move from black Wave 3 to black Wave 4 as a developing A-B-C correction:
Wave A is potentially in.
We are now in the resistance zone of Wave B, which could lead to the final drop into Wave C.
After completing Wave 4, I expect an upward move into black Wave 5, starting with an initial A-wave.
This should then form another A-B-C structure, leading to the completion of the final yellow Wave B.

SOL - Some new TA- IO and CVD increased regarding last highs (15.04.) but price has not broken Local Daily line. This means Big Money is shorting the Local Daily and absorbing Longs.
- Price is going up while Volume (OBV and AD) is decreasing in almost every time frame. Again. Big money is selling heavily to the Longs. The probability that Whale Sellers get exhausted is high too!
- 1H:
Grey line would be a nice Short if we can catch it.
Price on 0.78 Fib.
Risky...
1H Chart :
Follow for more ideas/Signals.💲
Just donate some of your profit to Animal rights or other charity :)✌️

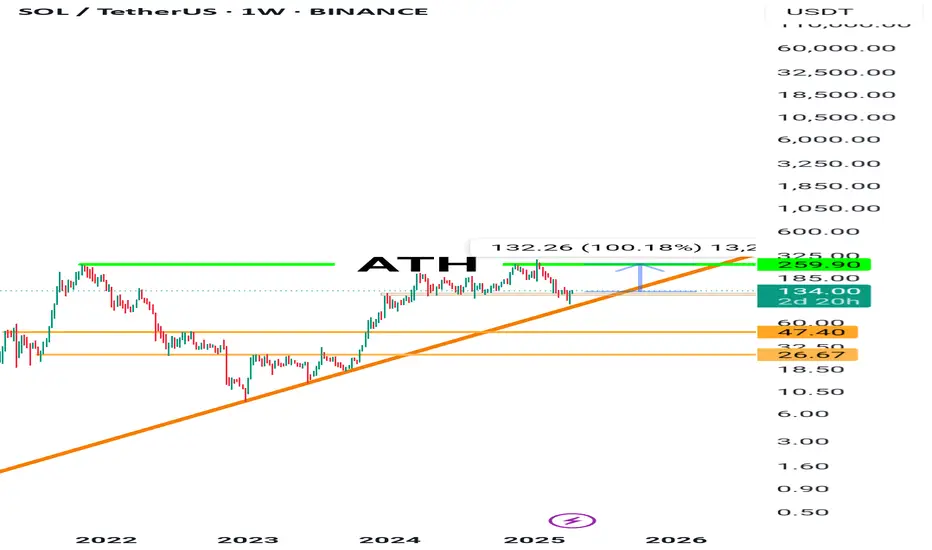
Trading Observation on SOLSOL has officially reawakened.
After respecting the GB11 Order Block in the $98–$130 range — a clean accumulation zone — price has initiated what appears to be a calculated delivery run toward the GB89 OB near $273. This move aligns perfectly with the Goldbach pathway (GB11 → GB89), signifying that smart money is in full control, executing a textbook liquidity sweep and redistribution cycle.
Recent PA shows SOL breaking structure above the OB with conviction, flipping resistance into support. The order block was mitigated cleanly, offering an optimal entry for those paying attention. With volume tapering into breakout and now expanding on bullish momentum, the roadmap is being laid out in real time.
I’m projecting price to magnet toward the unmitigated imbalance zones above — particularly the inefficiencies left between $200 and $240. These are natural resting points on the journey to GB89.
Bias: Bullish continuation
Entry: $130–$144 (Order Block Breakout)
Target: $273 (GB89 OB)
Invalidation: Clean break below $120 closes the path
Path of least resistance is up. Liquidity is calling. I’m watching SOL unfold with the patience of a general at war — calculated, focused, and positioned.
Lord MEDZ

Give me some energy !!!The price has broken the wedge, and in my opinion, it could form a head and shoulders pattern before experiencing significant growth.
Give me some energy !!
✨We spend hours finding potential opportunities and writing useful ideas, we would be happy if you support us.
Best regards CobraVanguard.💚
_ _ _ _ __ _ _ _ _ _ _ _ _ _ _ _ _ _ _ _ _ _ _ _ _ _ _ _ _ _ _ _
✅Thank you, and for more ideas, hit ❤️Like❤️ and 🌟Follow🌟!
⚠️Things can change...
The markets are always changing and even with all these signals, the market changes tend to be strong and fast!!

SOL/USDT Ranging and ranging...The price is overall in sell trend and since the candle here made a big wick to the upside theres a chance of another fakeout....now i dont believe the market will just turn around but i am sure that since its a sell range that its possible it will come back for another touch to the upside sooner or later.
$SOL Weekly Bounce from Dynamic Support – Watch for BreakoutCRYPTOCAP:SOL is holding above a key rising trendline that has acted as strong support since 2021. After a successful retest near $95–$100, SOL bounced sharply and is now trading above $120.
This move also confirms a reclaim of a previous resistance-turned-support zone. As long as it holds, SOL could aim for $145 and above.
DYOR, NFA

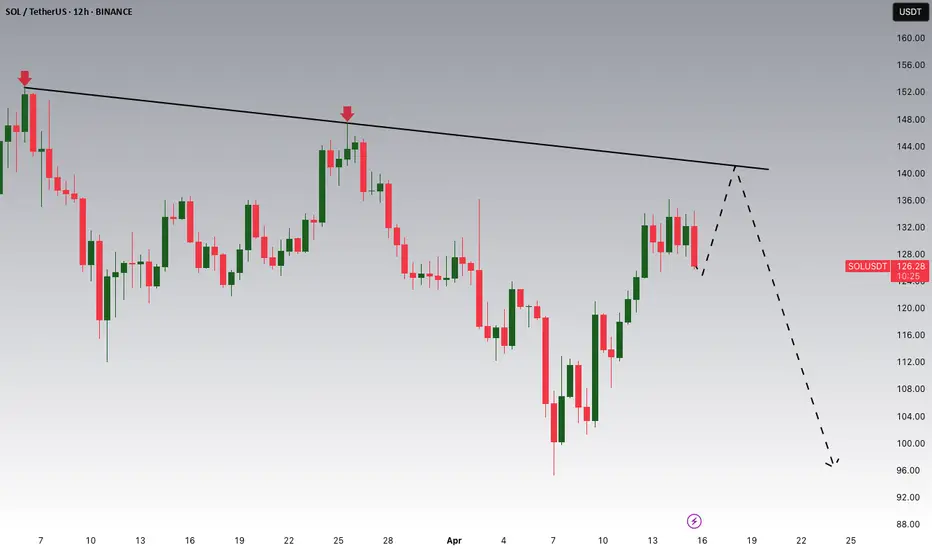
Solana Potential DownsidesHey Traders, in today's trading session we are monitoring Solana for a selling opportunity around 140 zone, SOLUSDT is trading in a downtrend and currently is in a correction phase in which it is approaching the trend at 140 support and resistance area.
Trade safe, Joe.
#SOL/USDT Analysis📊 #SOL/USDT Analysis 📊
📉 CRYPTOCAP:SOL is currently testing the Daily Bearish IFVG zone.
🔹 I'm expecting a Buy-side Liquidity Grab first before entering any short positions — there's also a Bearish OB sitting right above as confluence.
🔻 Major Support: PMH $112

SHORT SOLWe're approaching the end of the ending diagonal in wave C. One more leg up could complete the structure, potentially setting up a great opportunity to catch the big wave 5 move

we are heading towards massive rejection on sol.As I am short on solana massive rejection has been verified we are goin down to 126 atleast thats what i can see ,Remember what i said all of my analysis on confirmations not fomo's so lets see where we headed with this sort of volume,RSI isn`t in our favour this time but CIPHER B and daily volume and rejections has given us confirmations lets roll our dice.

SOL/USDT Wedge Breakout (08.04.2025)The SOL/USDT pair on the M30 timeframe presents a Potential Buying Opportunity due to a recent Formation of a Wedge Breakout Pattern. This suggests a shift in momentum towards the upside and a higher likelihood of further advances in the coming hours.
Possible Long Trade:
Entry: Consider Entering A Long Position around Trendline Of The Pattern.
Target Levels:
1st Resistance – 120.60
2nd Resistance – 130.63
🎁 Please hit the like button and
🎁 Leave a comment to support for My Post !
Your likes and comments are incredibly motivating and will encourage me to share more analysis with you.
Best Regards, KABHI_TA_TRADING
Thank you.

Solana Bullish Based On Volume & Support, Or Crash?Solana is now bullish, I shall explain. Many signals are pointing to this fact, these are easy to see. Once I share them here, below, you will agree with me 100%. Correct?
Let's start with the easy part. Volume is rising and has been very strong lately. A significant rise in trading volume after a major drop and as prices grow is a signal that confirms any bullish development. The bullish development is the move and recovery above support.
Support is found as the 0.148 Fib. extension level, Solana trades above it. Support is the early August 2024 low. SOLUSDT trades above it. Support is EMA34, Solana closed daily above this level after resistance was met. Support found, bullish.
The RSI is bullish with a reading of 55. A bottom formation is present, v shaped pattern. Do you want more?
One signal is good but not enough. Two signals are good but we need more. Three signals can count toward reaching certain conclusions about what will happen next. When you have 5, 6, 7 strong signals all combined, it is hard to miss what the chart has to say. Too many signals now are pointing toward higher prices. Do you see any bearish signals?
You can say bearish only if you ignore the bullish signals.
Or you can say bearish if you don't have a chart.
If you are with me now —thanks for the support— you already know that Solana is set to grow.
Solana will soon trade above $400. Very easy, I know you agree with me because I showed you data to support my point of view. It is not done blindly. Everything I wrote can be confirmed by anyone, at any point in time. Now.
You can check each signal for yourself; what do you see?
I see a low 7-April followed by a quick recovery. I see the market now turning green.
Do you agree?
If you do, follow me.
Namaste.

SOL preppin for a 300 revisit from this 100 bargain zone. SEED!SOL has been on rollercoaster ride the past few months -- going from 100 to almost 300 in a zoom when the market is at its peak.
Moreso, when memes started taking over the market and everyone, including the president himself is launching one on SOL blockchain, market started pickup up pace and eliciting euphoria among all, albeit momentarily. It has stirred up some hype and frenzy skyrocketing prices only to be met with so much saturation and gravity, then the BIG BLEED happens.
After a few weeks thing seem to have settled down -- a shift is gradually transpiring as we speak. SOL is now exhibiting some basing behavior at this current range at 100 levels. Net longs has started to pile up around this zone conveying a prep work of upside reversal soon.
Long term metrics suggests a tap at 61.8 FIB levels - a buyers convergence zone. This is where it all starts.
Ideal seeding is at the current discounted price range.
Spotted at 110
Mid target 300.
Long term 500.
TAYOR. Trade safely.

SOL throwback short setup formingShort Entry : 133
TP : 122
SL : 136.5
My trading is based on momentum, and the chart said that SOL is going to retest the previous 4H breakout resistance.

Solana vs. Ethereum: Why Investors Are Turning to Solana in 2025In recent months, a growing shift in sentiment has been observed among crypto investors: many are increasingly eyeing Solana (SOL) as a strong alternative to Ethereum (ETH). The comparison chart above, plotting Solana’s price action alongside Ethereum's, reveals that despite ETH retracing back to October 2023 levels, SOL is still holding higher support zones—a sign of relative strength and growing market confidence.
But why exactly is Solana capturing investor attention more than Ethereum in 2025? Let’s dive into the technical, fundamental, and sentiment-driven reasons behind this evolving preference.
___________________
📊 Technical Outlook: Solana Holding Strong
Ethereum (red line) has dropped back to its October 2023 price levels (~$1500), reflecting a broader altcoin weakness.
Solana, on the other hand, is still trading above $100, even though the macro market has turned bearish.
SOL has tested and respected the long-term ascending trendline that began in early 2023, while holding above a key horizontal support near $68–$82.
This divergence in structure suggests stronger buy-side interest and support zones forming on Solana, while Ethereum appears to be losing momentum.
___________________
🧬 Fundamental Comparison: Solana vs. Ethereum
Solana’s technical design gives it a speed and cost edge that appeals to users and developers building consumer-facing applications like NFTs, GameFi, and micro-transactions. Ethereum remains the institutional and DeFi heavyweight, but it’s starting to feel the pressure of competition in usability and scalability.
___________________
💬 Investor Sentiment: What’s Driving the Shift?
User Experience
Solana offers near-instant confirmation and negligible fees, making it ideal for gaming, NFTs, and mainstream use cases. Ethereum's scaling solution rollouts are still clunky and fragmented (Layer 2s like Arbitrum, Optimism, etc.), creating friction.
Vibrant Ecosystem Growth
Solana’s ecosystem is experiencing a boom in dApps, especially with high-profile launches like Jupiter, Marinade, and Phantom wallet integration. The mobile-first approach (Saga phone initiative) and deeper ties with consumer apps are also pushing adoption.
Performance During Market Pullbacks
As seen in the chart, SOL is showing relative strength during market corrections, indicating long-term accumulation rather than panic selling.
Narrative Momentum
The "ETH killer" narrative has found new life with Solana's resurgence. While Ethereum focuses on L2 scaling and abstract complexity, Solana is betting on a simpler, high-performance monolithic chain.
