Solana head and Shoulders ?This pattern need to be confirmed by the second shoulder, then keep an eye on the volume, the RSI and the pattern neck line to take a trade and aim for position to TP
SOLUSDT.P trade ideas

Solana Bearish Divergence, 20% Drop Incoming?Hey Realistic Traders!
Bearish Signal Flashing on BINANCE:SOLUSDT , What Signals Are Showing?
Let’s Break It Down..
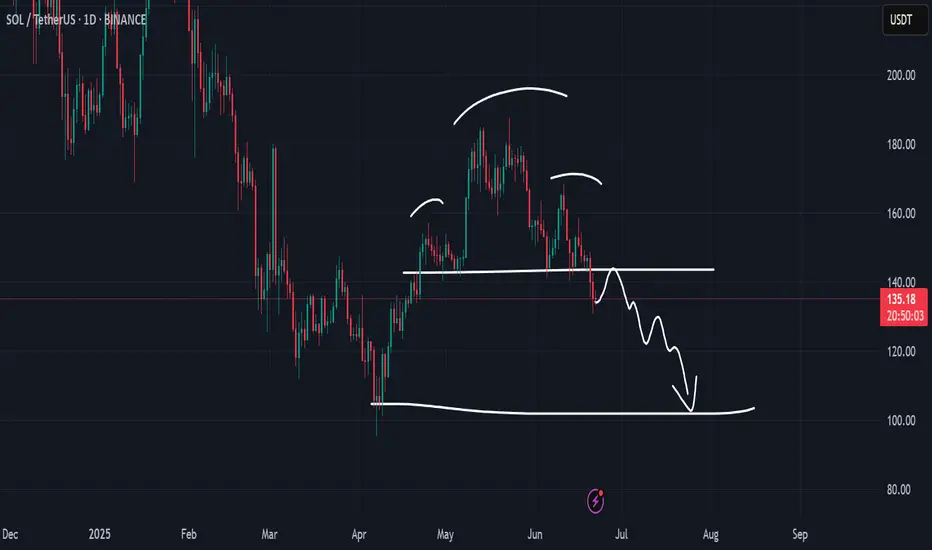
On the daily timeframe, Solana has formed a double top pattern, followed by a neckline breakout, which is a classic sign of a potential shift from a bullish to a bearish trend.
This breakout was confirmed by a break of the bullish trendline, accompanied by rising selling volume, which reinforces the bearish momentum. Adding to this, a bearish divergence has appeared on the stochastic oscillator. Bearish divergence occurs when price makes higher highs while the oscillator forms lower highs, signaling weakening buying pressure and increasing the likelihood of a reversal.
Given these technical signals, the price is likely to continue moving lower toward the first target at 134.13, with a possible extension to the second target at 114.96.
This bearish outlook remains valid as long as the price stays below the key stop-loss level at 180.26.
Support the channel by engaging with the content, using the rocket button, and sharing your opinions in the comments below.
Disclaimer: "Please note that this analysis is solely for educational purposes and should not be considered a recommendation to take a long or short position on Solana.

SOLANA SOL to 3800$ nextSolana is in mid range, 61.8% retracement bottom, similar to TSLA at 19 Aug 19,
since Sol is the most used cypto (90% of blockchain usage) i expect a massive bullrun.
Sol will outperform bitcoin


What's in it for Solana?I have to say: SOL, on the other hand, doesn't look too bullish here. The prior downtrend was broken, but the price has been rejected by the golden pocket and is currently trading slightly below the range. A drop to $112 is possible if the new trend isn't strong enough.

SOLUSDT Bearish continuationSolana is still going to push down deeper... The structure keeps forming lower lows and lower highs with a volume that remains high on the sellers side.
My target is 139.00
SL : 150.20

SOL/USDT LONG OPPORTUNITY Looking at the current structure of SOL/USDT and the Fib retracement, there's the likelihood that price will get to the 0.618 area where there will be a great opportunity to LONG

Sol at Risk: Key Support Break Could Trigger Drop to $97Sol is on the verge of breaking a critical support level. If this level fails, we could see a drop towards the $130–$125 range.
However, based on the full pattern length, Sol has the potential to fall as low as $97 — aligning with a possible double bottom formation.

#SOLUSDT LONG-TERM SETUPMEXC:SOLUSDT.P showing again an good price zone for entry i made this entry 2 days ago
still at the same point, it has a potential to perform to the target
you can take some entry at this point
meanwhile as you all know there is tension b/t #irna_israel so any thing can be happen so if you are planning to take position use low margin and apply some risk to reward ratio into your trade
#Hamm_crypto
Solana Wave Analysis – 20 June 2025
- Solana reversed from support level 141.60
- Likely to rise to the resistance level 163.8
Solana cryptocurrency recently reversed up from the support area located between the strong support level 141.60 (which has been reversing the price from the end of April) and the lower daily Bollinger Band.
The upward reversal from this support zone continues the active intermediate impulse wave (3), which also started from this support area last week.
Solana can be expected to rise to the next resistance level 163.8 (which stopped the previous impulse wave B earlier in June).

SOL - Reaching 200??? Can it be that accurate?? LOLSooooo can you see how accurate it is the way i drew and the way it is going ? Its going to go the way I said, observe and take your stancesss!

SOL: Short 19/06/25Trade Direction:
- SOL Short
Risk Management:
- 1% Risk
Reason for Entry:
- H1 Supply
- Multi timeframe overbought
- 0.886 Retrace - M15 Leg
- HTF Bearish
- Consistent Lower highs, Lower Lows being respected
- HTF DOL lower ~ $140
Additional Notes:
- While technically sound, runs the risk of being stopped quickly based on any news event, market is heavily news driven right now and that means this could be invalidated quickly.
- Re-entry
- Until price gives me a reason to I have to assume the highest probability direction is down.
- For a change in bias, my system requires;
a) HTF DOL being swept (Like $140)
b) H1 MSB for bulls.
- Accepted that this is a fairly risky trade and one IMO will get stopped. But everything aligns with my system so entry must be taken. My only active trade with risk with an additional FET long running Risk free.

SOL – Sweep & Spring Play at Local DemandWe’ve got a clean rounded top → breakdown → demand sweep setup.
Current price action suggests a potential reversal is brewing.
🔍 What’s happening on this chart?
Rounded top marks a local distribution — aggressive short entries
Price broke lower, swept the demand zone (gray box), and now shows rejection wick + bullish reaction
Fibonacci levels mapped out the structure
0.5 = 154.51
0.618 = 157.76 = key resistance liquidity zone
🎯 Trade idea:
Entry: inside demand zone (OB marked on chart)
Target 1: 151.25
Target 2: 157.76 (0.618)
Full fill: 162.40 – 168.30 (complete inefficiency sweep)
🧠 Mindset:
This setup is classic spring + reclaim. If price consolidates and flips 147.2, upside becomes favorable.
If you like clean trade setups with logic and clear invalidation, check the account bio for more updates and live breakdowns.

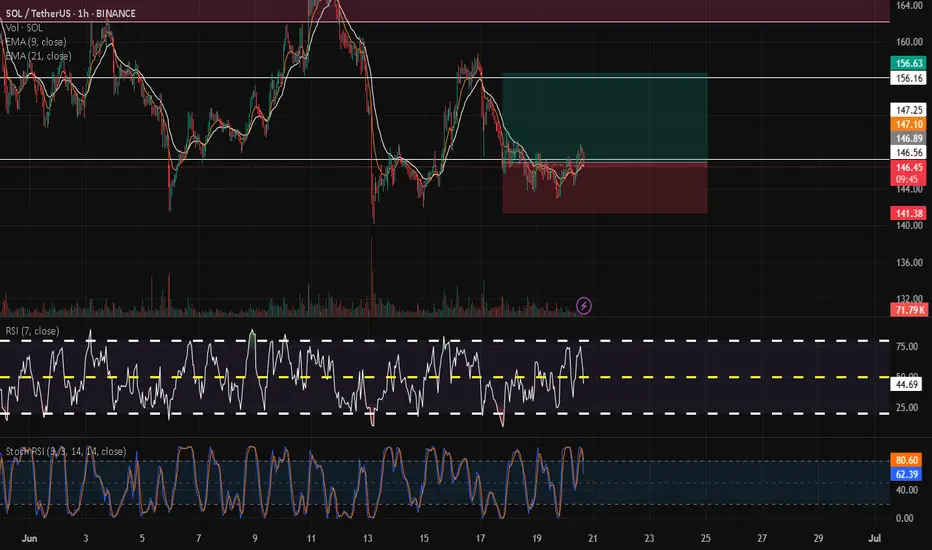
SOL/USDT – Bullish Reversal Setup (1H Timeframe)-wk9We are closely monitoring SOL/USDT on the 1-hour chart. Although the pair has been in a bearish trend, recent developments suggest a potential trend reversal.
A clear bullish divergence has formed, signaling underlying momentum shift. More importantly, a falling wedge—a classic bullish reversal pattern—has emerged. With this confluence of signals, we're now confident in a bullish breakout scenario.
🔹 Pair: SOL/USDT
🔹 Timeframe: 1H
🔹 Trend: Bearish (Bullish Reversal expected)
🔹 Pattern: Falling Wedge
🔹 Divergence: Bullish
🔹 Bias: Bullish
🔹 Entry (Buy Stop): 148.24
🔹 Stop Loss: 142.77
🔹 Take Profit 1: 153.71
🔹 Take Profit 2: 159.18
🔹 Risk/Reward: 1:1 and 1:2
🔹 Risk: $200
🔹 Potential Reward: $300
🎯 Strategy: Waiting for price to break last LH and trigger our buy stop level. Trade is structured with a calculated risk-to-reward profile.
📌 #SOLUSDT #CryptoTrading #FallingWedge #BullishReversal #Divergence #TechnicalAnalysis #PriceAction #AltcoinSetup #CryptoSignals #1HChart #BreakoutTrade #SmartMoney #RiskManagement #BullishSetup #SolanaAnalysis

Solana SOL price analysis📞 Rumor has it that as soon as the global geopolitics reach a “temporary lull”, the following ETFs will be launched
Solana ETF is the most likely to be the next one (but there are at least 2 coins more on the list, which we will talk about in the coming days)
🪙 So, are you ready to buy CRYPTOCAP:SOL in your investment portfolio? For example, in the range of $117-123
🤖 Maybe we need to launch a long trading bot OKX:SOLUSDT so that it can buy in micro portions on the current possible price correction to get a “tasty price” as a result
◆ Would you like to join such a trading bot and copy them?
◆ And then compare the results with all “ETF candidates”
_____________________
Did you like our analysis? Leave a comment, like, and follow to get more

Looking at this SOL/USDT chartKey Levels Identified
The chart shows several important institutional levels:
Supply Zone (Bearish Order Block): The upper gray/purple rectangle around 158-160 USDT represents a strong supply zone where institutional selling likely occurred, evidenced by the significant bearish move that followed.
Demand Zone (Bullish Order Block): The blue rectangle at the bottom around 142-145 USDT appears to be a demand zone where buying interest emerged, showing potential institutional accumulation.
Flip Level: The horizontal line around 150 USDT marked as "Flip" represents a key level that could act as support or resistance depending on market structure.


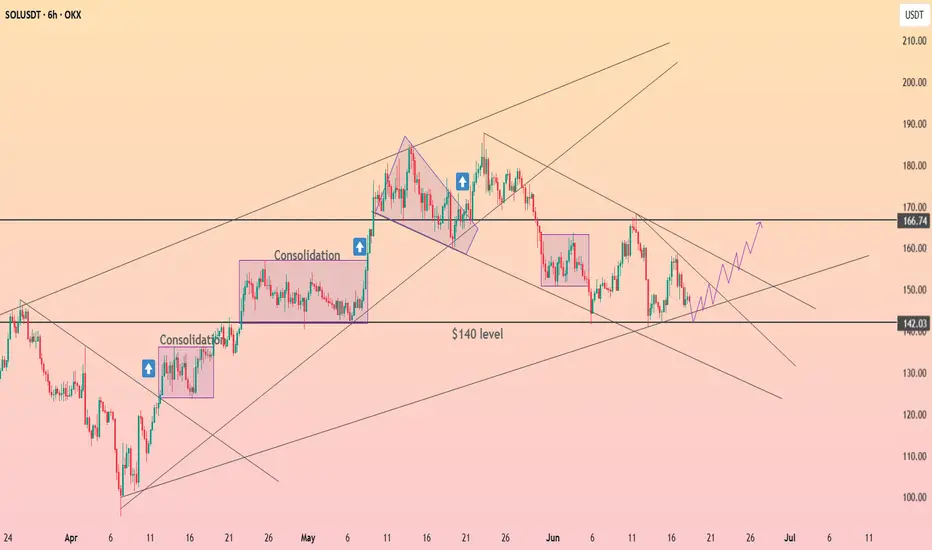
DeGRAM | SOLUSD channel floor launch toward 170+Solana continues to respect the broad rising channel that has guided price since early April. Recent corrective action tagged the channel median and then the intersecting 137-140 horizontal support, forming a classic confluence floor. The reaction: a sharp bullish rejection that restored price above the magenta internal trendline, indicating buyers remain in firm control. The corrective structure itself resembles a descending wedge losing bearish momentum, while RSI prints a positive reversal at 40 – conditions that often precede explosive upside resolution. A decisive close over 150 triggers an upside breakout aiming first at 160 (wedge objective) and subsequently at the 172-175 resistance block where prior distribution occurred. Should momentum spill over, the upper channel trajectory extrapolates 185-190 in coming weeks. Bullish bias is intact while candles close above 137; deeper dips into that zone likely represent opportunity rather than weakness.

HolderStat┆SOLUSD accumulation before growthOKX:SOLUSDT respects the $140 axis and tests the roof of its falling channel. Holding that shelf lets bulls aim for 160-170 and keeps the broader up-channel alive; a dip under 135 would postpone the rally but not derail the long-term trend ⚡️
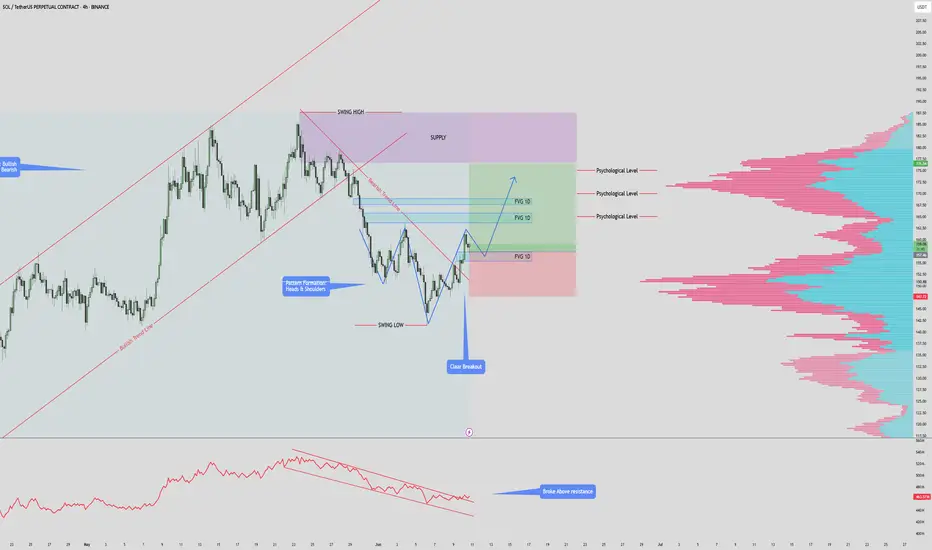
$SOLANA $180 PUMP INCOMINSOL/USDT – 4H Chart Summary
Market Structure:
HTF: Bullish trend remains intact.
LTF: Previously bearish, now showing early signs of a bullish reversal.
Pattern Formation:
Potential Inverse Head & Shoulders forming.
Neckline at $157 — must hold for pattern to complete.
Break above previous high will invalidate Inverse Head & Shoulders.
Trendline & Breakout:
Price has broken above the descending bearish trendline.
Indicates a momentum shift from bearish to bullish.
Fair Value Gaps (FVG):
1D FVG below current price – potential retest & long entry zone.
2x 1D FVG above price – act as targets or supply areas.
Psychological Levels & Volume:
Key levels at $165, $170, $175.
Volume profile shows high liquidity at each of these levels – strong TP zones.
OBV Indicator:
OBV has broken above resistance – supports bullish continuation.
Trade Scenarios:
Bullish Setup:
Long on retest of lower FVG zone ($142–$145).
Target TPs: $165 → $170 → $175 (align with psychological & high-volume areas).
Invalidation:
Break below FVG support or failure to hold above $142.
Solana - the pattern nobody want's to seeSolana may be forming a H&S top. Within the right shoulder there is an imperfect H&S also.
The break of this pattern could plummet the price of Solana down to 40's.
