Weekly trading plan for Solana BINANCE:SOLUSDT The chart clearly shows a triangular correction pattern. Price has now broken the trendline and is rallying, suggesting we may see:
Retest of the local high at $160
Achievement of our first monthly target
More details in the video itself - enjoy watching
Trade safe and stay adaptive
SOLUSDT.P trade ideas

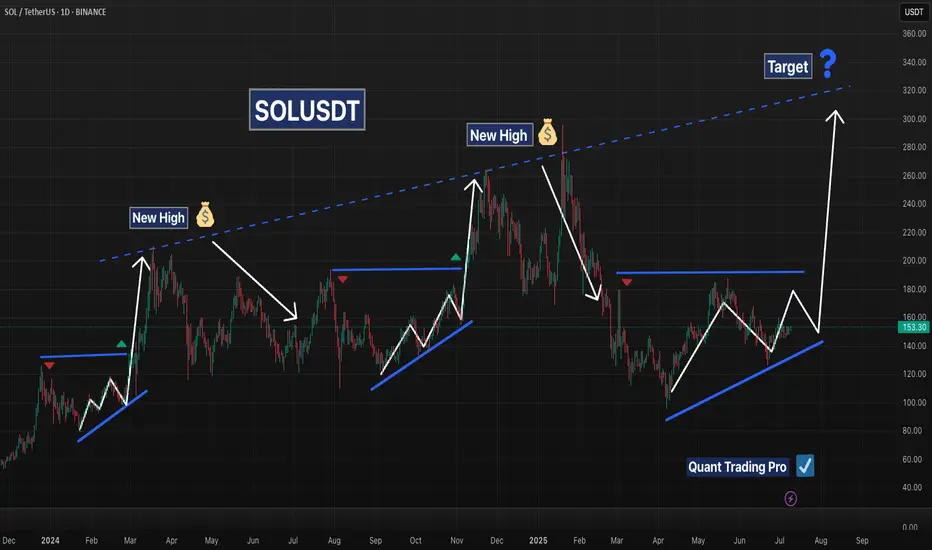
SOLANA – Repeating Structure Points to Major Upside PotentialSolana’s chart reveals a recurring bullish pattern that has played out multiple times over the past year. In each instance, SOL formed a rising base or ascending triangle followed by a strong breakout and a new high. These breakouts typically occurred after:
A series of higher lows forming an ascending structure
Compression beneath horizontal resistance
A clean breakout followed by a rapid price expansion
The current price action appears to be forming the same structure once again:
A clear ascending support trendline is intact
Price is approaching the horizontal resistance zone near $180
The 50 EMA is turning upward and price is pressing above the 200 EMA
If SOL breaks above the $180 level with volume, it could mirror previous rallies and target the long-term diagonal resistance trendline, currently pointing toward the $300–$340 range. Until then, a pullback to retest support near $140–$150 would remain within the bullish structure.
Key Technical Features:
Consistent ascending accumulation patterns
Breakout levels followed by new highs
Current setup showing a third rising base near major resistance
Clear long-term diagonal trendline acting as a historical ceiling
This is a textbook example of price memory and structural repetition. Traders should monitor for a confirmed breakout above horizontal resistance with strong volume before positioning for continuation.
Solana's fate: pump or dump ?Hello friends
You see that Solana, after its good growth, got stuck in a range and is gathering strength. Now, considering the strong upward trend of this currency, it can be said that this force can push the price upwards, but everything is possible in the market, so observe capital management and trade with your will and wisdom.
*Trade safely with us*

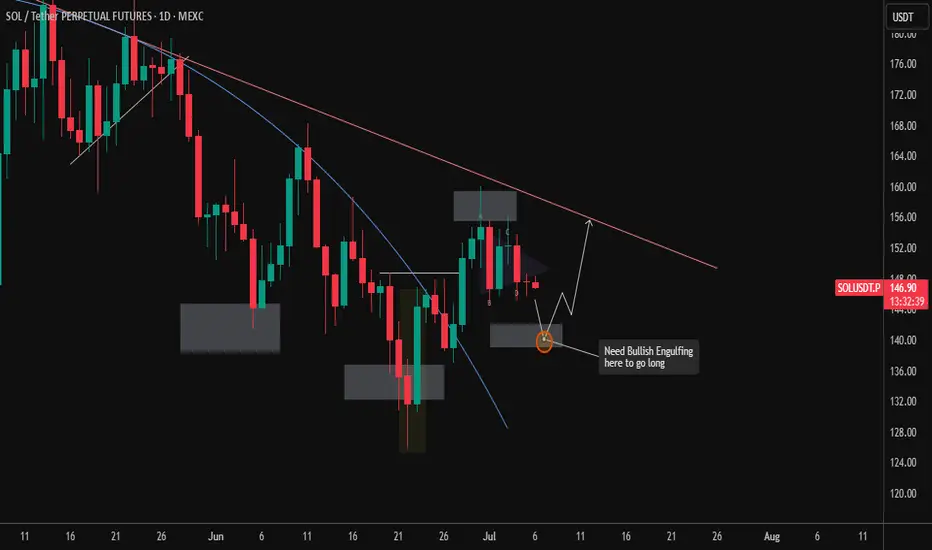
SOLUSDT.P – Waiting for Bullish Confirmation at Key ZoneThe daily chart of SOLUSDT Perpetual Futures (MEXC) is currently showing signs of a potential reversal setup, but confirmation is key before taking a long position.
🔍 Chart Overview:
Price action is in a clear downtrend, with lower highs forming consistently, capped by a descending trendline.
We’ve recently seen a pullback after a failed breakout near the $152–$154 region.
📌 Key Zone to Watch:
A demand zone around $137–$140 is marked, which previously acted as a springboard for bullish movement.
There's a confluence of this demand zone with the wedge breakout retest area.
📈 Trade Setup & Plan:
The chart notes: "Need Bullish Engulfing here to go long".
This implies a waiting strategy: look for a strong bullish engulfing candle at the $137–$140 zone before entering a long position.
If confirmed, price could rally back toward the descending trendline near $150–$154, which aligns with the prior resistance level.
⚠️ Invalidation:
A daily close below $135 would invalidate the bullish setup and likely trigger continuation toward $128–$130 support area.
📊 Summary:
Bias: Cautiously Bullish (Waiting for confirmation)
Entry Trigger: Bullish engulfing candle at $137–$140
Target: $152–$154
Invalidation Level: Below $135
Patience is key here. Let the price come to you and confirm intent before jumping in.
SOL — Breakout Watch & Range Play1. Watch for breakout above trendline
2. Hold support 151–147 for bullish scenario
3. Target: 168.4 (pre month high)
4. Stop: below 125.9 (pre month low)

HolderStat┆SOLUSD got out of the triangleBYBIT:SOLUSDT is trading in a well-structured upward channel with a history of consolidation zones acting as breakout springboards. The price recently bounced off trend support and now targets the resistance at 170. Structure remains bullish as higher lows continue to form.

HolderStat┆SOLUSD held the support lineOKX:SOLUSDT is consolidating above 147.63 inside a rising channel. Bullish continuation is likely, with 167.89 acting as the next key resistance. Historical patterns suggest a breakout is forming.

HolderStat┆SOLUSD seeks to the resistance lineBINANCE:SOLUSDT has broken out of a descending wedge and is coiling in a symmetrical triangle above 150. The setup supports a push toward 165–170, with momentum favoring bulls if the triangle resolves upward.

#SOL/USDT Loves THIS Pattern | BULLISH#SOL
The price is moving within a descending channel on the 1-hour frame, adhering well to it, and is on its way to breaking strongly upwards and retesting it.
We have a bounce from the lower boundary of the descending channel. This support is at 143.
We have a downtrend on the RSI indicator that is about to break and retest, supporting the upside.
There is a major support area in green at 142, which represents a strong basis for the upside.
Don't forget a simple thing: ease and capital.
When you reach the first target, save some money and then change your stop-loss order to an entry order.
For inquiries, please leave a comment.
We have a trend to hold above the moving average of 100.
Entry price: 149.
First target: 153.
Second target: 156.
Third target: 159.
Don't forget a simple thing: ease and capital.
When you reach the first target, save some money and then change your stop-loss order to an entry order.
For inquiries, please leave a comment.
Thank you.

Can SOL break out strong and rally 12% to $185?Hello✌
let’s dive into a full analysis of the upcoming price potential for Solana📈.
BINANCE:SOLUSDT is forming a clear inverse head and shoulders pattern near a strong daily support zone, signaling a potential trend reversal. This setup suggests at least a 12% upside, targeting $185, marking a promising start for SOL’s next bullish move. 📊🔥
✨ Need a little love!
We pour love into every post your support keeps us inspired! 💛 Don’t be shy, we’d love to hear from you on comments. Big thanks , Mad Whale 🐋

Solana starting to look bullish again | Target $180 - $260In my previous idea, I anticipated a liquidity hunt below the $140 level, and price action played out exactly as expected. SOL wicked below this key support zone, triggering stop-losses and inducing panic selling — classic behavior before a major reversal. Following this sweep, price quickly reclaimed the range, breaking out of the downward channel, and is now retesting a bullish break of a textbook cup-and-handle pattern, signaling a potential trend continuation to the upside.
📊 Technical Setup
Cup and Handle formation is evident, with the "handle" forming as a downward-sloping channel now being challenged.
Price reclaimed the $140 demand zone post-sweep and is now retesting.
Target zones: $180 → $220 → $260 based on historical resistance levels and measured move projections.
📉 Invalidation Level
A daily close below $120 (marked as the Invalidation Zone) would invalidate this setup and suggest bulls have lost control.
🌐 Macro Perspective
Fed Rate Cut anticipation and cooling inflation data are helping risk-on assets like crypto regain momentum.
SOL staking ETF launching this week, while SOL spot ETF approval imminent.
Solana's growing DeFi ecosystem, along with high TPS performance and low fees, continues to attract developer and user activity. SOL remains a top candidate for sector outperformance in a bullish H2 crypto cycle.
📌 Conclusion
With market structure turning favorable and strong macro tailwinds, SOL may be gearing up for a major breakout rally. Watch the $160 level closely — a decisive break and hold above could confirm the next leg higher.

Solana (SOL/USDT) 4H Reverse H&S PatternSolana (SOL/USDT) – 4H Market Outlook | July 1, 2025
Introduction
SOL has formed a reverse head and shoulders pattern, followed by a clean breakout above resistance. While the lower time frame is bullish, the higher time frame remains bearish, creating a short-term opportunity within a broader downtrend.
Context 1: Key Zones
Supply Zone: 176 – 187
Demand Zone: 126 – 143
Psychological Levels: 140 and 160
Context 2: Technical Structure
Pattern: Reverse Head & Shoulders
Breakout: Confirmed above neckline/resistance
FVGs:
One below price (within demand)
One above price (potential target)
Golden Pocket: Sits just above lower FVG and inside demand — strong confluence support
Context 3: Volume Insight
OBV Indicator: Shows a sudden volume spike, adding strength to the breakout and the bullish pattern confirmation.
Bullish Scenario
Price pulls back into the golden pocket + FVG + demand zone
Finds support → bounces to form higher low
Second leg of the move breaks swing high → targets upper FVG and 160 psychological level
Bearish Scenario
Price breaks back below demand zone and invalidates the golden pocket
Fails to hold structure → reverts to macro bearish trend
Potential retest of previous swing low below 126
Summary
SOL is showing bullish momentum on the 4H after completing a reversal pattern and spiking in volume. A pullback into the demand zone confluence may offer a strong long setup — but failure to hold could revalidate the higher timeframe downtrend.

SHORT - SOLUSDTEdge:
- Order Flow => Increase in OI, decrease in CVD, strong increase in net shorts.
- structural edge
- CVD spot and CVD futures are diverging: CVD spot going down => CVD futures staying flat/increasing slightly. Latest wave up is solely made by leveraged positions. No real demand.

5 RRPossible Elliott wave triangle suggests a new local high in the near future giving a trade opportunity at the untested range. Target may be adjusted--that provided is conservative.

#SOL Update #2 – July 5, 2025🔴 #SOL Update #2 – July 5, 2025
Yesterday, I mentioned that Solana was at a critical level and not suitable for long or short entries. I also noted that I’d stay in watch mode and that hasn’t changed.
Right now, SOL is trying to hold above the support box, but volume remains quite low. Even worse, footprint data is showing negative pressure. If SOL loses the $144.5 level, I expect a move toward the $137–136 zone, as mentioned in my previous update.
Let’s also not forget that the $150 area is a strong resistance. At this stage, I don’t see any high-probability setup on either side. I’m still watching. No trade for now.

SOL SCALP SetupSOl can retrace to 175$ on ltf, must use sl before taking any trade. Market is too volatile now

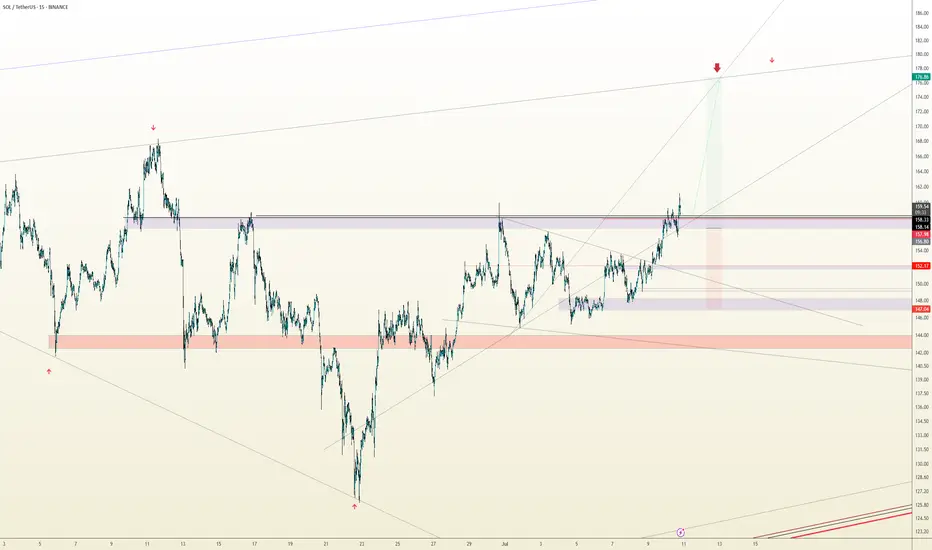
SOL/USDT Technical Outlook – Breakout Holding, Eyes on 175+Solana has successfully broken above the key resistance zone at $155–157 and is currently testing it as new support. If the level holds, this breakout could extend toward the next major target around $175–178.
📌 Key Insights:
Clean breakout followed by a potential SR flip
Watch for confirmation of support before continuation
Target aligns with previous swing high
Invalidated on breakdown below reclaimed level
🟢 Bias remains bullish as long as price holds above the breakout zone. A confirmed retest could provide a high-probability long setup.
SOLUSDT → Countertrend correction and hunt for liquidityBINANCE:SOLUSDT looks quite promising on the bullish side. The price is testing one of the key resistance levels within the local trend rally. A correction is forming. Is it beneficial for us?
On the higher timeframe, we see a change in character, a breakout of the trend resistance, and the formation of an upward trend support line. Bitcoin is still bullish (locally) at this time, but it is consolidating, which generally provokes a correction in SOL as well. Focus on the 150-149 area. If the bulls are able to keep the price above this zone after the retest, followed by the formation of momentum, this can be considered a positive medium-term sign.
Locally, the price within the trading range of 149.36 - 158 is heading towards the area of interest and liquidity (eql) at 149.36. The current sell-off is most likely triggered by a large player seeking a more favorable entry into the market.
Resistance levels: 154.75, 156.8
Support levels: 149.36, 147.93
In the current situation, it makes the most sense to consider an intraday trading strategy. A countertrend correction and a retest of support could attract buyers...
Best regards, R. Linda!

SOLUSDT Bullish Flag Pattern!Price has formed a Bullish Flag pattern on the daily timeframe. After multiple touches of both support and resistance, the price has now broken out above the falg resistance, signaling a potential trend reversal. and price trading above 50 and 100 EMA
Currently, SOL is bouncing from the channel breakout level, indicating strong bullish momentum. A clean breakout candle confirms buying interest, and the setup favors a strong bullish continuation if the breakout sustains.
Entry: Above $150
Stop-loss: Below $135
CRYPTOCAP:SOL TRADENATION:SOLANA

SOLUSDT – Bullish Intraday AnalysisSOLUSDT – Bullish Intraday Analysis
]SOLUSDT is showing bullish momentum and currently testing a key resistance zone. Price action on lower time frames indicates a change of character (ChoCh), hinting at a possible trend reversal or continuation to the upside.
Key Technical Highlights:
✅ Resistance Breakout in Progress: If price holds above the local resistance zone (likely near a prior high or supply zone), we may see further upside.
✅ Structure Shift: A clear break and retest on lower time frames suggests
You may find more details in the chart Ps Support with like and comments for more analysis.

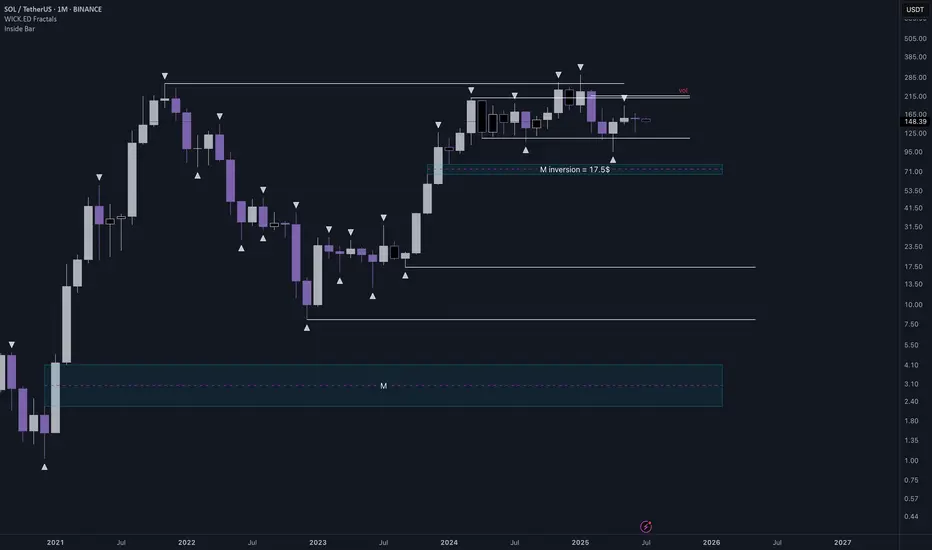
SOLUSDTThere is no confirmation about short scenario yet, but I think we are in distribution phase, so I will wait for short opportunity in 190-220$ zone
News about Solana ETF with staking just give more confidence in such scenario
First target is 80$.
Also we have much lower targets but it is too early to say about them
SOLANA ABOUT TO EXPLODE?CRYPTOCAP:SOL just broke out and is surging within a long-term bullish channel
Price action is clean, momentum is strong, and if this channel holds — we might be eyeing $700+ in the next run.
This is not the time to ignore Solana.
Chart says it all.
DYOR. Stay sharp.

SOL — Liquidity Sweep & Demand Play1. Wait for price to sweep into demand
2. Enter long on SFP or strong bounce
3. Target: 240+
4. Stop: below demand zone
If no sweep, stay flat or wait for clear reclaim
