SOL/USDT Technical OutlookPrice may push higher towards the $194 resistance zone.
From there, a sharp rejection is expected, targeting the $171 support area.
If the market fails to hold $171, the next potential downside target lies around $140.
Key Levels:
Resistance: $194
Support: $171, then $140
Structure: Rising channel breakdown in play
📉 Bearish scenario activated if $171 fails to hold.
SOLUSDT.P trade ideas

TradeCityPro | SOL Holds PRZ as Bulls Eye Range Breakout👋 Welcome to TradeCity Pro!
In this analysis, I want to review the SOL coin for you. This is one of the popular Layer1 projects, nicknamed the “Ethereum killer,” with a market cap of $85 billion, currently ranked 6 on CoinMarketCap.
📅 Weekly timeframe
In the weekly timeframe, after the bankruptcy news related to FTX, this coin had a very sharp bearish move and even dropped to as low as 9.84, but it managed to recover afterward.
⭐ From the key top at 27.62, a very strong bullish move started, reaching up to 255.96 and retesting its previous ATH.
📊 Currently, a range box has formed between the 128.66 and 255.96 levels, where the bottom of this box is a very strong PRZ, created from the overlap of a major support zone and the area between the 0.236 and 0.382 Fibonacci levels.
🔍 Also, the price is being supported by the SMA99, which has supported the price twice so far and has prevented the box from breaking to the downside.
⚡️ If you have already bought SOL, you can set your stop-loss if the price closes below this area. A confirmed breakdown could lead to deep corrections toward lower Fibonacci levels.
🛒 For buying this coin, the first trigger is the break of 178.22, which is a bit riskier but offers a good price entry. On the other hand, if the price revisits 128.66 and gives confirmation, we can enter from there.
📈 However, the main trigger for spot entry is the breakout of the 255.96 top. Breaking this level can unlock some very ambitious targets. If that happens, I’ll definitely update the analysis and provide those targets.
📅 Daily timeframe
In this timeframe, we can see the price action in more detail. A small range box has formed between 144.11 and 164.74, and the price is currently stuck below the top of the box and reacting to it.
✨ If 164.74 breaks, we can enter a long position. The next major resistance is 183.54. A breakout above that will serve as the main confirmation for a long position targeting 255.96, which can also be used as a spot trigger.
💥 The RSI oscillator is now above the 50 zone, and if it enters the Overbuy area, it will serve as strong momentum confirmation for this position.
✅ If the price gets rejected from the top, we can also open short positions on lower timeframes. A break below 144.11 will be the main short trigger.
📝 Final Thoughts
This analysis reflects our opinions and is not financial advice.
Share your thoughts in the comments, and don’t forget to share this analysis with your friends! ❤️

Solana starting to look bullish again | Target $180 - $260In my previous idea, I anticipated a liquidity hunt below the $140 level, and price action played out exactly as expected. SOL wicked below this key support zone, triggering stop-losses and inducing panic selling — classic behavior before a major reversal. Following this sweep, price quickly reclaimed the range, breaking out of the downward channel, and is now retesting a bullish break of a textbook cup-and-handle pattern, signaling a potential trend continuation to the upside.
📊 Technical Setup
Cup and Handle formation is evident, with the "handle" forming as a downward-sloping channel now being challenged.
Price reclaimed the $140 demand zone post-sweep and is now retesting.
Target zones: $180 → $220 → $260 based on historical resistance levels and measured move projections.
📉 Invalidation Level
A daily close below $120 (marked as the Invalidation Zone) would invalidate this setup and suggest bulls have lost control.
🌐 Macro Perspective
Fed Rate Cut anticipation and cooling inflation data are helping risk-on assets like crypto regain momentum.
SOL staking ETF launching this week, while SOL spot ETF approval imminent.
Solana's growing DeFi ecosystem, along with high TPS performance and low fees, continues to attract developer and user activity. SOL remains a top candidate for sector outperformance in a bullish H2 crypto cycle.
📌 Conclusion
With market structure turning favorable and strong macro tailwinds, SOL may be gearing up for a major breakout rally. Watch the $160 level closely — a decisive break and hold above could confirm the next leg higher.

SOL/USDT : SOL Rebounds Strong – Is a 25% Rally Just Beginning?By analyzing the Solana (SOL) chart on the daily timeframe, we can see that after dropping to the $147.75 zone, the price experienced renewed buying pressure and has since rallied to around $159, delivering over 6% return so far.
This cryptocurrency shows strong bullish potential, with short-term gains possibly exceeding 25%.
The next upside targets are $168.5, $187, $220, and $263.
Please support me with your likes and comments to motivate me to share more analysis with you and share your opinion about the possible trend of this chart with me !
Best Regards , Arman Shaban

$SOL breakoutbeen waiting for quite sometime for this to break.
taking a good size low lev long on todays close.
invalidation if we get a daily close below the tl, really good r/r to ignore
gl

SOL long running - follow up on the Cup & Handle ideaPrice closed above both key levels I mentioned — 181 and the HTF S&R at 188 — with momentum and structure confirmation. That gave me enough conviction to enter a long.
🎯 Final TP aligns closely with the measured move target: 245.
📈 SL is already at breakeven after TP1 hit — risk-free from here.
Let’s see if SOL completes the full handle breakout.

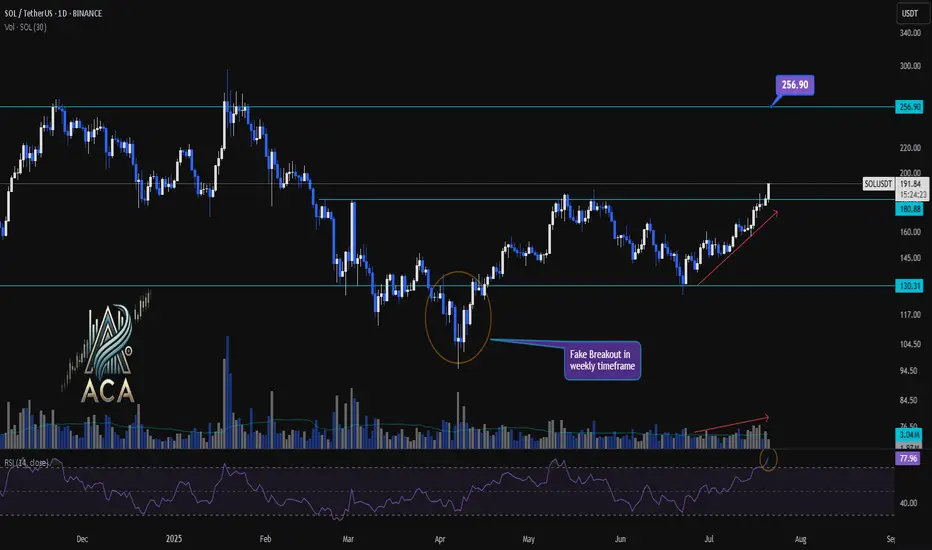
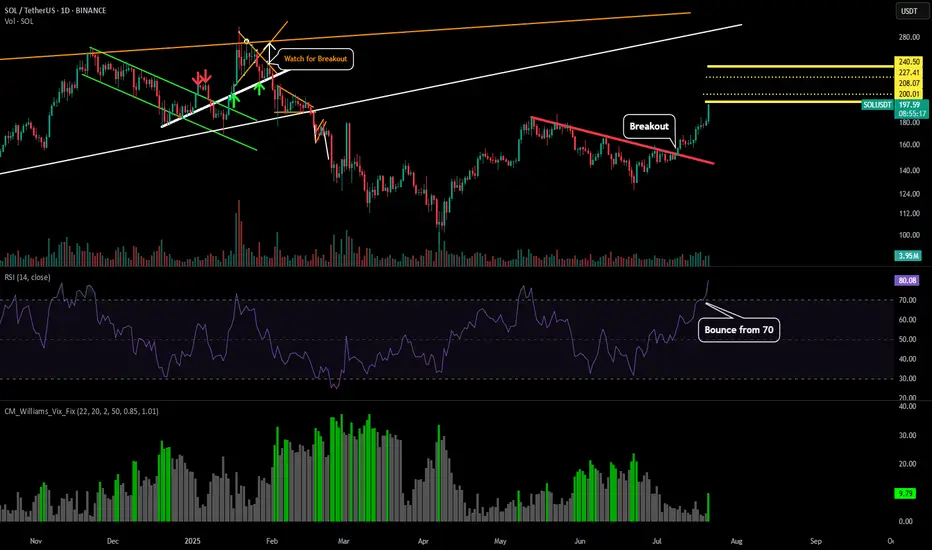
SOLUSDT 1D Chart Analysis | Accumulation Breakout Signals....SOLUSDT 1D Chart Analysis | Accumulation Breakout Signals Fresh Momentum
🔍 Let’s drill into the SOL/USDT daily chart, focusing on the recent breakout above the accumulation range, key support and resistance levels, RSI momentum, and volume confirmation for a robust bullish scenario.
⏳ Daily Overview
SOLUSDT has decisively broken out above a prolonged accumulation box, marking a significant shift in market structure. A daily close beyond this range now serves as a strong indicator for renewed bullish momentum. RSI is currently above 77, signaling that buyers are commanding momentum. Notably, volume has surged in tandem with price, confirming trader participation behind this breakout move.
📈 Technical Convergence and Trend Structure
- Accumulation Zone Break: After consolidating within a clear box for weeks, SOLUSDT closed above the upper boundary (around $180.88–$191.05), signaling a possible trend reversal or continuation.
- Daily Close Signal: A daily close outside the accumulation box offers high conviction for bullish continuation. This close acts as a potential entry signal for trend-followers.
- RSI Momentum: The RSI sits above 77—deep in the overbought territory. A close here not only confirms buyer strength but often precedes sustained uptrends when accompanied by price breakouts.
- Volume Surge: Volume has increased with the breakout, providing confirmation the move isn’t a false start, but likely fueled by real demand.
- Weekly Fake Breakout: There was a notable false breakout in the weekly timeframe, quickly reclaimed by bulls. This flip suggests buyers fended off downside attempts and now drive higher prices.
🔺 Bullish Setup & Targets
- First Target: $256.90 — marking the next major resistance on the chart and a logical upside objective for traders.
- Key Trigger: A confirmed daily (or weekly) close above the accumulation range with strong volume is essential for validating the upward trajectory.
📊 Key Highlights
- The breakdown of the accumulation box—now turned support—marks a pivotal structural change.
- RSI and price are making new local highs, solidifying the case for continued bullish momentum.
- Volume is climbing in sync with the move, offering real confirmation versus a potential fakeout.
- Recent fake breakout on the weekly chart, immediately negated, emphasizes that buyers are regaining—and likely maintaining—control.
🚨 Conclusion
SOLUSDT appears set for higher prices following the confirmed breakout above the accumulation range. Signs of trend health include an overbought RSI, volume confirmation, and the swift invalidation of a recent weekly fake breakout. As long as daily closes stay above the breakout level, the path remains clear for a rally toward $256.90. A strong daily close and continued volume will be your best signals for bullish continuation.
Solana (SOL/USDT) Technical Analysis – 4H🚀 Solana (SOL/USDT) Technical Analysis – 4H Timeframe | July 20, 2025
Solana is currently testing the major resistance at 181.57, riding a strong bullish trend across all timeframes. Price action, moving averages, and volume all point to a continuation — provided key confirmations hold.
🔍 Chart Structure & Key Levels
- 🔺 Resistance: 181.57
- 🟩 Supports: 168.21 | 158.39 | 145.58 (key support on deep correction)
📈 Indicators Snapshot
- ✅ Moving Averages: 14 of 15 flashing Buy — strong uptrend in play
- 🟡 Oscillators: RSI at 70.19 — near overbought, but no clear sell signal
- 🔁 MACD: Weak Sell — possible divergence or slowdown
- ❗️ AO & ADX: Neutral — waiting for confirmation
🧠 Fundamentals via Bitcoin
- BTC is ranging 🔄
- BTC Dominance is declining 🔻 → Good for alts like Solana
📊 Scenarios
🟢 Breakout Above 181.57
- Next targets: 188 → 195 → 199.74
- Valid if confirmed with volume + stable BTC
🟡 Rejected at Resistance – Pullback to Support
- Watch EMA20 (~176) & 168.21 for re-entry with better risk
🔴 Deeper Correction
- Losing 168.21 → Possible drop to 158.39 or 145.58
---
✅ Trade Idea: Entry above 181.57 only with confirmation — volume, breakout candle, or lower timeframe trigger
⚠️ Watch BTC — any sharp move could affect SOL
📉 Avoid jumping in before a confirmed breakout or clean pullback
---
🧲 Like what you see?
🔔 Follow for more pro-level setups
🚀 Smash the rocket if you're flying with Solana

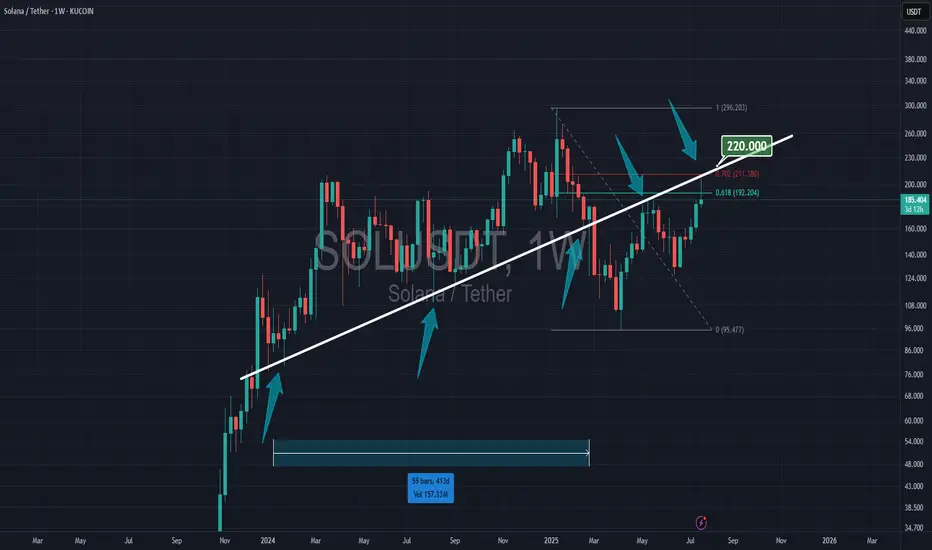
SOLANA & 220 RESISTANCESolana is at 61% of Fibonacci, and the trendline has held since early 2024. To stay in the bull run, Solana must break the 220 resistance.
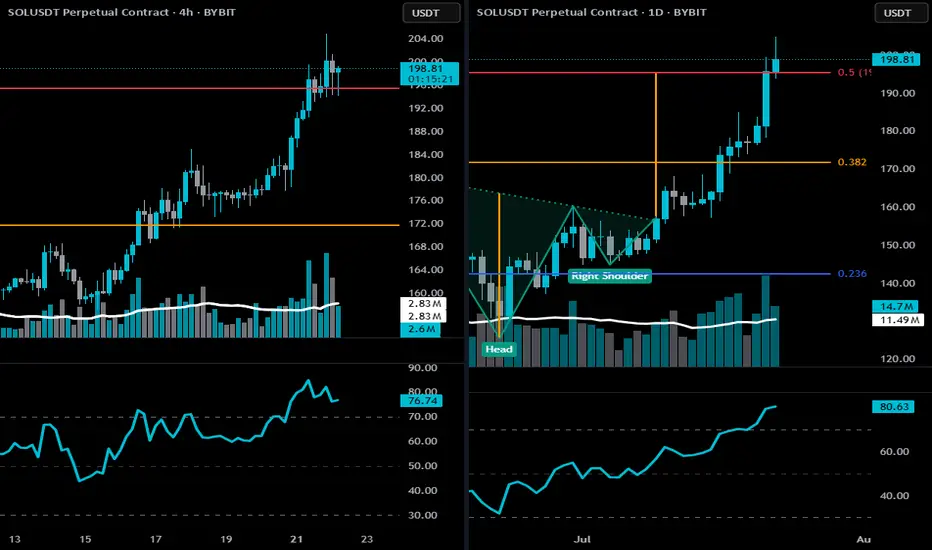
SOL CRUSHING-bearish risks developing🔻 4-Hour Bearish Thesis
🔸 Price Action Clues
SOL is currently stalling at the 0.5 Fibonacci retracement (~$198.18) of the full macro move — a classic profit-taking zone.
Multiple upper wicks and indecisive candles at resistance indicate supply absorption and buyer exhaustion.
After a steep rally, price is moving sideways in a rising wedge/flag, which is a bearish continuation pattern if broken downward.
🔸 Momentum + RSI
RSI at 76 is extended and flattening — often a zone where short-term pullbacks begin.
No confirmed bearish divergence yet, but momentum is weakening compared to earlier stages of the rally.
🔸 Volume Profile
Volume on recent pushes is lower than during breakout, suggesting diminishing bullish conviction.
Bearish if a breakdown below $194 occurs — that's the former breakout level and wedge support.
🧨 4H Breakdown Confirmation
Break below $194 (key short-term support) → opens downside targets:
🔻 $186–$182 (prior breakout base)
🔻 $171 (0.382 Fib retracement zone)
🔻 Daily Bearish Thesis
🔸 Price Action + Key Zone
Price is pressing against the neckline target ($198.18) of the inverse H&S pattern.
Stalling under the red resistance line and 0.5 Fib.
Recent candle closed with a small upper wick + reduced body size, hinting at hesitation after a parabolic run.
🔸 RSI Risk
RSI is at 80.41 — very overbought on daily.
While not immediately bearish on its own, this often precedes either:
Sharp correction, or
Prolonged consolidation
🔸 Fibonacci & Macro Resistance
$198–$200 is a confluence zone of:
0.5 Fib retracement
Previous structural resistance
Measured target of inverse H&S pattern ALREADY HIT.
This is not a great spot to initiate new longs — any weakness here invites a pullback.
⚠️ Invalidation of Bearish Thesis
A strong daily close above $200–$204, ideally with expanding volume, would invalidate the bearish outlook and shift momentum toward $219 (0.618 Fib).
🧠 Summary:
Yes, there is a short-to-mid-term bearish risk developing on both 4h and daily:
Overbought RSI
Stalling at major Fib resistance
Decreasing momentum
Vulnerable if $194–$195 breaks
Remember: this WILL MOST LIKELY BE A SHORT-SHORT pullback, not a confirmed trend reversal… yet. BUT I'VE INITIATED A STARTING POSITION!
THIS IS NOT FINANCIAL ADVICE. DrAnkin Smöökëē Whizkee. Edumacational Purpiz Only!
SOL - Upside TargetsAs we see Solana's breakout continue I wanted to outline the short term levels to watch for. All are outlined with yellow rays.
$200 (Psychological level)
$208 (Market structure)
$227 (Market structure)
$240 (Key liquidity level)
The the white line at the top would be the extension level that could put Sol at new all time highs.
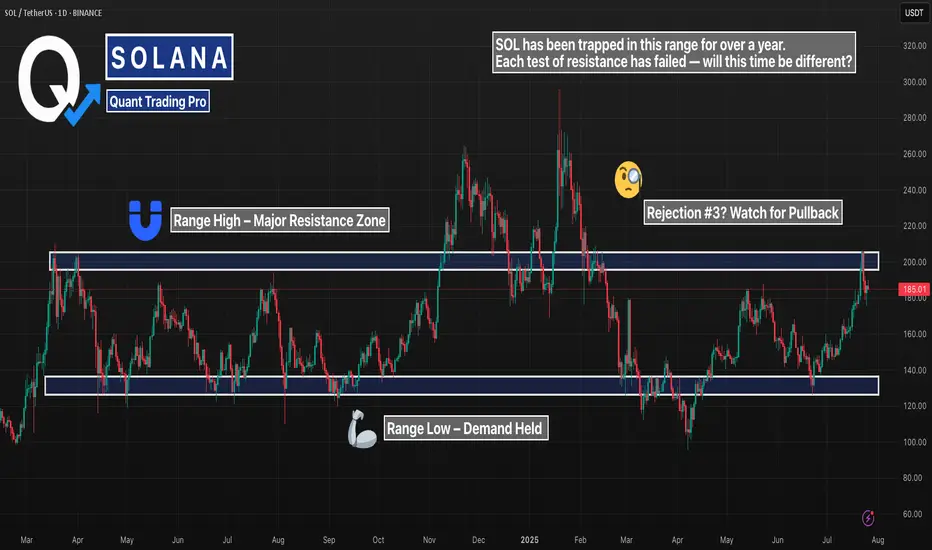
SOL 1D – Range High Rejected… Again?Solana just tapped major resistance — the same level that’s capped every rally since early 2024. This is now the third clean rejection off the $200 zone, and the structure couldn’t be more clear:
– Long-standing range between $115 and $200
– Previous rejections at the top led to full retracements
– This latest attempt? Rejected again — for now
If bulls want to flip the script, they’ll need a confirmed breakout with volume and a clean retest. Otherwise, this chart is screaming “range still intact.”
Until proven otherwise, this zone remains supply-heavy. Keep your risk tight — the next leg could move fast.
#Solana #SOL #RangeTrading #ResistanceZone #CryptoAnalysis #TechnicalBreakdown #QuantTradingPro #PriceAction
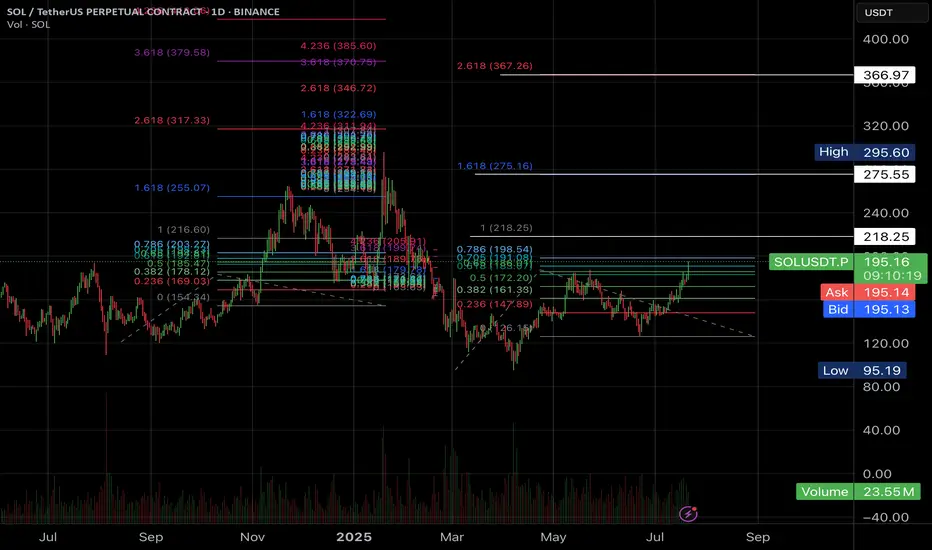
#SOL for 367$?Hi Padawans,
Hope you’re all doing well.
The charts don’t lie — but remember, this isn’t financial advice.
I’m currently eyeing long positions up to the levels highlighted in the chart.
Best regards,
CryptoObi
SOLUSDTThis signal for bull-trend because breaked trendline and higher high higher low.
best entry: 154
stop: 136
traget: 226
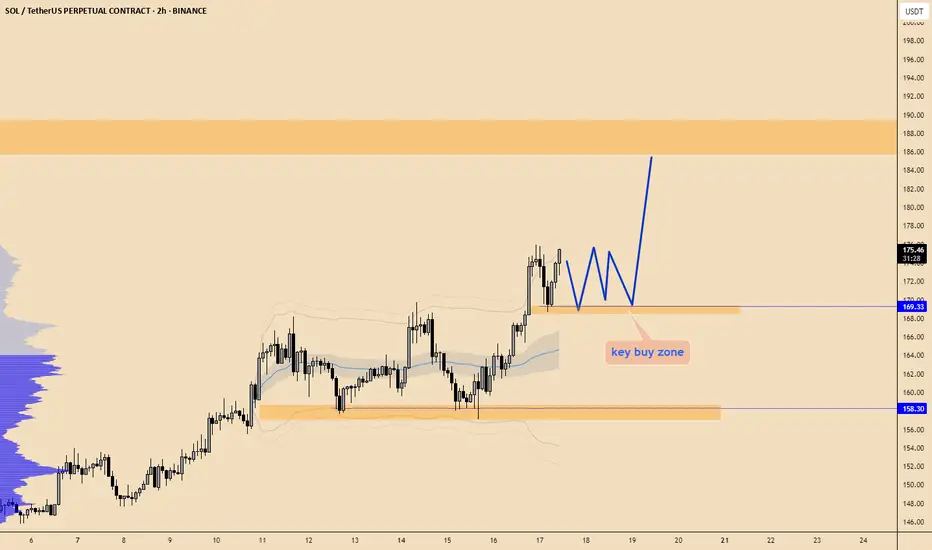
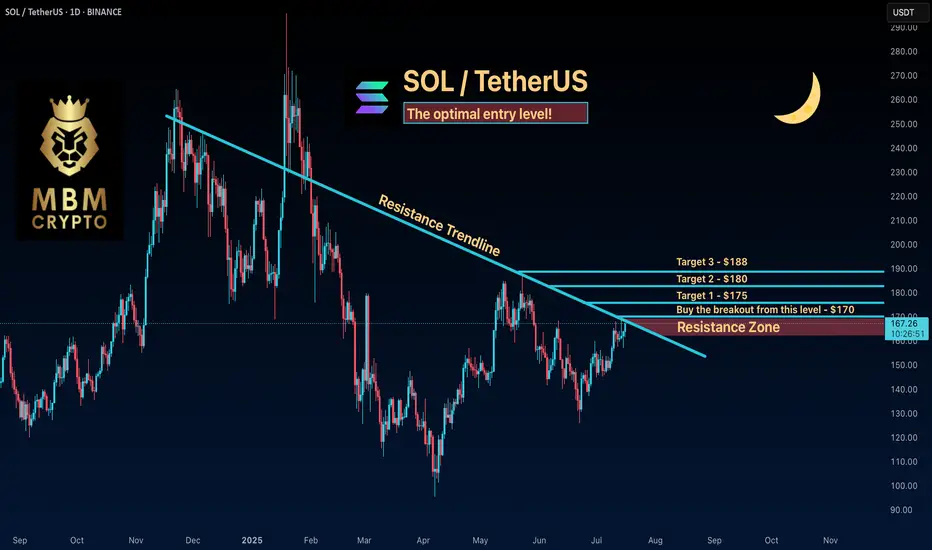
SOL: The optimal entry level! Keep an Eye on SOL
Now is the time to watch SOL. If the price breaks to the upside, we could see a significant move that might take it above $190!
Trading Setup
If you’re considering trading SOL, here’s a quick setup that may help you.
The idea is: Buy when the price breaks above $170 and take profits at the levels shown in the chart.
Targets:
1. $175
2. $180
3. $188
-------------------------------------------
About our trades:
Our success rate is notably high, with 10 out of 11 posted trade setups achieving at least their first target upon a breakout price breach (The most on TW!). Our TradingView page serves as a testament to this claim, and we invite you to verify it!
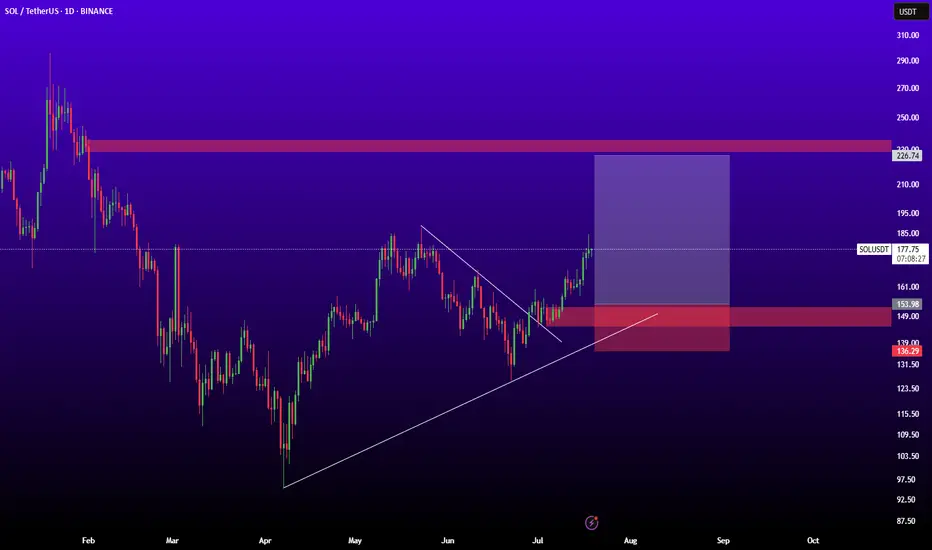
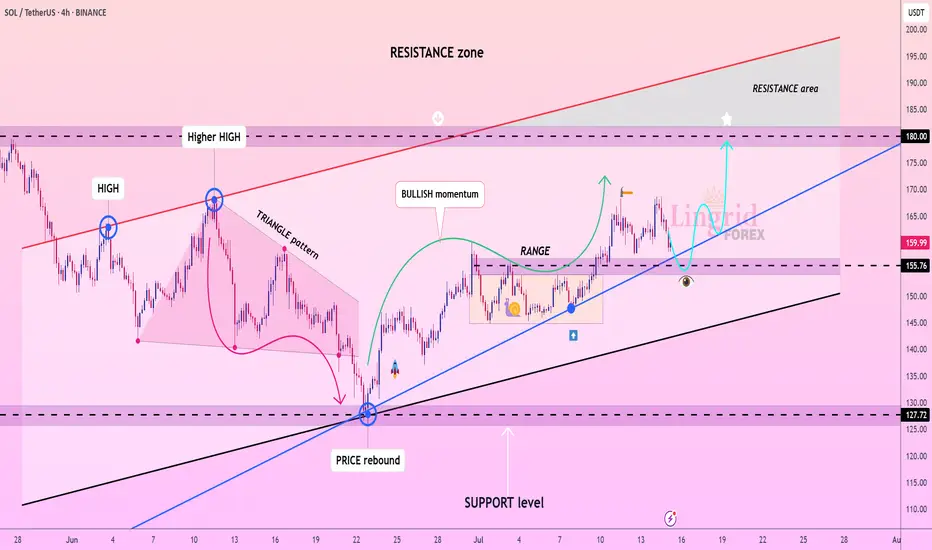
Lingrid | SOLUSDT trend Continuation TradeThe price perfectly fulfilled my previous idea . BINANCE:SOLUSDT found strong support around the 155.7 level after a brief pullback and continues to respect the ascending blue trendline. The previous bullish impulse followed by a healthy consolidation suggests a classic trend continuation structure. If buyers defend the current demand zone and reclaim upward momentum, a move toward the 180 resistance zone is likely. This setup aligns with broader bullish market structure and rising channel dynamics.
📉 Key Levels
Buy trigger: confirmed bounce from 155.7 trendline support
Buy zone: 155.7–158.0 (range floor and trendline confluence)
Target: 180.0
Invalidation: breakdown below 155.0 signals structure shift
💡 Risks
Volatility around trendline retest could trigger stop hunts
Failure to reclaim momentum above 165 may lead to ranging
Sudden market-wide weakness could pressure altcoins broadly
If this idea resonates with you or you have your own opinion, traders, hit the comments. I’m excited to read your thoughts!
Solana - The Cup is Almost FullSolana is printing a textbook cup & handle formation on the daily, and price is now pressing against the neckline resistance near $185, just below the psychological $200 zone.
This structure reflects months of accumulation and rising momentum. A confirmed breakout above the $185–$199 resistance would likely trigger the next upward leg.
This setup signals trend reversal continuation, and if SOL closes above $199 on high volume, momentum traders may pile in quickly.
📌 Invalidation below $150 = pattern risk-off.

#SOL Update #5 – July 18, 2025#SOL Update #5 – July 18, 2025
Solana has returned to the region where its last impulsive move was formed. It appears to be attempting another bounce, but when we look at the SOL/BTC pair, it is currently facing a strong resistance zone.
There isn't much room between this resistance and the 200 MA band, which makes this a critical decision zone. At the moment, I do not recommend entering either a Long or Short position — it’s best to wait and observe.
If Solana breaks out to the upside, the next target will likely be $179.

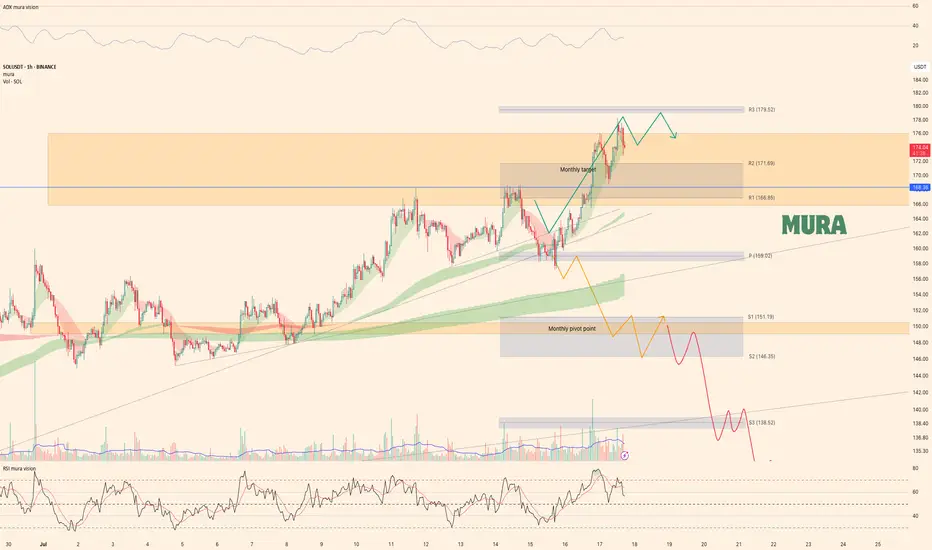
Solana - Weekly Technical UpdatePrice Action Summary:
Successfully met our weekly expectations following a minor correction
Broke both local trendlines and the weekly pivot point
Reclaimed position above weekly pivot during the bullish MA crossover (optimal long entry per plan)
Currently trading slightly above second monthly target at $175.9
Third weekly target remains active while price holds above $168.3
Technical Observations:
1 Momentum Warning Signs:
Trend weakening (declining ADX)
Bearish RSI divergence forming
2 Key Levels:
Upside: Weekly target continuation above $168.3
Downside: Potential correction if divergence confirms
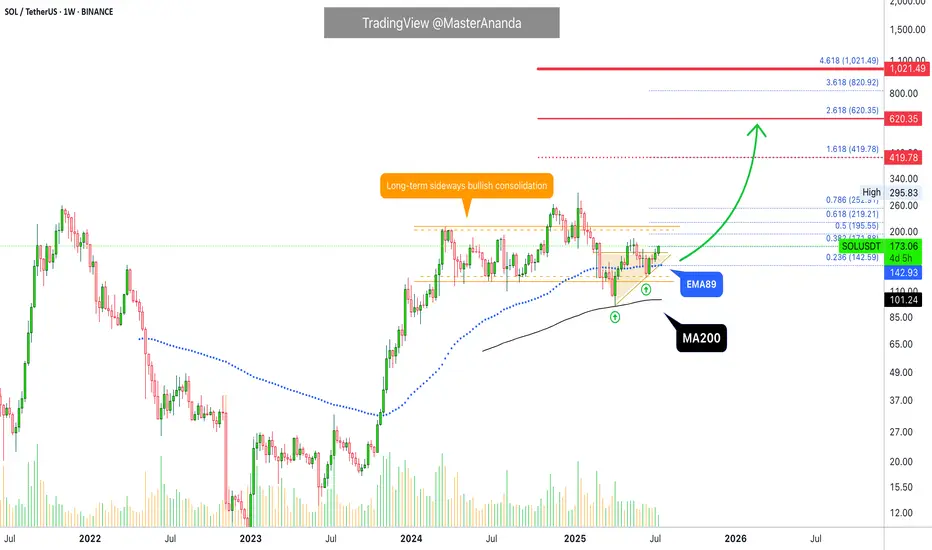
Solana Ultra-Bullish Above MA200 & EMA89 · $1,000 ExplainedOne guy was saying Solana was set to move lower because it already produced a "3,000% bullish wave." What nonsense... Solana is ultra-bullish. We don't do an analysis based on some unintelligent assumption rather, we focus on the data, the signals, the indicators, the chart.
Solana corrected and found support perfectly, exactly at MA200 in April 2025. Boom! It never went below so it was never bearish to start. A true long-term bull market a la Bitcoin.
And more recently, on the 16/23-June weeks, it traded briefly below EMA89 just to recover and later start rising. This is a strong bullish signal on its own. The fact that bears tried to push prices lower and failed; bullish. The fact that there is a strong higher low between the test of MA200 and EMA89. The fact that we can make mistakes with our interpretations but the chart is never wrong.
The fact is that Solana is going up with the next easy but strong target being $420. It can reach, later down the road, $620 and even higher to peak at $1,000+. Can you see what I see? Crypto is going up.
Bitcoin is going up. Solana is going up. Ethereum is going up. Cardano is going up. XRP is going up. Dogecoin is going up. We are going up. The new financial market is growing. It is not just these projects but Cryptocurrency will replace the old financial system, this is another fact. The older system will be left behind because Crypto's market cap. will grow so strong and so fast, maybe a 10 years long bull market will do the trick, we will start with four.
If you want to be high more forever rich, buy Crypto. Solana is a good choice.
Thanks a lot for your continued support.
Namaste.
SOL/USDT – Preparing for the Next Breakout🚀 SOL/USDT – Preparing for the Next Breakout
Hey everyone 👋
Here’s a detailed look at Solana (SOL) and some key confluences across multiple charts. Let’s dive in:
---
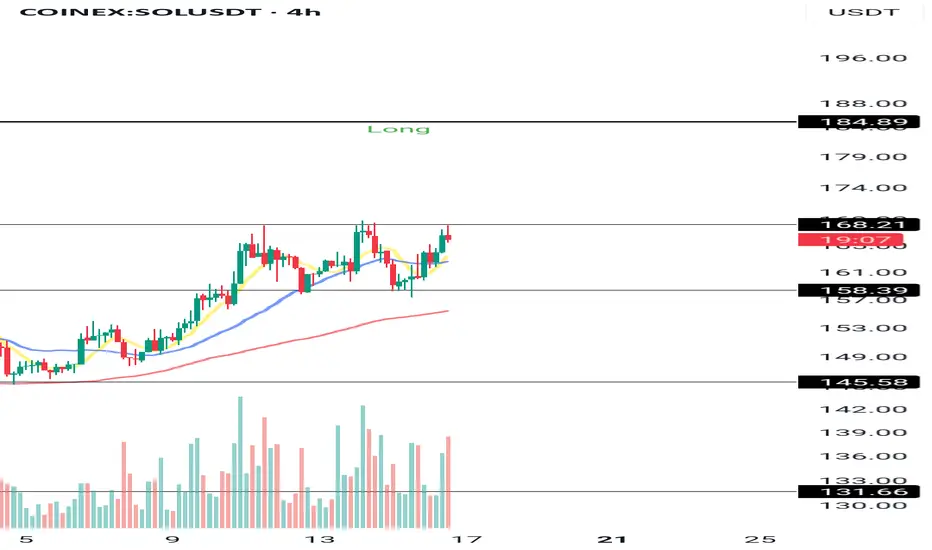
🔹 SOL/USDT – 4H Chart
SOL is currently sitting at a very interesting level.
🔑 If we break and hold above 168.21, the path toward 185 becomes much clearer.
📍 The 185 zone is a strong level and technically a safer long, but it also comes with a higher chance of fake breakouts and chop.
That’s why — if market conditions align — I’d prefer to open a long position above 168.21, so I’m not getting trapped later at 185.
---
📈 SOL Dominance (SOL.D) – 4H
A key level here is 2.41.
If SOL.D breaks this level at the same time as SOL/USDT breaks 168.21, it acts as a strong confirmation for a long position.
---
🔁 SOL/BTC
Another useful chart for context:
✅ 0.001351 has already been broken — a good initial sign.
🔓 A breakout above 0.001424 would provide extra confirmation for a SOL/USDT long setup.
---
💰 TOTAL3 – Altcoin Market Cap (excluding BTC & ETH)
This is crucial for overall altcoin sentiment.
📍 The key level here is 965B.
If this level breaks, it signals strong capital inflow into altcoins — and likely becomes the first trigger for a SOL long position.
---
🎯 What’s the Long Setup All About?
The goal here is not to catch a move at 185 — that’s too risky due to likely fakeouts.
Instead, we want to enter earlier (at 168.21) if momentum supports it, and ride the move safely.
🛠 Plan:
Wait for a 4H candle close above 168.21
Look for volume + momentum confirmation
Use a Stop Buy order above this level to enter
This way, we’ll be in a strong position before the noise starts at 185.
---
🙏 Thanks for reading.
If you found this analysis useful, don’t forget to hit the 🚀 icon and follow for more!
Solana (SOL): Going For +70% Target | Buyers Are Accumilating!Solana has a good opportunity to bounce from here, which would give us multiple trading opportunities that we talked about in the video!
More in-depth info is in the video—enjoy!
Swallow Academy
