SOLUSDT.P trade ideas

SOL long on 4h tf As We Can See Market Cipher B and volume pressure are giving us confirmation sol is retesting his new supports plus vwap on cipher is a big confirmation on 4htf and sol by itself hs to cover its fair value gap upwards which gives us another confirmation,119price ema 50 will be the full tp,Again Vwap and rsi looking good currently at 37 RSI,Enries are mention feel free to llike comment if you make some profits out of it,THANKS

Solana (SOL) - Technical AnalysisIt appears we've respected the support level on a weekly timeframe and are holding the trendline established since 2021.
The next target should be the previous support, which has now turned into resistance, with a potential move towards $200+.
In the short term, tariffs can introduce uncertainty and market volatility. How they’re announced and implemented can lead investors to pull back from riskier assets like stocks and crypto, which could result in price declines - Which we ofc can see in this bloodbath xD
/DYOR

Solana’s Critical Support at $120 - Will It Hold or Break?Solana has been respecting its $120 support level for over a year, consistently bouncing back every time it tested this zone. However, the price is now once again hovering around this crucial level after a small bounce a couple of weeks ago. The key question remains: will Solana hold this support and rally again, or is a major breakdown coming?
Weakening Support: A Bearish Signal?
When a price level is tested repeatedly, it often weakens as buyers at that level get exhausted. The most recent bounce from $120 was notably weak, indicating that buying pressure might be fading. This could be an early warning sign that sellers are gaining control, increasing the probability of a breakdown.
The $75 Scenario: What If Support Fails?
If Solana fails to hold $120, the next major support level sits around $75—a price zone where significant demand previously emerged. A breakdown could trigger a sharp move lower as stop-losses get triggered and bearish momentum accelerates.
Key Factors to Watch:
• Volume & Strength of the Current Test – Is buying volume picking up, or are sellers in control?
• Market Sentiment & Macro Trends – Broader crypto market trends, Bitcoin’s movement, and macroeconomic factors could influence Solana’s direction.
• False Breakouts & Traps – Sometimes, a brief break below support is a shakeout before a strong reversal. A reclaim of $120 after a breakdown could signal a bullish trap for shorts.
Final Thoughts
While $120 has been a strong floor for Solana, repeated tests make it more fragile. If buyers fail to step in with conviction, a drop toward $75 becomes a real possibility. However, if bulls defend this level strongly, we could see another bounce, potentially setting up a reversal.
Thanks for your support.
- Make sure to follow me so you don't miss out on the next analysis!
- Drop a like and leave a comment!

$SOL Breakdown Alert🚨 CRYPTOCAP:SOL Breakdown Alert! 🚨
Solana has broken down from a rising wedge pattern and is now targeting the Fair Value Gap (FVG) zone between $30–$50.
A potential -73% drop from recent highs could be on the table.
If support fails here, things could get brutal.
Stay cautious.

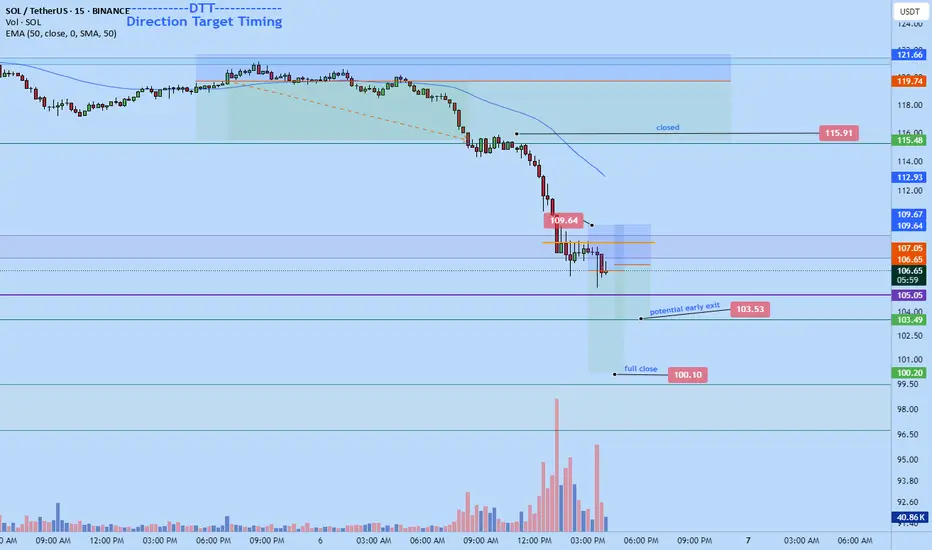
Solana scalp short to $100I took a trade last night on sol . Exited early above.
Just went back in for a scalp short down to $100 area
Potential early close at $103.53
Elliott Wave Analysis on $SOLUSDT – ElliotWave count🟢 Current Wave Structure
The chart shows a complex corrective structure that fits well within the Elliott Wave principle:
We are currently in a larger ABC correction, with the green-labeled wave (C) likely approaching completion.
The most recent move down in green (C) may have marked the end of a broader corrective cycle.
The current movement looks like a short-term ABC correction in red – typical for a corrective bounce after a strong sell-off.
🟥 Short-Term Movement (Red Wave A-B-C)
Within the lower timeframe, we can see a corrective recovery forming a red A-B-C structure:
Wave A (red) has already completed,
Wave B (red) is currently forming (sideways or slightly lower),
Wave C (red) could result in a final push upwards towards the green descending trendline – targeting around 138–142 USDT – unfolding as an internal orange A-B-C.
🟩 Key Trendline (Green)
The green descending trendline has been respected multiple times and acts as strong technical resistance.
⚠️ Scenario: A rejection from this level is highly likely and would mark the end of the current relief rally – completing the larger green wave (B).
🟧 Short Entry Zone
The orange Fibonacci zone around 142 USDT marks an ideal short setup area.
This level is confluence of Fibonacci extensions and previous resistance.
⚪ What’s Next?
After the orange wave C finishes (completing green wave (B)), I expect an impulsive move to the downside – likely unfolding as a classic 1-2-3-4-5 wave within the green wave (C).
Target zones:
First zone: ~108 USDT (highlighted by green/yellow/red Fibonacci extension),
Final bear target: Possible deep wick below due to the high volatility and liquidity in that zone.
✅ Key Support Zone (Green / Yellow / Red)
Around 108 USDT, we find a strong confluence support – labeled as End of Bears.
This zone may act as a potential reversal point, possibly kicking off a new bullish cycle with long-term targets reaching 200+ USDT.

solusdt.p 1h buyGreetings to my dear friends
Scalpers pay attention.
Signal based on the three-line collision.
Friends who saw my previous posts
I don't put any stops, I trade with capital management.
The price can drop below 112
If it does not consolidate, stay in the trade
If it does consolidate, exit with a pullback to the range
Good luck.

Solana scalp short to $115.84 or lowerJust hopped into this solana short.
Targeting $115.84 order lower>
High probability in alignment with DTT

SOLUSDT NEXT MOVESell after bearish candle stick pattern, buy after bullish candle stick pattern....
Best bullish pattern , engulfing candle or green hammer
Best bearish pattern , engulfing candle or red shooting star
NOTE: IF YOU CAN'T SEE ANY OF TOP PATTERN IN THE ZONE DO NOT ENTER
Stop lost before pattern
R/R %1/%3
Trade in 5 Min Timeframe, use signals for scalping

solusdt.p Hello friends
Today I want to give you a scalping signal.
This trade is based on the logarithmic lines (three and two peaks collision strategy)
This red area is very important < The best point to enter is outside the range.
Enter with capital management and without a stop
Because this point is important and if the position acts the opposite. You can exit the trade without loss by pulling back to this area.

SOL ANALYSIS🔮 #SOL Analysis 🚀🚀
💲💲 #SOL is trading in a Ascending Broadening Wedge Pattern and there is a breakdown of the pattern. And we can expect more bearish move towards it's support zone and the a reversal
💸Current Price -- $119.10
⁉️ What to do?
- We have marked crucial levels in the chart . We can trade according to the chart and make some profits. 🚀💸
#SOL #Cryptocurrency #DYOR


SOLUSDT NEXT MOVESell after bearish candle stick pattern, buy after bullish candle stick pattern....
Best bullish pattern , engulfing candle or green hammer
Best bearish pattern , engulfing candle or red shooting star
NOTE: IF YOU CAN'T SEE ANY OF TOP PATTERN IN THE ZONE DO NOT ENTER
Stop lost before pattern
R/R %1/%3
Trade in 5 Min Timeframe, use signals for scalping

analyz chart solusdt. bySolana is close to a very important range.
The market will enter an upward phase when the price reaches the $119 to $100 range.
It is recommended to hold.
SOLUSDT

SOLUSDT - Wave 5 Completion into resistance zoneThis 1-hour chart of SOLUSDT (Solana Perpetual Contract) showcases a potential 5-wave Elliott impulse structure forming within a larger resistance zone.
- After breaking down from the highlighted resistance range (roughly $122–$129), SOL is currently retracing upward in what appears to be an impulsive 5-wave correction.
- Waves (1) through (4) seem to be in place, with Wave (5) projected to complete just below or near the resistance zone again.
- A potential bearish reversal is anticipated upon the completion of Wave (5), likely targeting support around the $120–$121 level.
Traders should monitor the price reaction near the $126–$128 region for rejection signals. A failure to break and hold above resistance could validate the short scenario, while a clean breakout could invalidate the bearish outlook and signal continuation.
Tight stop-loss management and confirmation through volume or momentum indicators are recommended before entering a trade.

SOLUSDT Long Trade Setup (Waiting Since Yesterday)SOL has retraced back to the 38% Fibonacci level on the 5-minute timeframe, showing strong potential for a bounce. On the 15-minute timeframe, we anticipate a move towards at least the 50% Fibonacci retracement level.
This setup is supported by additional technical tools I’ve aligned, providing further confirmation.
⚠️ Entry is advised only if you find confluence with your own analysis.
✅ Personally, I’m comfortable entering this long setup, targeting a Risk-to-Reward ratio of at least 6.84.
Happy Trading! 🚀

SOLUSDT | Elliott Wave Projection – Next big Move Incoming 50%+BINANCE:SOLUSDT
The chart is probably currently developing a five-wave impulsive structure (1)-(2)-(3)-(4)-(5), suggesting a potential bullish movement towards the 174-175 USD resistance zone before a larger correction unfolds.
📈 Bullish Setup:
- A corrective A-B-C structure seems complete, with a potential impulsive wave (1)-(5) forming.
- Price is reacting at a strong demand zone, initiating Wave (1) upwards.
- Possible target for Wave (5) lies near **174-175 USD**.
📉 Bearish Continuation Afterwards
- After reaching the projected high, expect a sharp rejection and reversal.
- The final bearish target lies within the "End of Bear" zone (~108-109 USD).
---
### 🔹 Key Levels to Watch:
✅ First Bullish Target: ~174-175 USD
⚠️ Critical Support Zone: 108-109 USD
---
### 📌 **Trading Plan:**
1️⃣ Long Opportunity: If price respects the current support, target Wave (3)-(5) completion near 174 USD.
2️⃣ Short Confirmation: If price rejects at resistance, a larger bearish wave is expected.
3️⃣ Final Bear Target: 108-109 USD zone for possible long-term support.
🚨 Risk Management:
- Stop-loss below 111 USD for longs.
- Wait for confirmation before shorting after rejection.
💬 What do you think? Will SOL hit 175 USD before the final drop? Comment below!

Short Position SOL/USDT#Singal
SOL/USDT
🔴 Short Position
🎲 Entry1 @ 123.75
🎲 Entry2 @ 125.12
✅ Target1@ 121.79
✅ Target2 @ 119.93
✅ Target3 @ 116.55
✅ Target4 @ 112.38
✅ Target5 @ 103.78
❌ Stop Loss @ 132.32
Leverage: 5X
Margin: 10% of Wallet Balance
⚠️"Take Care of Risk Management for Your Account"

SOLANA BOUNCES OFF SUPPORTPicture perfect bounce off of the $112 support for Solana. We’re now watching for a potential double bottom — but let’s not get ahead of ourselves. That pattern doesn’t confirm until we break above $147, the swing high between the two lows.
Until then, it’s just a bounce at support… and a strong one. Price is still well below the 50-day moving average and the descending trendline, so bulls have work to do. But they’ve drawn the line at $112. Defined support and resistance make this one worth keeping on the radar.

Solana I Daily CLS I KL - Order block, Model 1, Target 50%Hey Traders!!
Feel free to share your thoughts, charts, and questions in the comments below—I'm about fostering constructive, positive discussions!
🧩 What is CLS?
CLS represents the "smart money" across all markets. It brings together the capital from the largest investment and central banks, boasting a daily volume of over 6.5 trillion.
✅By understanding how CLS operates—its specific modes and timings—you gain a powerful edge with more precise entries and well-defined targets.
🛡️Follow me and take a closer look at Models 1 and 2.
These models are key to unlocking the market's potential and can guide you toward smarter trading decisions.
📍Remember, no strategy offers a 100%-win rate—trading is a journey of constant learning and improvement. While our approaches often yield strong profits, occasional setbacks are part of the process. Embrace every experience as an opportunity to refine your skills and grow.
Wishing you continued success on your trading journey. May this educational post inspire you to become an even better trader!
“Adapt what is useful, reject what is useless, and add what is specifically your own.”
David Perk ⚔

SOLUSDT – Smart Money’s Next Big Move! | Brealdown or Reversal?📉 SOLUSDT is at a key decision point, currently testing a major support level at $112-$115. Based on Smart Money Concepts (SMC), Market Maker Cycle (MMC), and Manipulative Thinking, let's break down what could happen next.
📌 Market Structure & Pattern Analysis
🔹 Pattern Identified: Right-Angled Ascending Broadening Wedge
Flat Lower Trendline (Support at $112).
Ascending Upper Trendline (Expanding Highs, last peak at $295).
This pattern signifies increasing volatility and market indecision, leading to a strong breakout or breakdown.
🔹 Current Market Structure:
The overall trend is bearish with a series of lower highs and lower lows since the $295 high.
Price is now at a critical support level ($112-$115), which has held multiple times.
🔹 What Happens Next?
If the price holds this level and reverses → Bullish breakout.
If price breaks down → Bearish continuation toward lower liquidity levels.
🔎 Smart Money Concepts (SMC) Perspective
1️⃣ Liquidity Zones & Order Blocks
Bullish Order Block (Demand Zone): $112 (Currently Testing)
Bearish Order Block (Supply Zone): $134 - $136 (Next Resistance)
Liquidity Pool Below Support: $100-$105 (If support fails)
2️⃣ Liquidity Manipulation by Smart Money
Retail traders see $112 as strong support. Market Makers may push price slightly below this level to trigger stop-losses before reversal.
Fakeouts likely: If price sweeps below $112 and recovers above $115, this confirms a liquidity grab for a potential bullish reversal.
Conversely, if price breaks $112 with strong bearish volume, expect a drop toward $100-$105.
📊 Market Maker Cycle (MMC) Perspective
📌 Market Makers Control the Trend – Here’s What to Expect:
🔹 Current Phase: Accumulation or Redistribution?
Price is consolidating near $112-$115, a critical level.
If this is Accumulation, market makers will push price below $112 to trigger retail sell-offs, then reclaim the level for a bullish move.
If this is Redistribution, price will break below $112 and continue downward toward $100-$105.
🔹 Signs of Market Maker Activity
✅ Bullish Clues: Fakeout below $112 followed by a quick reclaim above $115 with strong volume.
❌ Bearish Clues: A clean break below $112, retest as resistance, and rejection.
🔥 Trading Plan & Targets
🔹 Bullish Scenario (Breakout from Support)
Entry: Long position on strong bounce from $112-$115 with confirmation candle. (High Probibality)
First Target: $125
Second Target: $134-$136 (Key resistance & supply zone)
Final Target: $175-$180 (If breakout continues)
🔻 Bearish Scenario (Breakdown Below $112)
Entry: Short position if price breaks below $112 and retests it as resistance.
First Target: $109-110
Second Target: $96-98 (Major demand zone)
Final Target: $85 (Next liquidity pool)
📢 Final Thoughts
⚠️ A Big Move is Coming – Be Ready!
🔹 Smart Money is watching this $112-$115 level closely.
🔹 A liquidity sweep below $112 followed by a bullish reclaim = Long Setup.
🔹 A clean break and rejection from $112 means Market Makers are pushing lower.
🚨 Risk Management: Always use stop-loss and proper risk-to-reward ratios.
This is not financial advice—trade responsibly and manage your risk effectively.
📊 Follow for more setups!
📊 Are you trading with the Smart Money or getting trapped by it? 🚀 Let me know your thoughts in the comments! 🔥

Elliott Wave | Bearish End Confirmed? | Last Chance Before the DBINANCE:SOLUSDT
The current structure suggests we are approaching a key decision point. Price has completed an a-b-b correction and is now reacting within the 61.8%-88.7% Fibonacci retracement zone, which could trigger a relief bounce before further decline.
📉 **Bearish Outlook:**
- The recent structure confirms a completed a-b-c move, leading to a potential Wave (B) retracement.
- The final bearish target lies in the "End of Bear" zone (~109 USD), where a final capitulation may occur.
- If we break far below **109 USD**, expect an accelerated sell-off.
📈 **Bullish Scenario?**
- The 78.6%-88.7% Fibonacci retracement zone could push SOL towards a short-term bounce before resuming the bearish trend.
- A valid long trade is possible if this support holds.
⚠️ Key Levels to Watch:
✅ Bullish Rejection Zone: 78.6% - 88.7% Fibo
❌ Break Below 105 USD = Full Bearish Confirmation
---
### 📌 **Trading Plan:**
1️⃣ Potential Short-Term Long if 78.6% - 88.7% Fibo holds.
2️⃣ Target: Resistance before wave (C) completes.
3️⃣ Short Confirmation** after rejection OR break below 105 USD.
‼️ Risk Management:
- If price fails to hold, a deeper correction is expected.
- Trade with proper stop-loss & confirmations!
💬 What do you think? Will we see a short-term bounce before the bear takes over?
