$SOL to $80Solana ( CRYPTOCAP:SOL ) is currently at a critical level from a technical perspective.
The $120 level has historically served as strong support, having been tested and respected on multiple occasions in the past. However, I’m skeptical about its ability to hold this time around, given the current market dynamics and momentum.
Should $120 fail to hold, the next significant support level I’m monitoring is around $80. This level is particularly noteworthy as it aligns with two key technical indicators: the volume weighted average price (VWAP) , which reflects the average price adjusted for volume and often acts as a magnet for price action, and the 1.618 Fibonacci retracement level , a widely watched extension in technical analysis that frequently marks reversal zones in trending markets.
The confluence of these factors at $80 suggests it could serve as a strong potential support zone if price continues to decline.
SOLUSDT.P trade ideas

Price action based analysis of Solana The same break point of the previous move, which has become a resistance. However, a decision point!
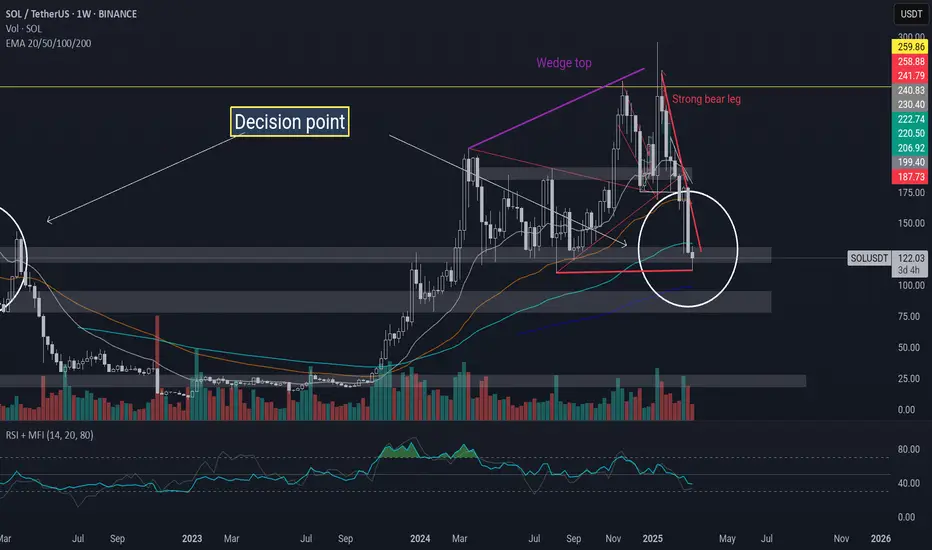
SOL to 55$ soonI am only long if weekly candle closes above the red resistance line
other wise price has to fall to 55$

Solana (SOL) Price Analysis: Key Support & Resistance LevelsCurrent Market Structure
SOL is holding a major support level around $110, which could act as a launchpad for a short-term rally.
This support has historically served as a strong demand zone, attracting buyers looking for a potential rebound.
Upside Potential: Resistance Zones to Watch
If SOL maintains $110 support, it could rally toward:
$140 (first key resistance level)
$150 (historical rejection zone)
These levels have previously triggered selling pressure, so traders should watch for possible rejections.
Downside Risk: Key Support Levels
If SOL fails to hold $110, further downside could lead to a test of:
$80, a stronger support level from previous price action.
Conclusion & Strategy
Bullish Scenario: Holding $110 could trigger a move toward $140–$150, but a breakout above these levels is necessary for sustained upside.
Bearish Scenario: A break below $110 could accelerate losses, leading to a retest of $80 support.
Key Watchpoint: Reaction at $140 resistance—a rejection here could indicate another leg down, while a strong breakout could confirm further bullish momentum.

BullishHi Guys,
Market looks bullish today. I believe it will go down to "High VOL Asia Session" and move back up to break yesterday's swing high.

Solana SOL Weakness Continues: Is the Next Leg Lower Coming? 📉 Solana ⚡ is showing signs of weakness, maintaining a clear bearish trend on this 4H timeframe. Price action has traded into a key support zone, with a potential pullback offering an opportunity to enter short at a premium before the next leg lower 🔻.
If sellers remain in control, we could see a continuation to lower levels 📉.
⚠️ Not financial advice—always manage risk appropriately!

Solana 4-hour time frame bearishSolana is moving towards liquidity floor using block orders on the 4-hour timeframe.

Sol compression to expansion On the hourly timeframe, a push into the EMA 200 then rejecting back to the hourly trend while both reestablishing the trend and the horizontal level could set up for a nice move going into the weekend. Might be a good idea to book profits before Monday NYO if it works out to play it safe.

SOLUSDT - Move Down to Stronger Trend LineTrend Line in green is a good position for price to reverse in the bulls favor
This aligns well with the 0.786 fib line
As you can see it has broken down out of a small channel shown in the green dotted section
Weekly timeframe

SOL/USD Short Trade ideaThe price hasnt made any new LL's and is showing possibility on a double top...the price is at a ridiculous price point and is a high possibility for a buy momentum to happen. Watch for fake breakouts, look for right confirmations and use logical thinking in crypto about the price movements. Yes we had a high reached, we had price rising slowly from a very low point back to the ressistance GWS and on smaller TF's we can see no new LLs made...lets see how it plays out and where we can find a trade.


SOLUSDT Descending Channel – Key Levels & Breakout Watch🛠 Technical Overview
🔸 Asset: Solana (SOL) / USDT Perpetual Futures
🔸 Exchange: MEXC
🔸 Timeframe: 4-Hour Chart
🔸 Pattern: Descending Channel
📊 Analysis & Market Observations
Solana (SOL) is currently trading within a clear descending channel, facing strong resistance near $135 - $140 (Mini ChoCH) and $150 - $160 (Major ChoCH).
🚀 Bullish Outlook
If SOL breaks above $135 (Mini ChoCH), we might see a short-term reversal.
A breakout above the $150 - $160 Major ChoCH level would indicate a confirmed trend shift.
Potential bullish targets: $180 - $200 after breakout confirmation.
📉 Bearish Outlook
SOL remains in a downtrend as long as it stays within the channel.
If price fails to hold the $125 - $130 support zone, it could test $100 - $110 (lower channel support).
A breakdown from the channel could push SOL into a deeper retracement toward $80 - $90.
🎯 Trading Strategy
📌 Breakout Confirmation: Look for 4H candle close above $140 - $150 for a trend reversal.
📌 Retest Entry: If price breaks and retests key levels, it could present a strong long opportunity.
📌 Channel Support Longs: If SOL drops to $100 - $110, watch for bullish signals to enter long positions.
📊 Key Levels to Watch
🔹 Resistance: $135 (Mini ChoCH), $150 - $160 (Major ChoCH)
🔹 Support: $125 - $130 (demand zone), $100 - $110 (lower channel)
🚀 Potential Breakout Incoming! Stay prepared for the next move. 🚀

Potential expend a flat on SolanaIn elliot wave perspective I believe the drop from the top till the current bottom we have completed a five-way move. It also can be a w x y move as well hence this is a great place to put a spot on long position. Market may make one more drop to the downside around $100 but regardless the movement, I still believe there will be a bounce coming soon in the future that will bring Solana back into $200 region. Meanwhile I spotted the potential of expanded flat because there is a bull Divergence on The Daily RSI. So I truly believe that there is high chance that Solana is bound to go up again on this immediate short-term. Even though there is a bounce, most likely it will further drop down to 74 dollars region again in the future. Unless, the bull decided they want to be in control, then I suppose another hit to the all-time high will totally make sense too. So I'm going to be Perma bull for the meantime. Trade Safe People

SOL/USDT LONG SET UP (Solana)Entry 1 $120.00
Entry 2 $110.00
Stop loss $95.00
Take profit 1- $145.00
(Close 33%)
Take profit 2- $170.00
(Close 66%)
Take profit 3-$195.00
(Close 100%)

Fate of Solana As seen in this weekly candle size chart of #solusd i' ve explained all with balloons.
In 5 years period, #solana price has formed a huge bullish cup & handle pattern, but after relief rally has finished, #sol price heavily declined after completing the pattern. (X in the chart) Then, CRYPTOCAP:SOL failed the retest of the breakout zone that it accumulated more than 9 months. This was the 2nd bad declination.
And now, #solusdt is now testing weekly ichimoku cloud!.. This' one of the most important zone to be defended by the bulls. Losing this zone with weekly closings will be doom for the long term chart structure. So, must be defended at all costs to avoid bear season in mid term. Current situation is not safe for now.
For fully invalidation, #solusd must reclaim above 300 usd region with monthly close. Not financial advice. DYOR. (This' not a short term strategy)

SOL USDT Key GWS Zone Test: Rejection or Breakout?The chart shows the price approaching a strong resistance zone (GWS), where a rejection or breakout is possible. If the price gets rejected, a decline toward support levels may follow, while a breakout could lead to further upward movement. It is crucial to monitor the price reaction at this level to confirm the next trend direction.

Solana (SOL): Solana Seems Way Overbought....35X?Solana has a chance of falling as low as $120 which would be a zone of buy for us. So far this coins isway too overbought and we personally are not looking to buy any solana meme coins as well due to fact of it being too high in value.
So 2 ways to go where both should end up with same target zone 👀
More in-depth info is in the video—enjoy!
Swallow Team

Solana (SOL): Looking For Sellers DominanceWe are looking for a complete breakdown of local support and EMA, which might send the price back to lower zones here. Look for a confirmational breakdown and we should be good for further rides to lower zones!
More in-depth info is in the video—enjoy!
Swallow Team

SOL/USDTThe market always leaves clues for those who know how to read them. Analyzing SOL/USDT on the 1H chart, I see potential for growth after breaking out of a descending wedge. The price has tested a strong support level in the $120 zone, highlighted by the green rectangle. Early signs of a reversal can already be observed.

Will Solana drop 26% before finding support at $90?Hello and greetings to all the crypto enthusiasts, ✌
All previous targets were nailed ✅! Now, let’s dive into a full analysis of the upcoming price potential for Solana 🔍📈.
Solana remains in a downward channel, with a projected additional decline of at least 26% in the short term. A key support level at $90 is expected to be retested before any sustainable upward momentum can develop. The $100 mark serves as a significant psychological resistance, influencing market sentiment. Along the way, temporary bullish movements and short-lived green candles are natural fluctuations within the broader downtrend.📚🙌
🧨 Our team's main opinion is: 🧨
Solana is in a downtrend, likely dropping another 26% to retest $90, with $100 as key resistance, while brief upward moves are expected. 📚🎇
Give me some energy !!
✨We invest hours crafting valuable ideas, and your support means everything—feel free to ask questions in the comments! 😊💬
Cheers, Mad Whale. 🐋

$128 Support: The Line Between Relief and Disaster
BINANCE:SOLUSDT COINBASE:SOLUSD is currently testing the $128 support level, a crucial area that will determine its next move. If the price holds and buyers step in, we could see a rebound toward $195, where resistance is likely to be tested. However, a failure to maintain this level may lead to further downside, potentially reaching $82, the next major support zone.
For a clearer confirmation, traders should monitor lower timeframes for structural shifts, such as a break of recent swing highs or lows, which could provide additional validation for the next move.
👨🏻💻💭 Will SOL hold its ground and bounce back, or is another leg down incoming? The reaction at this key level will be critical!
__
The information and publications within the 3Commas TradingView account are not meant to be and do not constitute financial, investment, trading, or other types of advice or recommendations supplied or endorsed by 3Commas and any of the parties acting on behalf of 3Commas, including its employees, contractors, ambassadors, etc.

Solana's important supporthello friends
Due to the heavy demand of Solana and the construction of new floors based on the market cycle, we expect a new floor within the specified range.
If we reach the support range of 105-110 dollars, we can buy with confirmation, of course, with capital management...
*Trade safely with us*

Chartsssss"What impact do you think Bitcoin has on other coins? Why should Solana’s chart resemble Bitcoin's? Is our trend downward, heading for lower supports? God knows? My heart hurts, I see Bitcoin like this."
