SOLUSDT.P trade ideas

SOLANA: THE ULTIMATE TECHNICAL CONVERGENCE..📊 THE TRADING PLAYBOOK
🛡️ CONSERVATIVE SUPPORT PLAY
Setup: Buy at Fibonacci support levels🚨
Entry: $158-$165 (0.618-0.5 zone) 🌟
Stop: $140 (Below all major support) ❌
Target:
Tp1 : $200(25% gain) 💰
Tp2 : $232 (40% gain) 💰
⚡ Position Size: 3-5% of portfolio ⚡
Time Horizon: 3-6 weeks 🎯
______ NOTE _______
DYOR ⚠️ Not financial advice. This analysis is for educational purposes only. Always do your own research and never risk more than you can afford to lose.
#SOLANA #SOL #SymmetricalTriangle #Fibonacci #Breakout #Crypto #TechnicalAnalysis #AltSeason #DeFi #MemeCoins #TradingSetup
Keeping track of your favorite TA listsKeeping track of your favorite TA lists, with simple sub folders in your main watch list.

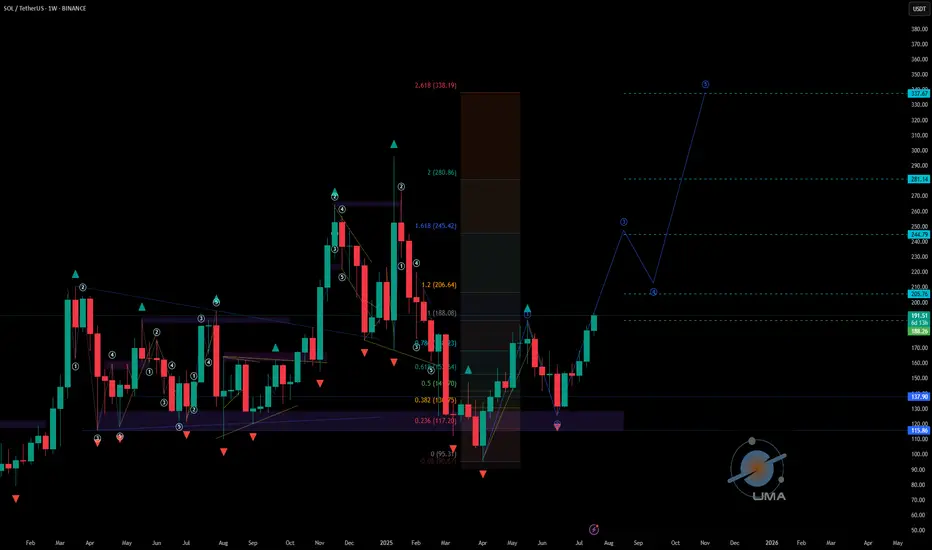
SOLUSDT - UniverseMetta - Analysis#SOLUSDT - UniverseMetta - Analysis
The price on W1 formed a double 3-wave structure. It is also worth considering the previous development for 2-3 months to reach all levels and update ATH. Against the background of the growth of all other assets, and the possibility of the beginning of the altseason, this pattern can be considered for a set of positions in the portfolio. The nearest targets will be at the level of 206 - 245. When the entire structure is realized, we can see a price of 338 per asset. Observe the risks.
Target: 206 - 338
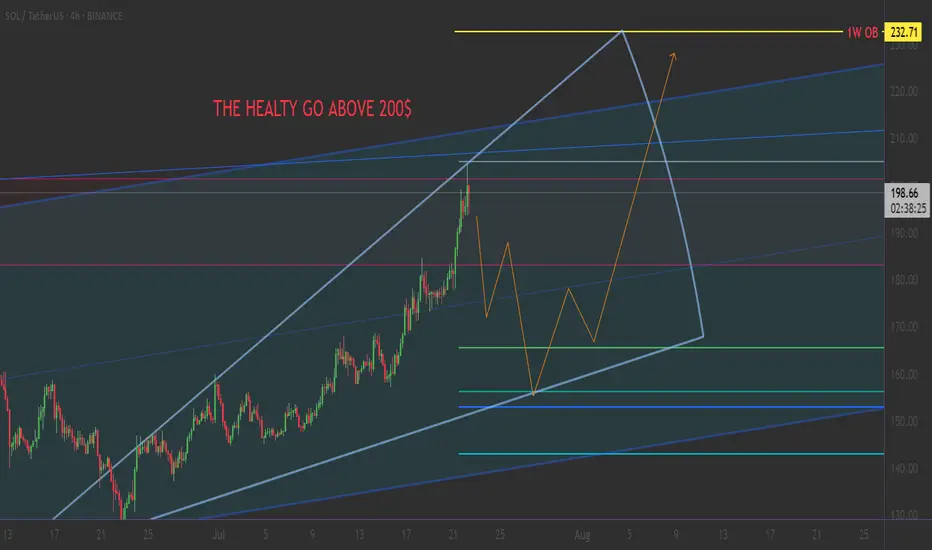
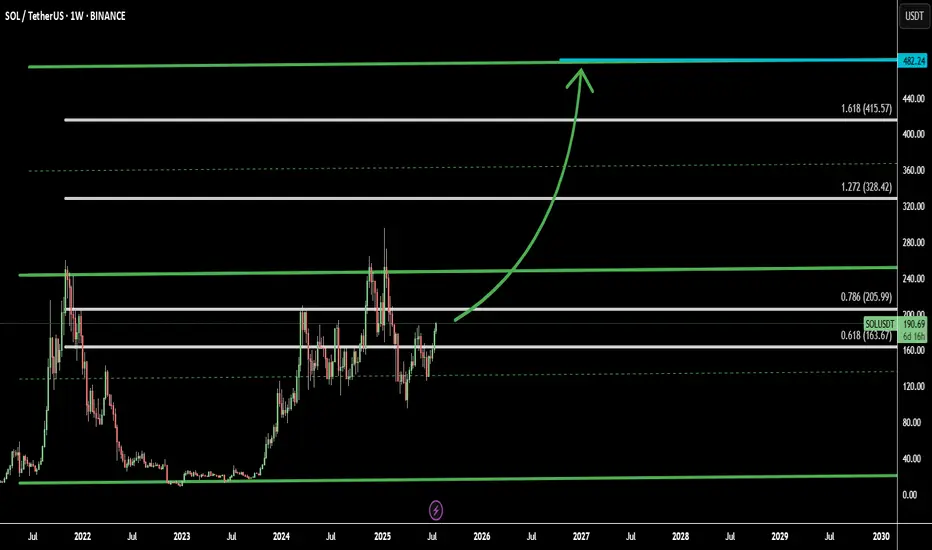
SOL Aiming to Double: Channel & Fibonacci Targets Signal $380Solana (SOLUSD) is currently trading around $190, and technical analysis suggests it may be on the path to doubling in price toward $380. This projection is supported by both a bullish ascending channel and Fibonacci extension levels, providing confluence for an extended rally.
Using this combined strategy, I’ve identified 4 key targets:
Target 1: 0.786 Fib – 205.99 - mid-range target within the upper half of the channel
Target 2: 1.272 Fib – 328.42 - aligns with historical breakout levels
Target 3: 1.618 Fib – 415.57 - Last Fibonacci Targets
Target 4: projected top of the current channel near 482.24
Beyond the technicals, Solana’s ecosystem continues to outperform many other Layer 1 chains, offering faster transaction speeds, lower fees, and robust DeFi and NFT activity. This fundamental strength supports the technical bullish thesis.
As always, breakout confirmation and volume are key. Manage risk accordingly.
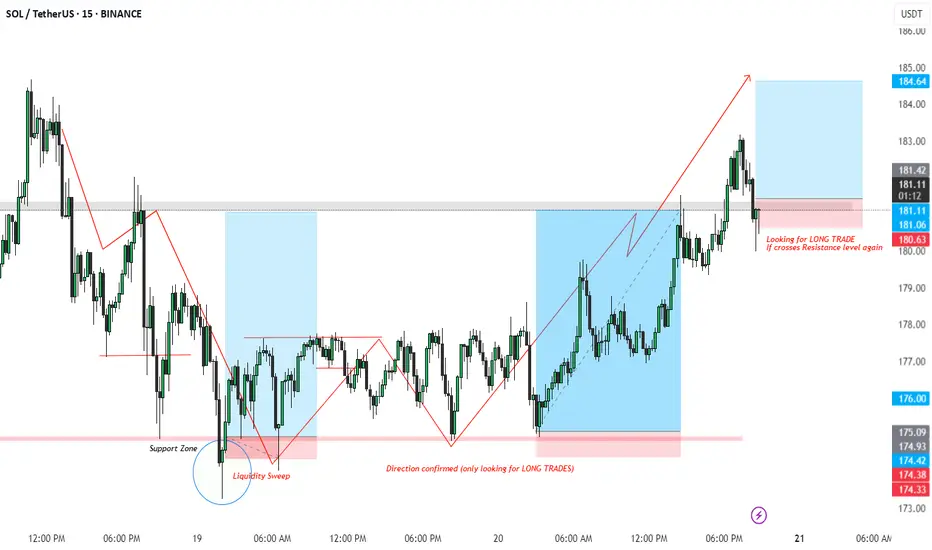
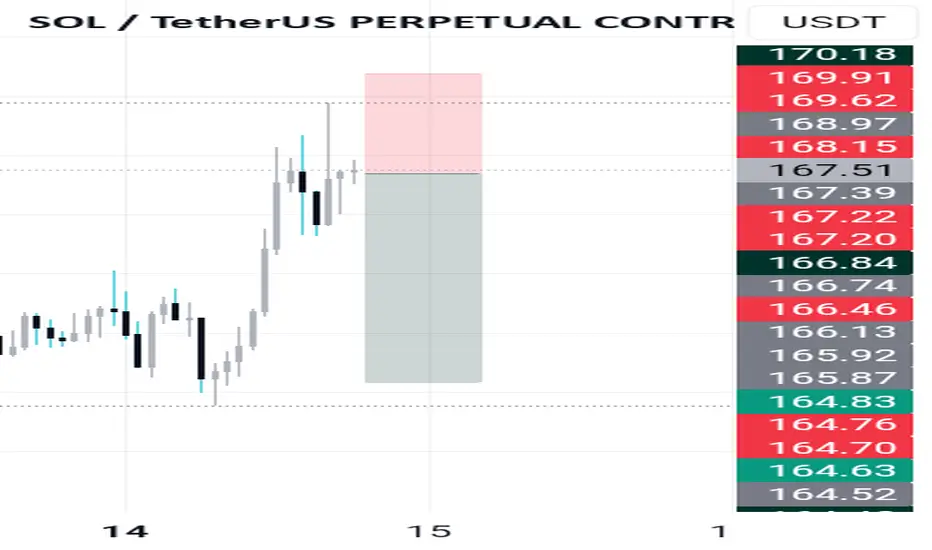
SOL/USDT LONG Setup – Liquidity Sweep + Break of Structure
Timeframe: 15m
Market Bias: Bullish (Long only)
Setup Type: Liquidity Sweep + BOS + Retest
📌 Breakdown:
Liquidity Sweep Identified:
Price dipped below the previous support zone, triggering stop hunts and grabbing liquidity.
Marked as a clear sweep of lows, signaling possible reversal.
Shift in Structure:
Following the sweep, price printed a Higher High and Higher Low, confirming change in structure.
At this point, we shift bias to Long Only trades.
Retest & Entry Zone:
After bullish momentum, price has pulled back to a key resistance-turned-support zone (highlighted in pink).
Looking for long entry on confirmation if price reclaims the resistance again (~181 zone).
📈 Trade Plan:
Entry: On reclaim and candle close above 181.00
SL: Below the recent structure low (~180.00 or dynamic based on confirmation)
TP: Previous high at 184.60 zone (approx 1:3 RR)
🧠 Trading Psychology:
Patience is key — wait for structure confirmation and avoid pre-emptive entries. The liquidity sweep setup gives us a solid probability edge when combined with market structure shift.
#SOLUSDT #CryptoTrading #SmartMoneyConcepts #LiquiditySweep #TradingSetup #BOS #MarketStructure #ReversalPattern #CryptoAnalysis #LongTradeOpportunity #PriceActionTrading #15MinSetup
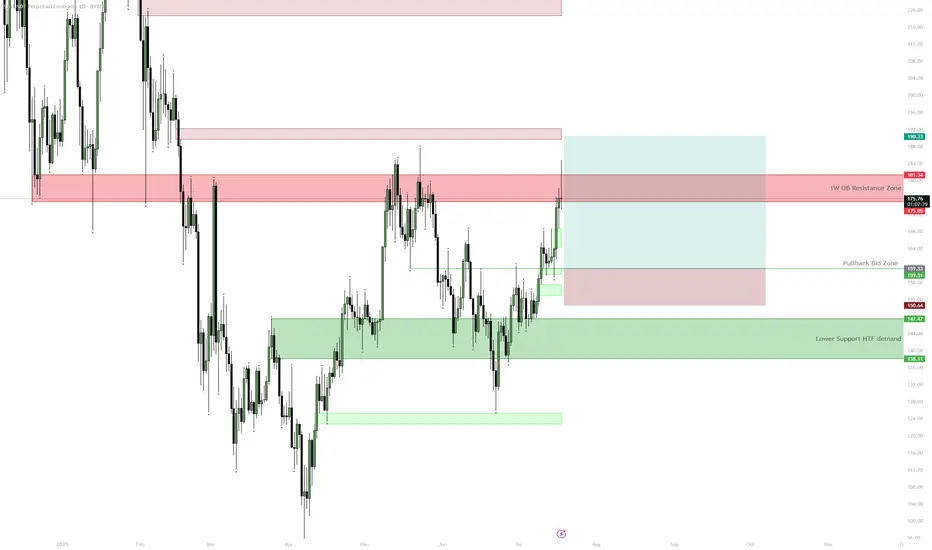
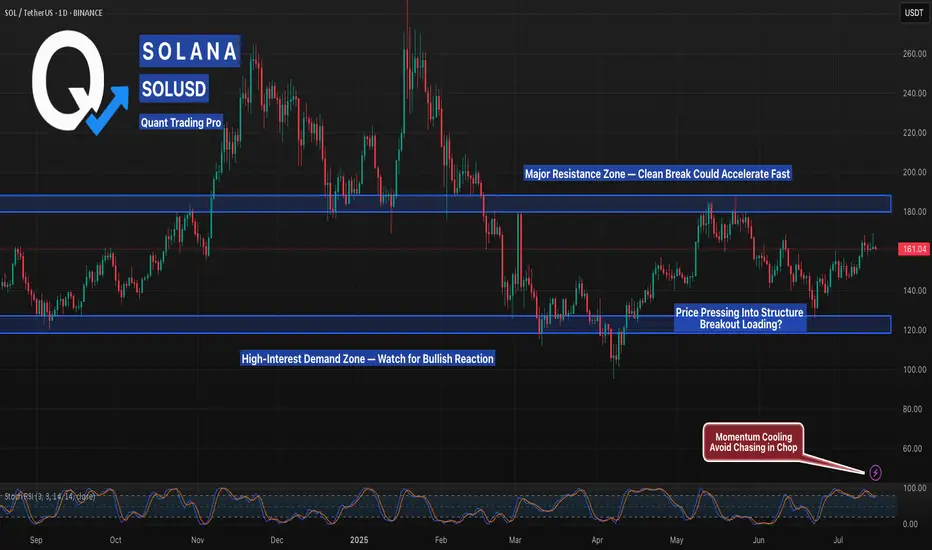
SOL — $180 HTF Resistance | Consolidation ExpectedSOL is approaching a key HTF resistance zone at $175–$181 with 1D RSI close to overbought. Unless price cleanly breaks above this area, a pullback to $160 or even the $138–$147 demand zone is likely before further upside. The setup provides a better risk/reward for longs on pullbacks after consolidation rather than chasing at resistance.
Solana Testing the June Breakdown Level — Decision TimeAfter weeks of slow grind, SOL is now pressing into a level that triggered a major selloff in June. A clean breakout here could flip momentum hard — but if buyers stall again, a short-term double top could catch late longs off guard. Watching $185 closely.

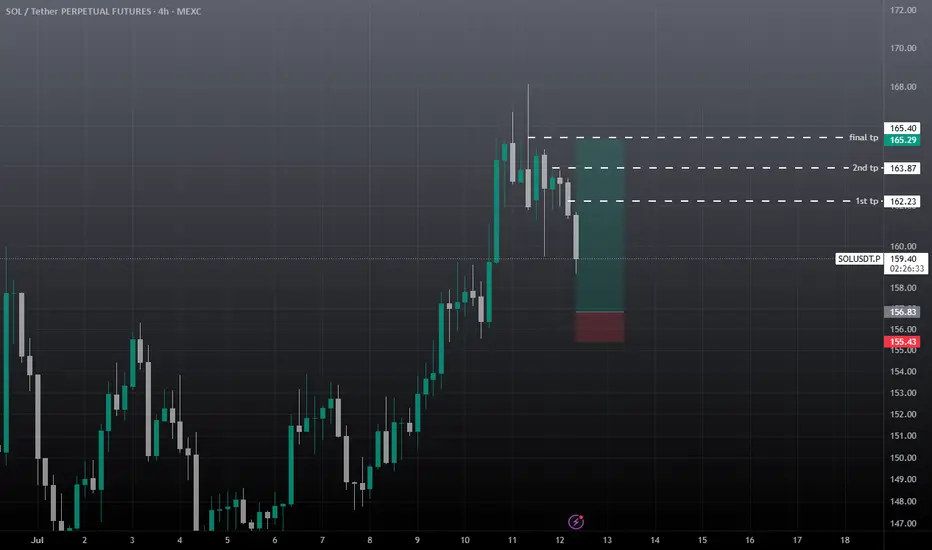
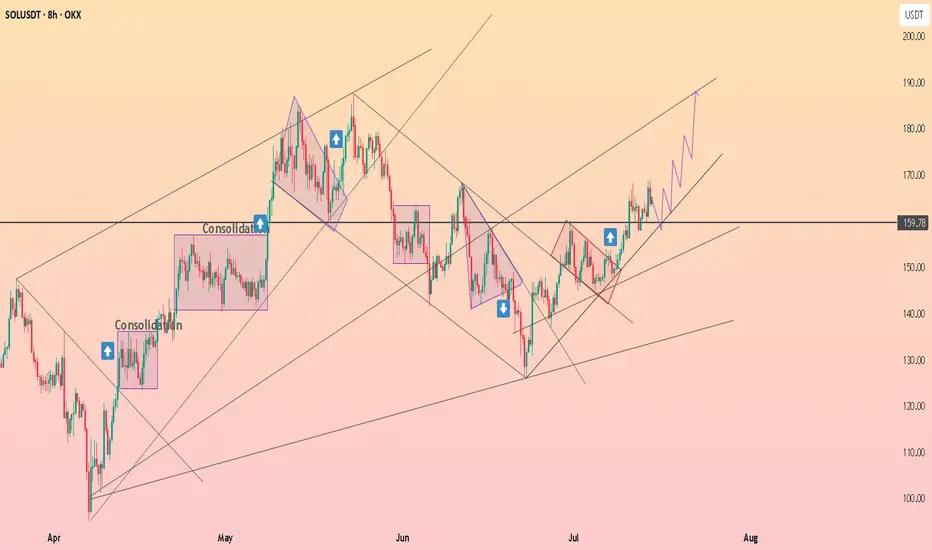
SOLUSDT – Healthy Pullback Before ContinuationSolana has shown strong bullish momentum recently, breaking out of a consolidation range and trending upward within a clear ascending channel.
However, in the short term, I expect a minor correction as price is likely to revisit the Fair Value Gap (FVG) zone marked around the $160–$165 area. This would be a healthy retracement within the trend and could provide a solid base for continuation toward higher targets.
If price respects the FVG and the lower trendline, SOL could resume its bullish move, potentially aiming for the $200 level and higher within the channel.
Key levels to watch:
FVG support zone: $160–$165
Resistance target: $200 – $220
Waiting for a pullback to enter on strength. Trend remains intact as long as the channel holds.

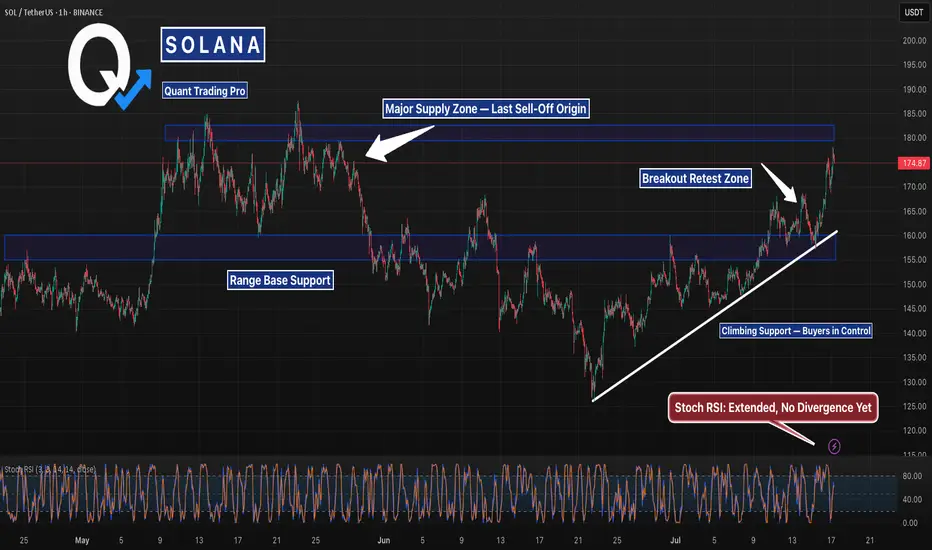
SOL Back at the Same Level It Dumped From — But with BackupSOL is right back where the last major dump started — but the structure this time is way cleaner. Higher lows, trendline support, and strong momentum behind the push.
If it clears this zone, we could see fireworks. But don’t fade resistance this thick without confirmation.
#Solana #SOLUSD #CryptoCharts #BreakoutWatch #ChartAnalysis #TrendlineSupport #CryptoTraders #QuantTradingPro #TradingView
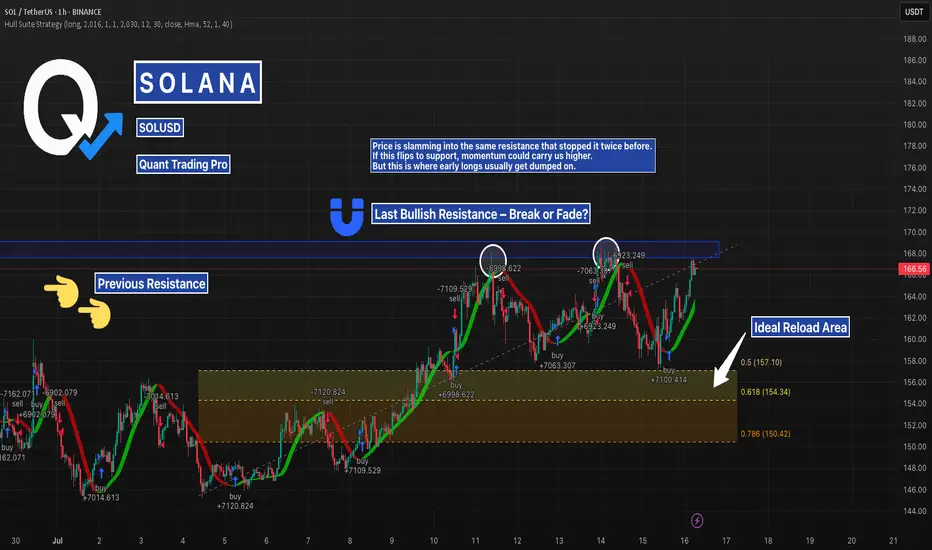
SOLUSD – Big Test at Local Resistance | Fib Reload if RejectedSolana just tapped into prior resistance from July 13–14, a level that previously rejected price.
With fib confluence between $157–$150 below, this is a textbook setup: breakout or rejection → smart money looks for the reload.
Watching closely for structure shift before taking position.
#SOLUSD #Solana #Crypto #Breakout #SupportResistance #QuantTradingPro #TradingView
Solusdt 4hr tf Bullish iH&S patter Forming a Bullish iH&S pattern, may activate the pattern if closes above 159.
Targets are 168, 180 and 198
Invalidation if closes below 144

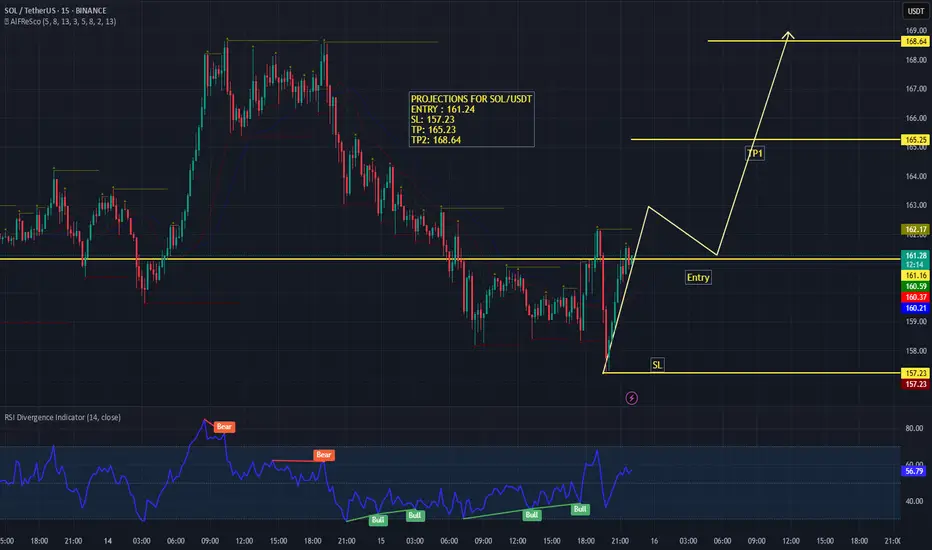
SOL/USDT – 15M Technical AnalysisSolana (SOL) is showing signs of a potential bullish reversal on the 15-minute timeframe after a sharp downtrend. Price has reclaimed key support levels and is preparing for a possible breakout.
📈 Projections & Trade Plan:
Entry: 161.24 (above immediate resistance)
Stop Loss (SL): 157.23 (below recent swing low)
Take Profit (TP):
TP1: 165.23 (near previous resistance cluster)
TP2: 168.64 (targeting the upper resistance zone)
Technical Insights:
The price has broken the descending structure and is showing bullish momentum with a clean impulse leg upwards.
A minor pullback to the entry zone would provide an optimal long opportunity before continuation towards TP levels.
Momentum Indicators:
RSI is trending upwards at 55.56, indicating strengthening buying pressure. Multiple bullish divergences can be observed, which align with the reversal thesis.
⚡ Bias: Bullish
If price holds above 161.24 and confirms breakout strength, we can expect a move toward 165.23 and potentially extend to 168.64. However, failure to hold above 161.00 may invalidate the setup.
Solana:Daily free signalhello friends👋
As you can see, after the drop that we had, insider buyers showed and were able to support the price well.
But it was not enough, and as you can see, a noisy pattern has formed, which can indicate a further decrease in the price.
Now we can take advantage of this opportunity and make step-by-step purchases with risk and capital management in the support areas that we have obtained for you and move to the specified goals.
🔥Follow us for more signals🔥
*Trade safely with us*

Solana short #solSolana needs a little correction from here for a healthy pump , I am in short postion now
HolderStat┆SOLUSD above the $160 levelBINANCE:SOLUSDT has cleared key resistance at $159.78 after a series of consolidation patterns. The breakout has followed through into an ascending channel aiming at $185. Price remains structurally bullish with higher lows and strong recovery setups.
Solana Coiling Beneath Resistance — A Breakout Could Get ViolentSolana is pressing against the upper bounds of its multi-month range, with price tightening just beneath key resistance near $180. This level has historically triggered strong sell-offs, but the rising structure from June suggests bullish pressure is building.
Momentum is elevated, but not overheated — a clean breakout above the range high could trigger a rapid move toward $200+. If rejected, eyes shift back to the $140–$120 demand zone. This is a high-stakes zone — breakout traders should be ready.
sol sell midterm"🌟 Welcome to Golden Candle! 🌟
We're a team of 📈 passionate traders 📉 who love sharing our 🔍 technical analysis insights 🔎 with the TradingView community. 🌎
Our goal is to provide 💡 valuable perspectives 💡 on market trends and patterns, but 🚫 please note that our analyses are not intended as buy or sell recommendations. 🚫
Instead, they reflect our own 💭 personal attitudes and thoughts. 💭
Follow along and 📚 learn 📚 from our analyses! 📊💡"

Keep It Simple StupidA nice TL break of Buy Side Liquidity, with clear MSS and ChoCh is a Bread & Butter Strat almost everytime.
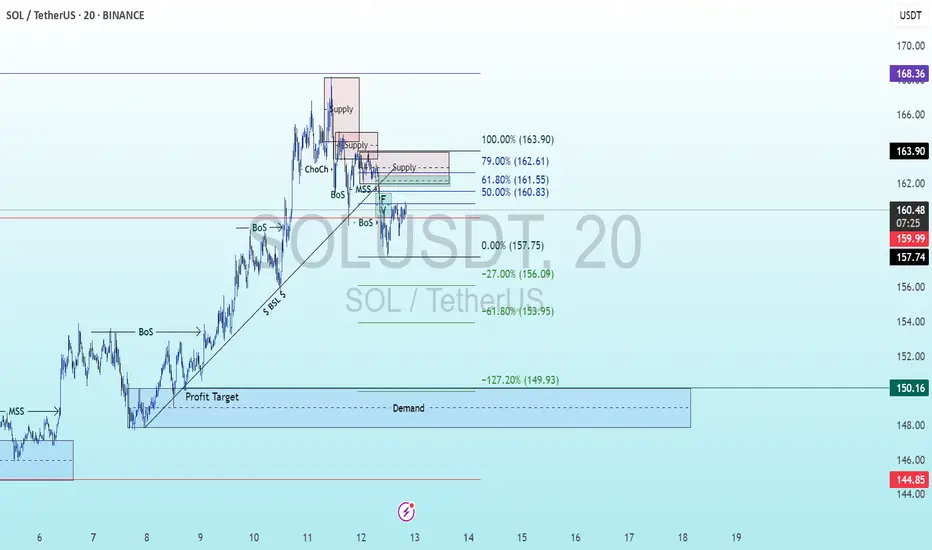
SOL/USDT Scalp Setup: Shorting the Break of StructureThis trading setup outlines a short-term, or scalp, short position on the SOL/USDT pair on the 30-minute timeframe. The logic is fundamentally based on a confirmed market structure shift from bullish to bearish.
Technical Analysis of the Setup Components:
Ascending Trendline Break: The first warning signal is the decisive break of the primary ascending trendline (green line). This indicates a weakening of buyer strength and a loss of bullish momentum.
Change of Character (CHoCH): Following the trendline break, the price failed to create a new higher high. Instead, it formed a lower low than the previous one, signaling a "Change of Character" in the market structure from bullish to bearish. This is a key signal to start looking for short opportunities.
Break of Structure (BoS) Confirmation: By breaking a significant prior support level, the price created a bearish "Break of Structure" (BoS). This move confirms the new downtrend and suggests that sellers are now in control of the market.
Strategic Entry Point: The entry is set at $161.12. This area represents a broken support zone that is now expected to act as resistance (a classic Support-Resistance Flip). Entering on a pullback to this broken structure is a high-probability strategy for joining the new trend.
Risk and Reward Management:
Stop Loss (SL): The stop loss is placed at $162.07, just above the most recent lower high. This is a logical placement, as a price move above this level would invalidate the current bearish scenario.
Take Profit (TP): The take profit is targeted at $156.90, near the next major support or demand zone, making it a reasonable objective for the bearish leg.
Risk/Reward (R/R) Ratio: The setup offers an excellent risk/reward ratio of 4.44 to 1. This means the potential profit is more than four times the potential loss, which is highly favorable from a risk management perspective.

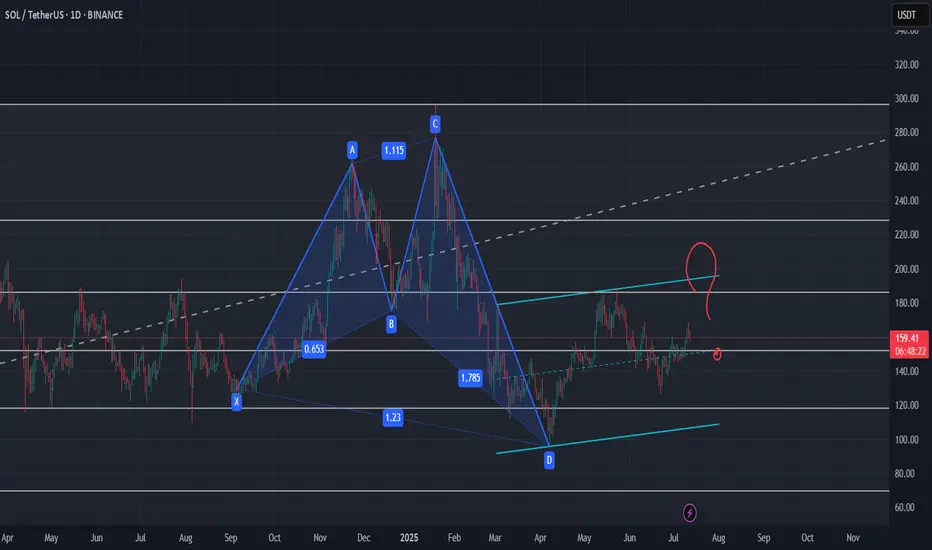
HARMONIC PATTERN on Daily for SOL ?I wonder if this pattern is the one which is highlighted by our friend and chart analyst @The_Alchemist_Trader_
Let's see if it need to test one last time the support of this channel or if it will break out for the long waited rally.
Level to keep an eye :
0.5 Fib support need to hold and clean breakout of the 0.382 Fib
Indicators : RSI, volume and volatility (liquidations)
Can SOL break out strong and rally 12% to $185?Hello✌
let’s dive into a full analysis of the upcoming price potential for Solana📈.
BINANCE:SOLUSDT is forming a clear inverse head and shoulders pattern near a strong daily support zone, signaling a potential trend reversal. This setup suggests at least a 12% upside, targeting $185, marking a promising start for SOL’s next bullish move. 📊🔥
✨ Need a little love!
We pour love into every post your support keeps us inspired! 💛 Don’t be shy, we’d love to hear from you on comments. Big thanks , Mad Whale 🐋

SOL USDT SCALP Long / Buy Setupwait for the entry and then take, as liquidation still lies upside, chances are high that sol will re-visit 164, before any major move to the downside. SL is important on any side. We took good profit on previous SOL short setup.