When Profit Comes, Leave Before It Vanishes Again. how??!!Have you ever stayed in a winning trade just to get more?
That voice whispering “keep it longer, this might be the big one”?
It’s the same voice that’s emptied thousands of portfolios...
Hello✌️
Spend 2 minutes ⏰ reading this educational material.
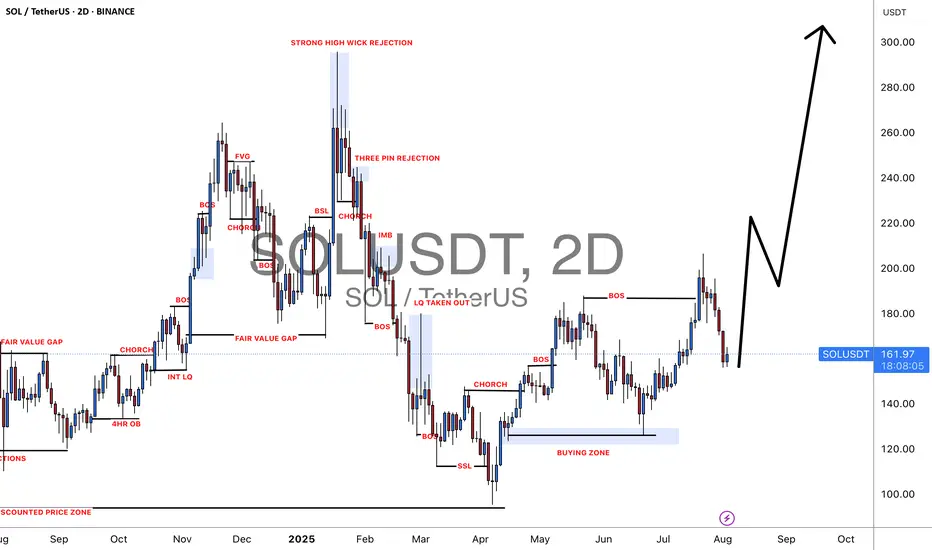
🎯 Analytical Insight on Solana:
BINANCE:SOLUSDT has seen healthy volume recently and is testing key daily support along with an important trendline. Holding these zones could fuel a 15%+ rally toward the $199 mark 📊🚀
Now, let's dive into the educational section,
🧠 The Psychology of Greed: Profit’s Evil Twin 😈
When you enter a trade and it starts moving in your favor, your subconscious kicks in. Suddenly, your brain whispers: “Just a little more... hold it!”
That’s when the greed game begins.
No matter how well you planned before the trade, once you're in profit, your brain creates a fantasy. A future where profits double, triple... a dream world. And this dream is exactly what makes traders give back everything including their original capital.
Our minds are wired to crave the rush of winning again. It’s like a hit of dopamine. So you hold the position even when the chart is flashing reversal signs. That’s the setup for disaster...
📉 Take-Profit Levels: Why Getting Out Is the Real Win 📌
Here’s the cold truth
If you don’t exit when you planned to, that profit was never really yours
A take-profit isn’t just a number. It’s a psychological boundary that separates a disciplined trader from an emotional one. Many beginners think setting a TP means giving up potential gains but in reality, it means respecting your plan and your capital.
You’ll always have another chance to trade. Always
But if greed wipes out your funds, there’s nothing left for the next opportunity
Each trade is just a chapter, not your whole story.
🧪 The Social Media Trap: When Your Brain Stops Thinking 📱
Online hype is poison. From “X coin just did 100x” to “I made $50K in a weekend” your brain gets hijacked.
You start chasing fantasies, not trades
That illusion of overnight success makes you ignore your own strategy. You stop following your plan and start trying to copy people who probably aren’t even real.
This is how social media slowly pushes traders into ruin
You feel left behind and that fear pushes you into greedy irrational decisions.
🔧 TradingView Tools That Help You Beat Greed 🛠
Luckily, TradingView offers several tools that can help keep your greed in check and your head clear
Alerts
Set an alert at your take-profit zone so you don’t keep staring at the chart. Let the system notify you when it’s time.
Long/Short Position Tool
Use this to visually define your entry, TP, and SL. Seeing it on the chart makes it easier to stick to your plan.
Bar Replay
This is gold for practice. Rewind price action and practice exits. See how often greed would’ve destroyed your trades.
Notes
Add reminders to your charts. Write things like “Exit at 2500 don’t overstay.” When future-you sees that message, it helps stay on track.
These tools don’t just improve your trades. They show discipline. And that’s exactly the kind of analysis editors look for when picking Editor’s Choice posts.
🚪 Final Words: In and Out, That’s the Game 🎯
Taking profit is a skill but exiting on time is an art
If you learn to respect your plan and silence greed, you’ll protect your capital and your sanity
There’s always a next trade if you survive this one
✨ Need a little love!
We pour love into every post your support keeps us inspired! 💛 Don’t be shy, we’d love to hear from you on comments. Big thanks , Mad Whale 🐋
📜Please make sure to do your own research before investing, and review the disclaimer provided at the end of each post.
SOLUSDT trade ideas

SOL's Golden Pocket: Is This the Bottom?SOL just tapped into the golden pocket zone and swept sell-side liquidity. Creating a high-probability long opportunity.
🟢 Long Setup:
Entry Zone: $156.67 – $151.50
Stop Loss: Below $150 (clear invalidation)
Target: $172
Risk:Reward: solid R:R setup
Why This Zone? Confluence Breakdown:
Golden Pocket retracement (0.618–0.666)
1.272 Trend-Based Fib Extension
Monthly Order Block
0.5 Fib Speed Fan support
Key Level at $154.81
Anchored VWAP support layer
Pitchfork 0.618/0.666 alignment
SSL (Sell-Side Liquidity) swept
nPOC at ~$152 offers a prime entry if we see another leg down
💡 Tip: Ladder in entries within the zone and size up near nPOC if price dips further. Manage risk carefully and watch how price reacts at the zone.
🧠 Educational Insight
Golden pockets (the 0.618–0.666 Fibonacci zone) are some of the most respected levels in trading often acting as key reversal zones, especially when stacked with other tools. In this case, we’ve got a rare confluence: anchored VWAP, nPOC, monthly OB, SSL sweep etc. all lining up with the golden pocket.
When multiple technical factors align, they don’t just increase probability, they give you a tighter invalidation and a better risk-to-reward setup. That’s how professional traders spot sniper entries.
_________________________________
💬 If you found this helpful, drop a like and comment!

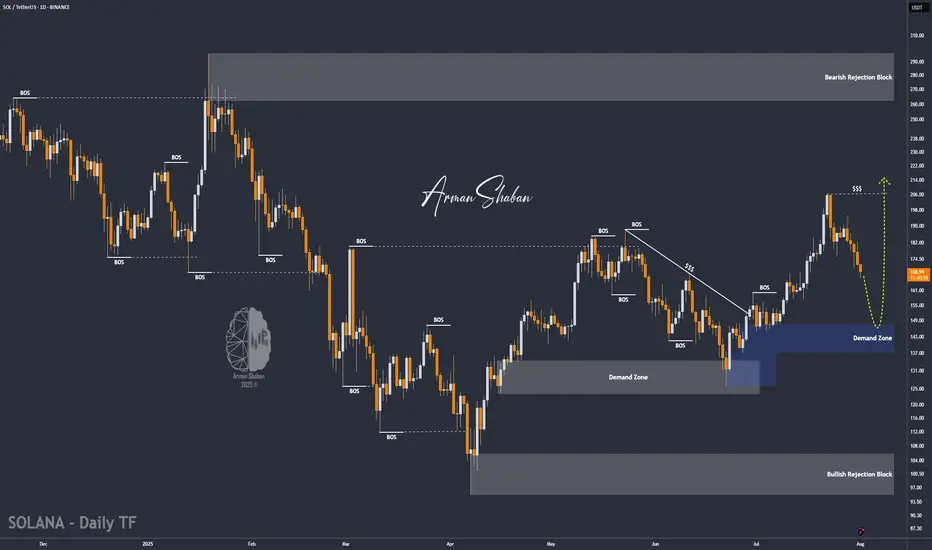
SOL/USDT | SOL Drops 25% – Approaching Key Buy Zone at $136–$148By analyzing the Solana chart on the daily timeframe, we can see that, like the rest of the market, it's undergoing a correction — dropping over 25% from the $206 area so far. Solana is now approaching a highly attractive buy zone between $136–$148, so be sure to closely monitor the price reaction in this range. Bullish targets will be announced soon — stay tuned!
Please support me with your likes and comments to motivate me to share more analysis with you and share your opinion about the possible trend of this chart with me !
Best Regards , Arman Shaban

SOL may test 170 before fallingThe SOL structure is quite weak. The price previously broke the upward trend and entered the range of 170-157 as part of a downward movement.
The market is reacting to Bitcoin's rebound, and in this case, SOL may test resistance at 169-170 before falling.
The upward trend has been broken by a H&S reversal pattern. The potential is temporarily changing, and before the long-term bullish trend continues, the market may test deep areas of interest from the support side.

Lingrid | SOLUSDT Corrective Move Completed ? Long OpportunityBINANCE:SOLUSDT is forming a bullish higher low just above the 158.47 support after a corrective pullback from the recent higher high. Price structure remains within the upward channel, and the rebound from key horizontal support signals a continuation setup. As long as the 158.47–160.00 zone holds, price is likely to target the 192.00 resistance near the channel's top. The ascending structure supports a bullish continuation toward the upper resistance band.
📉 Key Levels
Buy trigger: Break above 172.00
Buy zone: 158.47 – 160.00
Target: 192.00
Invalidation: Drop below 150.00
💡 Risks
Breakdown of the ascending structure below 150.00
Rejection near 172.00 without momentum confirmation
Broader market weakness could suppress breakout potential
If this idea resonates with you or you have your own opinion, traders, hit the comments. I’m excited to read your thoughts!

80% drop into the abyss for Solana? - July 2025** The months ahead **
Examination of the 3-week chart for SOLANA reveals several compelling technical signals that suggest a potential bearish trend reversal. This analysis highlights crucial patterns traders and investors of Solana should consider.
1. Formation of a 3-Week Death Cross:
A notable bearish signal prints on the chart: a ‘3-week death cross’. This follows a ‘2-week death cross’ that preceded a significant downward movement, just as in early 2022. The death cross, where a shorter-term moving average crosses below a longer-term one, is a strong indicator of a shift towards a bearish trend, especially on higher timeframes like this 3-week chart.
2. Broken Market Structure:
The chart clearly indicates a “broken market structure.” This typically occurs when the price fails to create higher highs and higher lows during an uptrend, or in this case, breaks below a significant support level that had previously held. It is absolutely possible price action backtests past support for a resistance confirmation, however on looking left, such a test never occurred on the last death cross.
3. Resistance from Previous Peaks (Head and Shoulders Pattern):
Price action leading up to the recent highs resembles a potential ‘Head and Shoulders’ pattern. The three distinct peaks, with the middle peak being the highest, suggest a classic reversal pattern. A subsequent break below the ‘neckline’ (implied support level below the peaks) would confirm the bearish outlook.
4. RSI Oscillator (bottom of chart) resistance
The lower panel of the chart displays an RSI oscillator indicator, which shows a clear pattern of "resistance." following a period of support since 2023. The RSI has clearly confirmed resistance from almost 3 years of support.
5. Solana vs Bitcoin
All the bearish observations made on the SOL-USD trading pair can be observed on the same 3 week time frame for the SOLANA - BITCOIN trading pair:
6. Potential for Significant Downside Target:
Based on the measured move from the previous death cross and breakdown and Fibonacci extension, the chart illustrates a potential downside target of approximately -70% from current levels toward the $30-40 area. While this is a projected target and not guaranteed, the historical precedent following similar bearish signals provides a context for the potential severity of the downturn if the bearish momentum continues.
Conclusion:
Considering the confluence of a 3-week death cross, broken market structure, resistance from previous peaks (suggesting a potential Head and Shoulders pattern), and the confirmation of RSI resistance, the outlook for SOLANA on the 3-week timeframe appears distinctly bearish.
Is it possible price action continues upwards after a 3200% rally? Sure.
Is it probable? No
Ww

SOL Both scenarios are valid! SOL is still bullishSOL Both scenarios are valid! SOL is still bullish
SOL is in a critical zone. The price is still inside a large bullish pattern and as long as it stays inside the pattern, the trend remains bullish and SOL should follow the bullish scenario.
The bullish targets are at 205, 214 and 224
It may happen that the FOMC will bring surprises, so if SOL manages to break below the pattern, it will activate the bearish scenario after that and the chances of falling will increase further as shown in the red scenario.
The bearish targets are at 160 and 139
You may find more details in the chart!
Thank you and Good Luck!
PS: Please support with a like or comment if you find this analysis useful for your trading day


#SOLUSDT: A Big Move In Making Crypto Market Is BullishCrypto market remain bullish and as for the SOLANA we remain quite optimistic; currently price is trading at critical level and waiting for liquidity to emerge. We need strong volume for big price movement. Follow a strict risk management while trading crypto market.
Good luck and trade safe.
Team Setupsfx
SOLANA's Situation, A Comprehensive Analysis !!!The price on the 3d timeframe is within an ascending triangle, which can be promising. If the price breaks this pattern with bullish candles, it could easily rise by the distance of AB=CD .
Best regards CobraVanguard.💚

SOL 1H – Demand Zone Bounce Brewing, Can Bulls Reach $205 Again?Solana is once again testing its high-volume demand zone near $155–$160 — a level that previously launched it toward local highs near $210. With price dipping back into this area and Stoch RSI bottoming out, the stage is set for a potential bounce play.
🔹 Structure & Key Zones
The blue box marks a clear price memory zone — tested multiple times throughout late July and early August.
Each bounce from this zone has led to significant rallies — suggesting strong underlying demand.
Two major resistance levels remain overhead: ~$195 (lower high supply) and ~$210 (range high).
🔹 Momentum Context
Stoch RSI is once again in the oversold zone, hinting at possible short-term reversal momentum.
A clean reaction from this demand area could lead to a strong leg higher — especially if the $170–$175 zone is reclaimed.
🔹 Trade Scenario
Potential setup: price tags demand → forms a local higher low → pushes through short-term resistance toward the upper range.
If this bounce plays out, bulls may target the $195–$205 zone — creating a potential 30%+ move.
Is SOL ready to bounce — or will this demand zone finally give way?
Comment below and share your setup 👇

SOLUSDT CHART ANALYSİSISTRADING CRYPTO PROFITABLE?
Crypto trading is profitable but only if done correctly. Follow the
steps, strategies, and tips shared throughout our guide, and you will be
in a better position to make profitable trades. And a golden rule:
Plan your trade, trade your plan.
Never Forget: 90/90/90 trading rule.
90% of traders will lose 90% of their account value within 90
days.
1. No matter how much profit you make; what matters is how
much you keep.
2. No matter how much you keep, what matters is how much you
re-invest.
3. No matter how much you re-invested, what matters is your
total return on investment (ROI).

Another formation of head and shoulderSolano possibly forming a head and shoulder weekly pattern. Watching the support is critical which confirms the head and shoulder pattern and a reversal opportunity to a lower target such as the trendline support or even lower. An invalidation of the left shoulder open opportunity to break out the ATH and target higher. The weekly moving average holding a support at the moment and price didn't dip lower. Keeping major economics in mind the higher highs and expectation of cutting interest rate could invalidate the head and shoulder pattern.

Solana consolidated above the descending wedge ┆ HolderStatBYBIT:SOLUSDT rotated higher after a swift corrective channel, reclaiming the mid‑range and pushing back toward the 195–205 supply. The chart highlights repetitive triangle resolutions and a strong sideway accumulation before the last impulse, suggesting ongoing demand. Immediate support sits at 176–180 and 168–170; holding above keeps attention on 195, then 205. A breakout through 205 unlocks 210–215 near the upper trend band. Only a daily close beneath 168 would compromise the structure and re‑open 155–160. Until then, dips remain buyable with targets at 195/205.

is trend bullish or bearish?look at this canal we are in lower low and lower high trend is bearish !!but know i think trend is still bearish why becuase we havnt reach the upper band the canal it must break the upper band
to sure bullish trend is start again its take a time maybe 1 or 2 month but now we are in another Lower low again in 170 price after touch it and reject it maybe market goes down just remmember this post for now i think a long and exit in 170 maybe good .ijust wana trust myself again i wait for its will be happen

my emotion ruin my tradei understand the market after 3 years watching learning thinking i reach a level i could predict the future price in 70 % come true but my emotion destroy every think i analized my fear my greed make my patient low i dont know what should i do ?a lot of adrenalin come to my body fear greed if you see my post please help me to do some thing next post i talk about trend

SOL/USDT | NFP Volatility Could Trigger Drop Toward $154!By analyzing the Solana chart on the daily timeframe, we can see that the price is currently trading around $169. If it fails to hold above the $168 level, a deeper drop could follow. With the upcoming NFP data release, increased volatility is expected across the markets. If Solana begins to decline, the potential correction targets are $163, $157, and $154. Watch the $145–$154 zone closely for a possible bullish reaction and buy opportunity.
Please support me with your likes and comments to motivate me to share more analysis with you and share your opinion about the possible trend of this chart with me !
Best Regards , Arman Shaban
Solana Update · Retrace, Bears & The Bullish BiasSolana had a retrace in May. Notice the 19-May date on the chart. This retrace produced four weeks red. The bullish move that led to this retrace lasted 6 weeks. The last rise lasted five weeks and the current retrace might last only two weeks, can be less.
We are seeing Solana rising but this rise is not a one-time off event, this is a trend that is developing. An uptrend as a long-term phenomena is different to a short-term bullish moves. A short-term move tends to be really fast, one strong burst and that's it. A long-term move is different. Instead of seeing 2-3 candles and Solana trading at $1,000, we see dozens and dozens of candles with prices slowly rising. There are strong fluctuations but the end result is always up. And that's how you see the fluctuations on the chart.
Solana moved up and then immediately started to retrace. Then another rise and another retrace again. This retrace will end and prices will continue to grow long-term. The bulls are in. The bull market is on. Solana, Bitcoin, Crypto and the rest of the Altcoins market is going up.
Namaste.

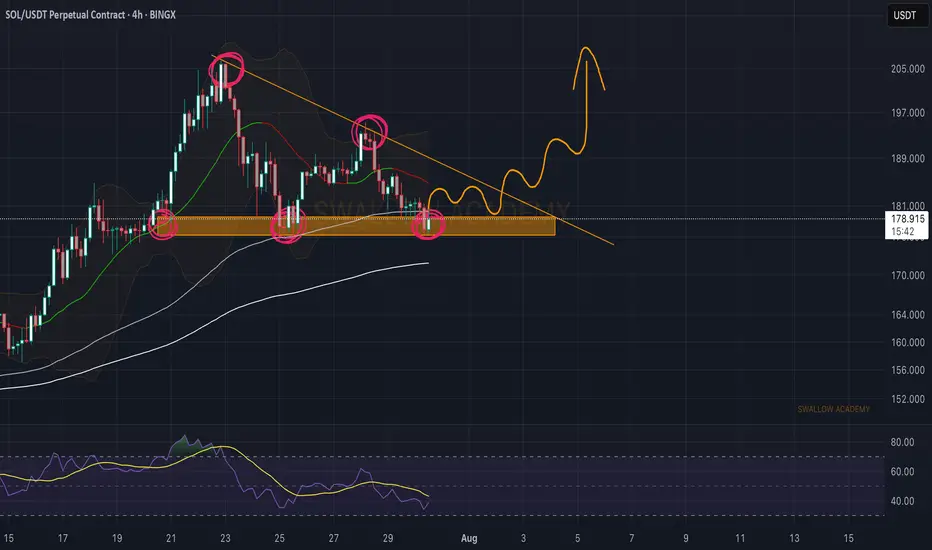
Solana (SOL): Triangle Pattern | Waiting For Bullish BreakoutSolana failed to break down from the local neckline zone (or support zone, for those who want to call it that). What we got instead is buyside dominance, where buyers took back the area and are now pushing the price back toward the upper side of that triangle pattern, so that's where our current target is sitting, as long as we break that line.
Swallow Academy
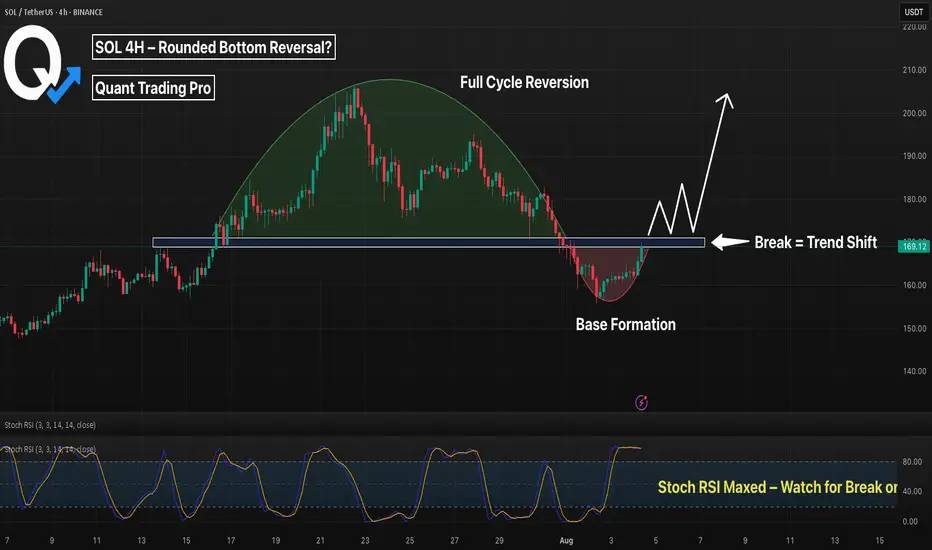
SOL 4H – Rounded Bottom Forming, But Will It Break the Neckline?Solana may be completing a rounded bottom formation on the 4H chart — a classic reversal pattern that often signals a shift from distribution to accumulation. After a deep pullback from July highs, SOL has carved out a smooth base with clear curvature, now pressing into the neckline resistance around $169–$171.
The structure resembles a full cycle: a rounded top leading into a rounded bottom — a potential "cup" formation. With Stochastic RSI pushing into overbought territory, we’re approaching a key decision point.
🔍 Key Factors:
– Rounded bottom structure shows controlled re-accumulation
– Neckline acting as current resistance (watch for breakout)
– Break + retest could trigger the next leg toward $185–$190
– Failure to break may lead to chop or retrace toward $158–$160
This pattern often precedes explosive continuation if volume confirms the breakout.
Will SOL confirm the reversal — or is this just another trap?
👇 Comment your thoughts below.
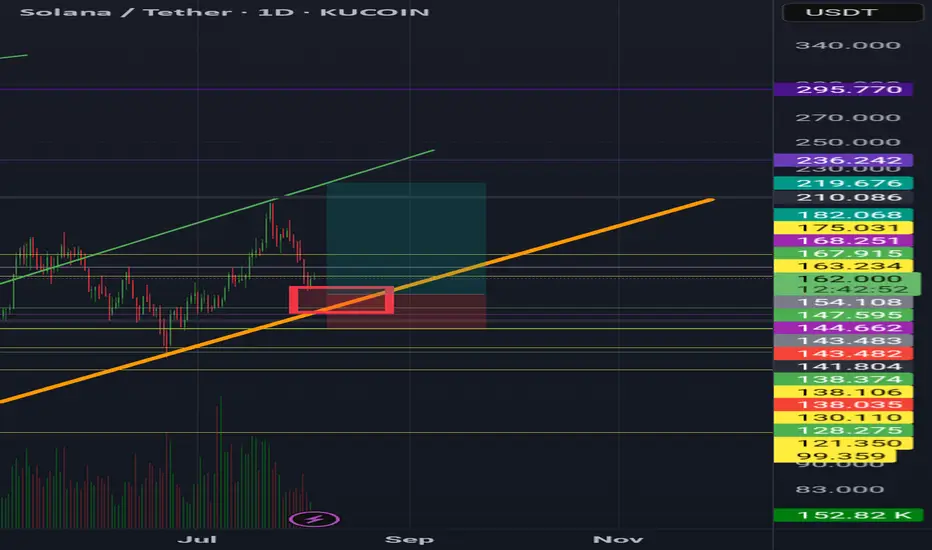
SolanaZol usdt daily analysis
Time frame daily
Position long
Target 219$
Risk rewards ratio >4 👌👈
Red box on the cart is the good erea to entrance long position
Orange uptrend line is a very strong support lines
I guess in this turn of upcoming, solana will reach my target
SOL/USDT | Solana Jumps 14% – Eyes on $182, $195 & $206 Next!By analyzing the Solana chart on the daily timeframe, we can see that after correcting to $155, the price regained bullish momentum and is now trading around $178, up more than 14%. I expect this upward move to continue, with the next targets at $182, $195, and $206. This analysis will be updated soon!
Please support me with your likes and comments to motivate me to share more analysis with you and share your opinion about the possible trend of this chart with me !
Best Regards , Arman Shaban

#SOLUSDT: Price to turn extreme bullish! Get ReadyHey there everyone! 👋
I’ve got some updates on the BINANCE:SOLUSDT price. It’s been testing a crucial level, and it’s showing some really strong bullish signs and patterns. But here’s the thing, we’re starting to think there might be a possible reversal coming up in the next few days. If we’re right, the price could hit all three targets we’ve been tracking.
Remember, though, that this is just our analysis, and it’s always a good idea to use accurate risk management when you’re trading.
Thanks for your support! 😊
If you want to help us out, here are a few things you can do:
- Like our ideas
- Comment on our ideas
- Share our ideas
Team Setupsfx_
