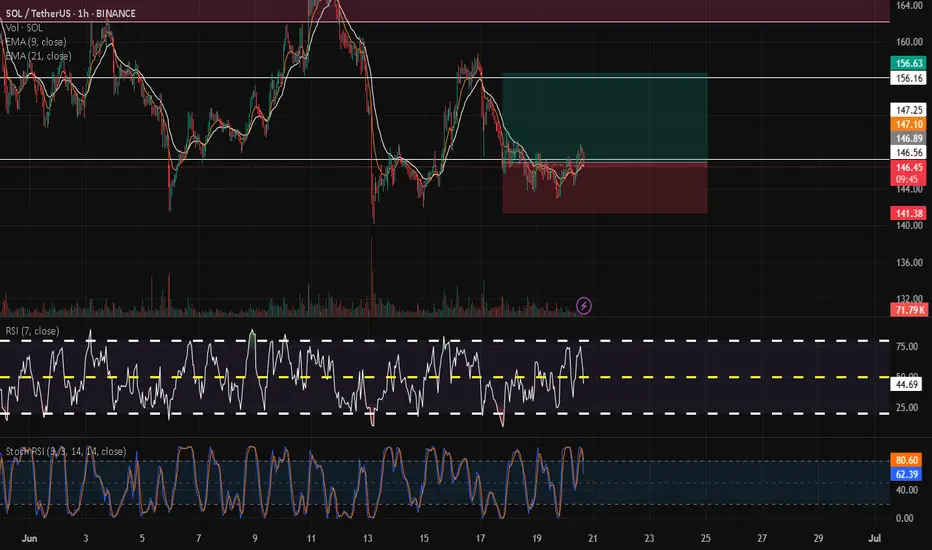
SOLANA → BINANCE:SOLUSDT.P is consolidating after breaking through trend resistance. The market trigger is 148.0, and Bitcoin is provoking the market to recover...
The market is buying back all the losses. SOL breaks the local downward resistance and forms consolidation with a trigger of 148.0. The market has come to life following the rallying Bitcoin. If the general trend continues, SOL may break out of the accumulation zone and form a distribution towards 154.0
The latest retest of resistance is provoking a correction. Before rising, the price may test the zone of interest at 144 or the lower boundary of consolidation at 142.2. The ideal scenario would be a false breakdown of support at 142.2 before rising.
Resistance levels: 148.0, 154.2
Support levels: 142.2, 137.5
Fundamentally, the situation for the crypto market is improving. Technically, the market is also showing positive dynamics. SOL is consolidating after growth, which is generally a positive sign. Now we need to wait for the price to break out of consolidation and continue its growth. One of the signs of this is a rebound from the 0.5 range and a quick retest of resistance with a gradual squeeze towards the trigger.
Best regards, R. Linda!
SOLUSDT trade ideas

SOLANA I Daily CLS I KL - BRK I Model 1I Target TRCHey, Market Warriors, here is another outlook on this instrument
If you’ve been following me, you already know every setup you see is built around a CLS Footprint, a Key Level, Liquidity and a specific execution model.
If you haven't followed me yet, start now.
My trading system is completely mechanical — designed to remove emotions, opinions, and impulsive decisions. No messy diagonal lines. No random drawings. Just clarity, structure, and execution.
🧩 What is CLS?
CLS is real smart money — the combined power of major investment banks and central banks moving over 6.5 trillion dollars a day. Understanding their operations is key to markets.
✅ Understanding the behavior of CLS allows you to position yourself with the giants during the market manipulations — leading to buying lows and selling highs - cleaner entries, clearer exits, and consistent profits.
📍 Model 1
is right after the manipulation of the CLS candle when CIOD occurs, and we are targeting 50% of the CLS range. H4 CLS ranges supported by HTF go straight to the opposing range.
"Adapt what is useful, reject what is useless, and add what is specifically your own."
— David Perk aka Dave FX Hunter ⚔️
👍 Hit like if you find this analysis helpful, and don't hesitate to comment with your opinions, charts or any questions.

SOLANA SOL to 3800$ nextSolana is in mid range, 61.8% retracement bottom, similar to TSLA at 19 Aug 19,
since Sol is the most used cypto (90% of blockchain usage) i expect a massive bullrun.
Sol will outperform bitcoin

#SOLUSDT LONG-TERM SETUPMEXC:SOLUSDT.P showing again an good price zone for entry i made this entry 2 days ago
still at the same point, it has a potential to perform to the target
you can take some entry at this point
meanwhile as you all know there is tension b/t #irna_israel so any thing can be happen so if you are planning to take position use low margin and apply some risk to reward ratio into your trade
#Hamm_crypto
SOL/USD🔹 Trend direction
Current short-term trend: down
Price below key moving averages:
SMA50 (green) ≈ 154.84
SMA200 (blue) ≈ 168.79
Price ≈ 142.49 – below both, confirming weakness.
🔹 Supports and resistances (key levels)
✅ Supports:
142.00–143.50 – current level where price is struggling (multiple price reactions).
131.00 – strong support, last low (June 18).
119.00 / 116.00 / 113.00 – next supports from previous consolidations.
95.61 – deep support if market breaks down.
❌ Resistances:
148.00–150.00 – local resistance, coinciding with the red SMA (short-term resistance).
154.84 – resistance (SMA50).
162.00 – resistance (SMA200).
183.00 – main resistance from the May peak.
218.55 – very strong resistance from March.
🔹 Technical indicators
📉 MACD:
MACD line < signal, negative histogram → bearish signal.
No signs of bullish strength.
📉 RSI:
RSI ≈ 41.31 – close to the oversold zone, but not there yet (below 30).
RSI trend also downward.
🔹 Formations and trend lines
Broken support line after the April-May bullish structure (white trend line).
The previous bearish trend line (yellow) was broken in April, but the momentum did not hold.
A lower high and lower low may be forming now – a classic bearish structure.
🔹 Potential scenarios
🔻 Bearish:
Breakout of 142 → test of 131 → possible drop to 119/116.
Staying below SMA50 and MACD still negative = high chance of continuing declines.
🔼 Bullish:
Recovery of 148–150 needed → only then a chance to test 154 and SMA50.
RSI close to oversold = possible local technical bounce, but not reversing the trend.
📌 Conclusions / Summary
General trend: Bearish (down).
Sentiment: Negative, no confirmed signals of strength.
If level 142 breaks - next test will be at 131.
A strong breakout above 150-154 is needed to talk about a change in structure.

Solana SOL price analysis📞 Rumor has it that as soon as the global geopolitics reach a “temporary lull”, the following ETFs will be launched
Solana ETF is the most likely to be the next one (but there are at least 2 coins more on the list, which we will talk about in the coming days)
🪙 So, are you ready to buy CRYPTOCAP:SOL in your investment portfolio? For example, in the range of $117-123
🤖 Maybe we need to launch a long trading bot OKX:SOLUSDT so that it can buy in micro portions on the current possible price correction to get a “tasty price” as a result
◆ Would you like to join such a trading bot and copy them?
◆ And then compare the results with all “ETF candidates”
_____________________
Did you like our analysis? Leave a comment, like, and follow to get more

SOL - Playing Ping Pong!Hello TradingView Family / Fellow Traders. This is Richard, also known as theSignalyst.
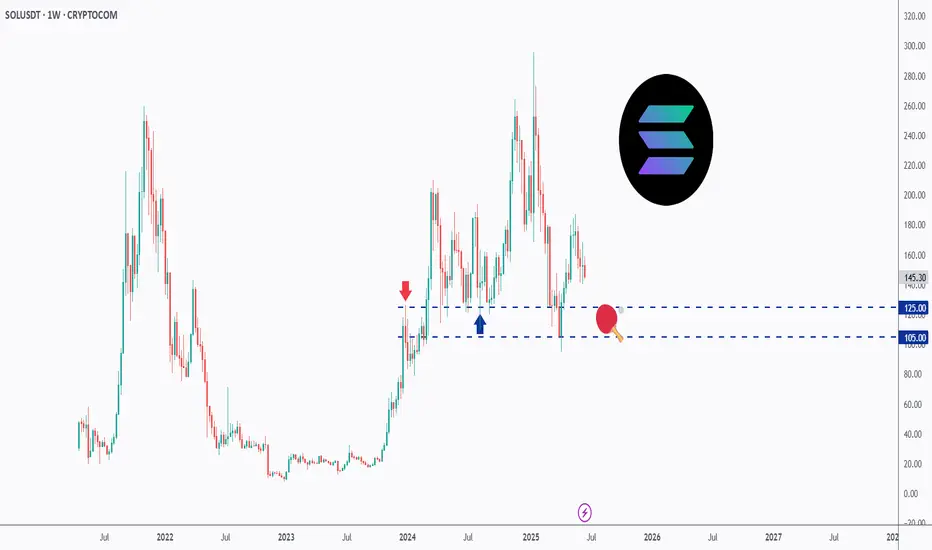
📈SOL has been trading within a range between $100 and $200 round number.
And it is currently retesting the lower bound of the range which has been acting as a magnet lately.
As SOL approaches the $105 - $125 support zone, and as long as the $105 support holds, we will be looking for longs targeting the $200 round number.
📚 Always follow your trading plan regarding entry, risk management, and trade management.
Good luck!
All Strategies Are Good; If Managed Properly!
~Rich
SOL TECHNICAL ANALYSIS !!CRYPTOCAP:SOL is testing the upper boundary of its falling channel.
No breakout yet, just a clean retest of trendline resistance + 0.5 Fib zone around $144–$146.
A breakout above $152 (Fib 0.382) with volume could shift the structure bullish. Until then, it’s still inside the downtrend.
This is where patience pays, wait for confirmation, not hope.
What’s your play here?
If you find my updates helpful, don’t forget to like and follow for more!
DYOR, NFA
#Solana #SOL

Lingrid | SOLUSDT possible Channel BreakoutBINANCE:SOLUSDT is showing early signs of recovery after rebounding from the 127 support zone and reclaiming structure near the 140 level. Price is now consolidating below the red descending trendline, which acts as dynamic resistance. A breakout above 145 could confirm bullish reversal and target the 159 resistance zone as indicated by the star projection. The key lies in whether buyers can sustain pressure above the 140 zone.
📈 Key Levels
Buy zone: 138–142
Sell trigger: break below 127
Target: 159
Buy trigger: breakout and close above 145 trendline
💡 Risks
Failure to hold above 140 may lead to fresh lows
Downtrend may resume if price gets rejected at 145
Low volume breakout may signal a bull trap
If this idea resonates with you or you have your own opinion, traders, hit the comments. I’m excited to read your thoughts!

Technical Analysis of SOL/USDT (Weekly Chart)
The chart shows a Falling Wedge pattern – a typically bullish reversal formation.
A breakout to the upside from the wedge has occurred, signaling the potential start of an upward trend.
📉 Entry Zone (LONG HERE):
Clearly marked around the Fibonacci support levels:
0.618 (~130 USDT)
0.786 (~115 USDT)
This support zone is strong and ideal for long positions.
📊 Fibonacci Retracement Levels:
0.382 – First resistance
0.5 – Mid-level resistance
0.618 – Strong retracement support that price bounced from
🎯 Target Projections:
204.31 USDT – First target; a strong historical resistance.
229.01 USDT – Second target; a breakout above this would confirm bullish strength.
258.45 USDT – Final target if the bullish momentum continues.

Solana:Daily free signalhello friends👋
As you can see, after the drop that we had, insider buyers showed and were able to support the price well.
But it was not enough, and as you can see, a noisy pattern has formed, which can indicate a further decrease in the price.
Now we can take advantage of this opportunity and make step-by-step purchases with risk and capital management in the support areas that we have obtained for you and move to the specified goals.
🔥Follow us for more signals🔥
*Trade safely with us*

Solana Bearish Divergence, 20% Drop Incoming?Hey Realistic Traders!
Bearish Signal Flashing on BINANCE:SOLUSDT , What Signals Are Showing?
Let’s Break It Down..
On the daily timeframe, Solana has formed a double top pattern, followed by a neckline breakout, which is a classic sign of a potential shift from a bullish to a bearish trend.
This breakout was confirmed by a break of the bullish trendline, accompanied by rising selling volume, which reinforces the bearish momentum. Adding to this, a bearish divergence has appeared on the stochastic oscillator. Bearish divergence occurs when price makes higher highs while the oscillator forms lower highs, signaling weakening buying pressure and increasing the likelihood of a reversal.
Given these technical signals, the price is likely to continue moving lower toward the first target at 134.13, with a possible extension to the second target at 114.96.
This bearish outlook remains valid as long as the price stays below the key stop-loss level at 180.26.
Support the channel by engaging with the content, using the rocket button, and sharing your opinions in the comments below.
Disclaimer: "Please note that this analysis is solely for educational purposes and should not be considered a recommendation to take a long or short position on Solana.

Solana mid range pullback before shoting to new highs320$ seems a reasonable target for SOL, if not much higher

#Sol ShortBias: Leaning bullish short-term (1–3 days), backed by momentum and price structure.
Caution: Funding remains slightly negative—and RSI is near overbought, so a minor consolidation is possible before another leg up.
Trade ideas:
Aggressive: Long near $142–144 with stop below $140, target $150+.
Conservative: Wait for confirmed breakout above $146 before entering long.

SOL - It won't take your soul!SOLOLOL - SOL basically can go direct or if not a halt and a move! But all is interlinked and intertwined to btc!

Weekly trading plan for SolanaLast week, the downtrend continued, but after the weekend, the price staged a fast recovery. Right now, it’s trading above the weekly pivot point but hasn’t managed to break the descending trendline yet. We might see a short pullback before another push higher toward the weekly targets and the monthly pivot. However, if negative news hits or the price shows weakness after breaking the weekly pivot, we could get another leg down toward the 3rd monthly target
Write a comment with your coins & hit the like button and I will make an analysis for you
The author's opinion may differ from yours,
Consider your risks.
Wish you successful trades ! mura

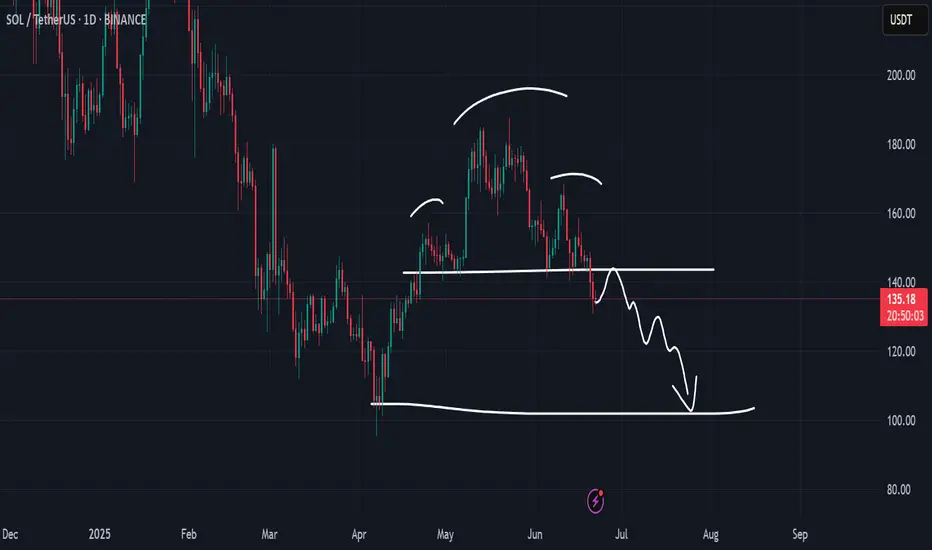
Solana head and Shoulders ?This pattern need to be confirmed by the second shoulder, then keep an eye on the volume, the RSI and the pattern neck line to take a trade and aim for position to TP

Give me your SOL!!SOL not SOUL!! Just look at it and understand your stances whats gonna happen if it happens!

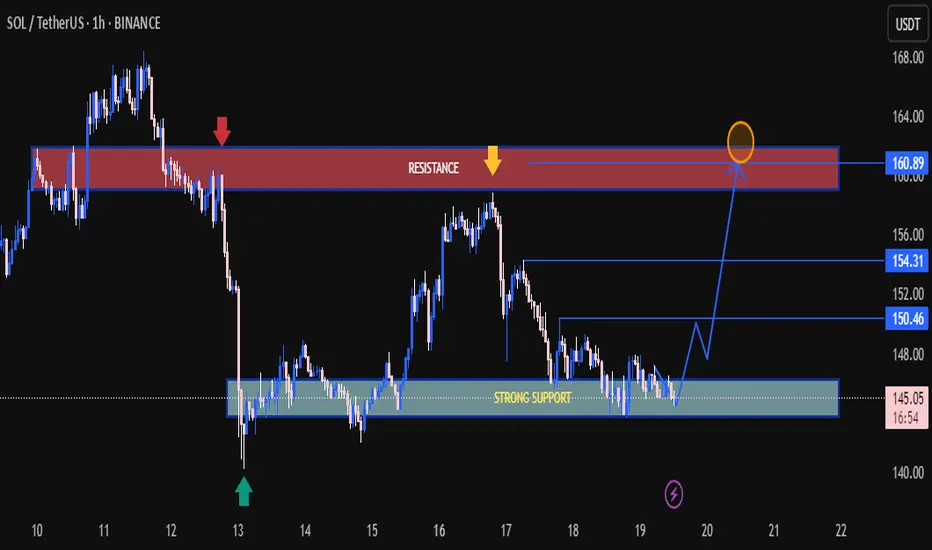
SOL/USDT 1H Chart Analysis – Bullish Reversal Targeting Resistan🚀 SOL/USDT 1H Chart Analysis – Bullish Reversal Targeting Resistance Zone 🎯
📊 Pair: SOL/USDT
🕐 Timeframe: 1H
📈 Platform: Binance
🔍 Technical Overview:
🔵 Support Zone (145.00 – 147.50 USDT)
Price has bounced multiple times from this strong demand zone marked in light blue.
Recent price action shows buyers defending this level aggressively — potential accumulation area. ✅
🔴 Resistance Zone (159.50 – 162.00 USDT)
Marked in red, this zone has historically rejected price twice (confirmed by red & yellow arrows).
Currently, the market is expected to retest this supply area once again. ⚠️
📈 Bullish Pathway:
Current structure suggests a reversal from support, aiming for:
TP1: $150.46
TP2: $154.31
TP3 / Final Target: $160.89 (within resistance)
🔄 Trend Structure:
Price is forming higher lows, hinting at early reversal stages.
Break above $150.46 would confirm bullish momentum. 🟢
🧠 Conclusion:
SOL/USDT is setting up for a bullish reversal from a strong support zone, with targets aligned toward previous resistance. Traders should monitor the reaction at $150.46 and $154.31 — a clean break may propel price to $160.89.
📌 Watch for:
Confirmation candle at support zone
Break and retest patterns on intraday resistance levels
📉 Support: 145.00 – 147.50
📈 Resistance: 159.50 – 162.00
🎯 Bullish Targets: 150.46 → 154.31 → 160.89
🔔 Stay updated, manage risk, and trade wisely! 💹📈
Solana Breakdown Incoming? These Are Key Levels To WatchYello, Paradisers! Are you ready for the next major flush? After failing to gain momentum since the May double top breakdown, #SOL is now showing even more bearish signs, and the market might be about to punish late bulls one more time.
💎Following the confirmed double top in May, SOL has struggled to reclaim any upside momentum. Now, on the 12-hour chart, a classic head and shoulders formation is emerging, a pattern that often precedes larger trend reversals when the neckline breaks.
💎#SOLUSDT is hanging onto critical support between $142 and $140. This zone is the neckline, and it’s the last stand for bulls. If bears break it, we get a clear breakdown confirmation, with a clean path down toward $130–$127, which marks the first major demand area.
💎That initial support likely won’t hold for long. If pressure continues, SOL is expected to drop further toward the $115–$110 region. This is not just a technical support, it’s also the target area of the H&S formation, making it a magnet zone for price.
💎Adding to the bearish developments, a death cross has now been confirmed on the 12-hour chart. The EMA-50 has crossed below the EMA-200, reinforcing short-term downside pressure. Even if a relief bounce occurs, the $155 region, where the EMA-50 sits, will likely act as fresh resistance and attract renewed selling.
Paradisers, strive for consistency, not quick profits. Treat the market as a businessman, not as a gambler.
MyCryptoParadise
iFeel the success🌴

SOL 2D BULLISH, Entry points New HH coming up?So guy as we have seen a downtrend SOL from 180 price resistance and so now price trading on very critical area. We have fvg on 2D around 120-123 and still haven’t not been taken. So there is two scenarios and mostly like price will reject from fvg and head toward to W fvg which we have Above on Weekly TF. The confirmation will be respect to fvg and overall market conditions. Also I am bearish on SOL 2 weekly TF, which we should not forget. If price respect to fvg and overall market conditions was bullish then we can enter around 120-130 and TP will be 210-220

