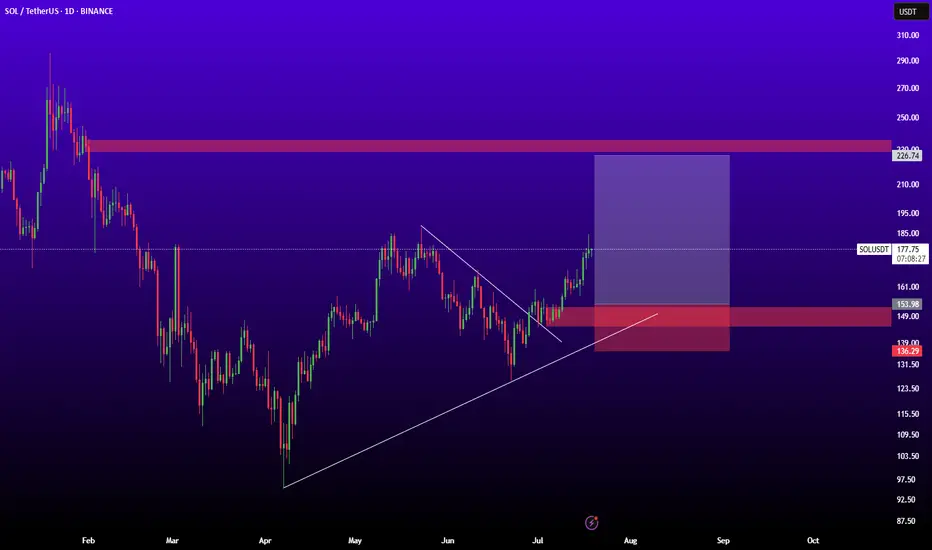
SOLUSDTThis signal for bull-trend because breaked trendline and higher high higher low.
best entry: 154
stop: 136
traget: 226
SOLUSDT trade ideas
SOL - Trend-Following Longs in the making!Hello TradingView Family / Fellow Traders. This is Richard, also known as theSignalyst.
📈SOL has been overall bullish trading within the rising channel in red.
Moreover, the orange zone is a strong demand.
🏹 The highlighted blue circle is a strong area to look for buy setups as it is the intersection of the orange demand zone and lower red trendline acting as a non-horizontal support.
📚 As per my trading style:
As #SOL retests the blue circle zone, I will be looking for bullish reversal setups (like a double bottom pattern, trendline break , and so on...)
📚 Always follow your trading plan regarding entry, risk management, and trade management.
Good luck!
All Strategies Are Good; If Managed Properly!
~Richard Nasr

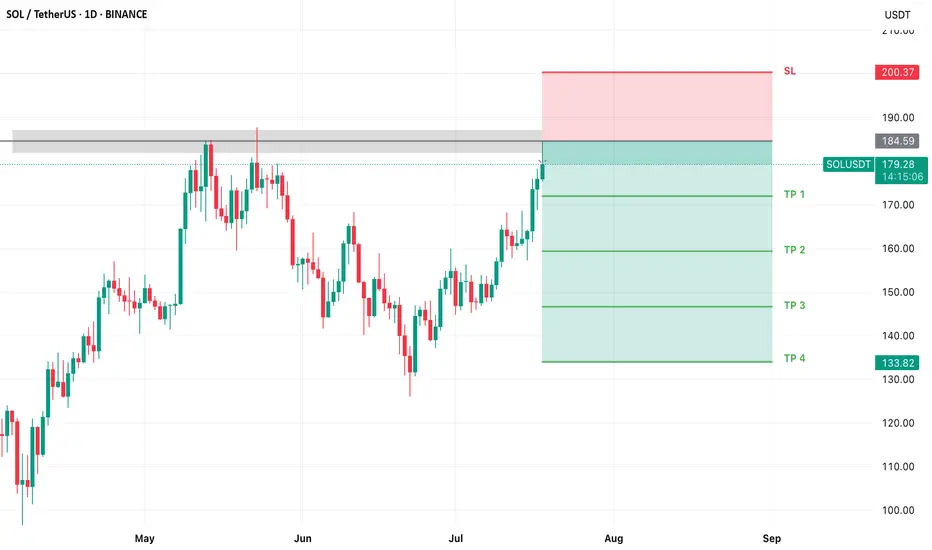
Solana Eyes 15% Rally, Targeting $210 After Key Support BounceHello✌
Let’s analyze Solana’s upcoming price potential 📈.
BINANCE:SOLUSDT is approaching a key daily support near the 0.38 Fibonacci level, setting up for a potential 15% rally with a target around $210. Breaking above the important psychological resistance at $200 could confirm a bullish trend continuation. 📈 If this level holds, SOL looks well-positioned for further upside in the coming weeks. 🚀
✨We put love into every post!
Your support inspires us 💛 Drop a comment we’d love to hear from you! Thanks , Mad Whale 🐋

Inverted head and shoulder suspected ..keep an eye on necklineHi dear friends and followers, I suspect this inverted head and shoulders pattern with a neckline around 160 usd. If it breaks in, it can go down toward the inferior support level around 130 usd and the 0.618 Fibo. If it breaks out it can go up until the next resistance and psychological level of 200 usd. As you can see, this 200usd resistance level does match with a large ascending channel.
You all need to DYOR and keep an eye on RSI and volume to confirm the movement and take a trade.
Wishing you the best and success on your decision.

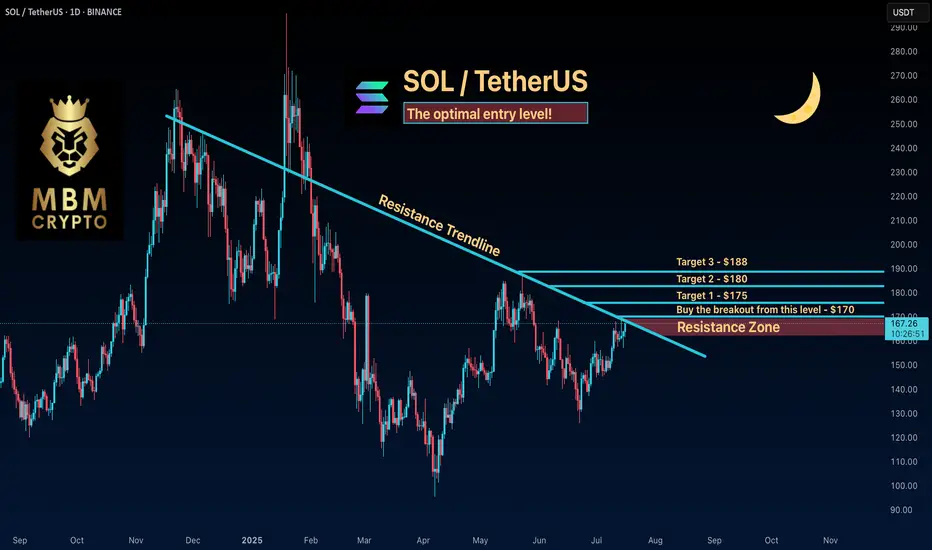
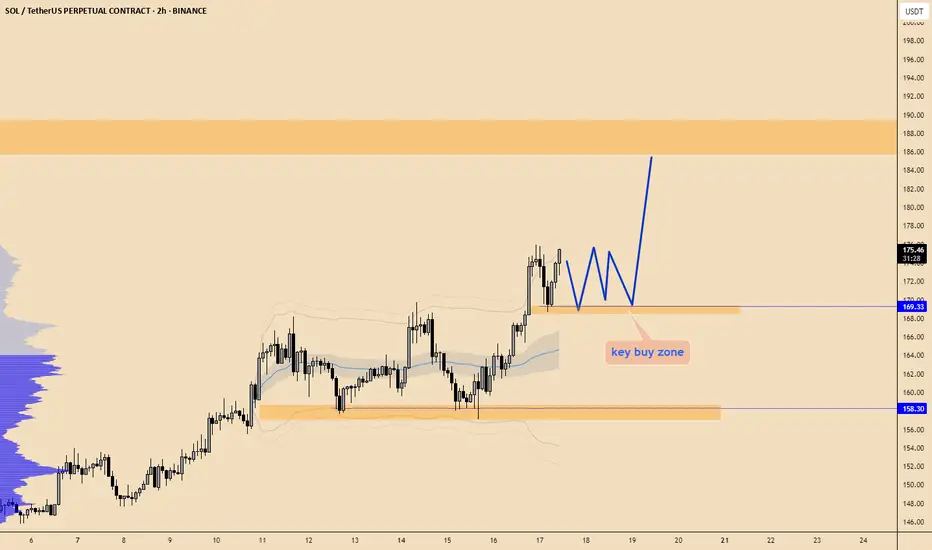
SOL: The optimal entry level! Keep an Eye on SOL
Now is the time to watch SOL. If the price breaks to the upside, we could see a significant move that might take it above $190!
Trading Setup
If you’re considering trading SOL, here’s a quick setup that may help you.
The idea is: Buy when the price breaks above $170 and take profits at the levels shown in the chart.
Targets:
1. $175
2. $180
3. $188
-------------------------------------------
About our trades:
Our success rate is notably high, with 10 out of 11 posted trade setups achieving at least their first target upon a breakout price breach (The most on TW!). Our TradingView page serves as a testament to this claim, and we invite you to verify it!
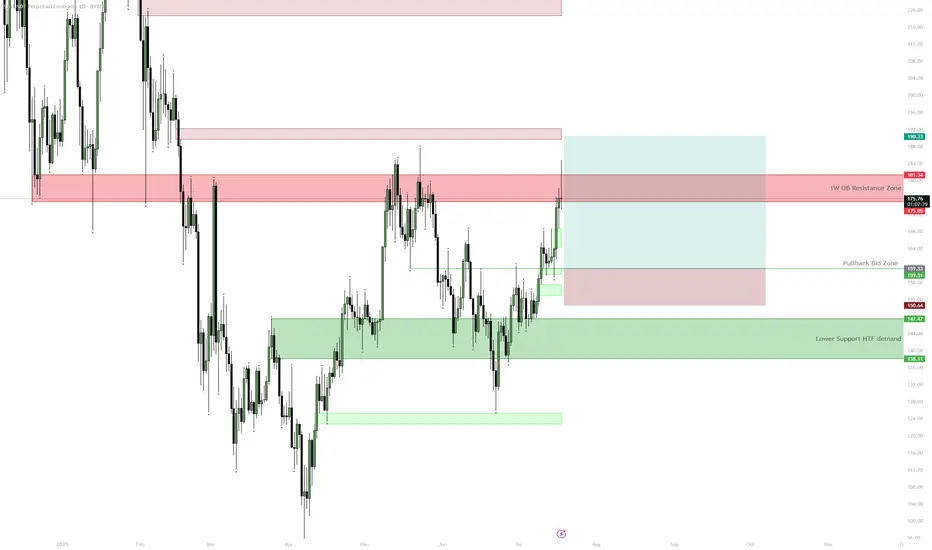
SOL — $180 HTF Resistance | Consolidation ExpectedSOL is approaching a key HTF resistance zone at $175–$181 with 1D RSI close to overbought. Unless price cleanly breaks above this area, a pullback to $160 or even the $138–$147 demand zone is likely before further upside. The setup provides a better risk/reward for longs on pullbacks after consolidation rather than chasing at resistance.
SOL Breakout — Eyeing $180 NextCRYPTOCAP:SOL | Breakout above channel — main target $180 next.
Watch $140–145 for retest/bounce. If failed, $112 is major support.
Trend: Bullish | Next stop: $180

Solana Testing the June Breakdown Level — Decision TimeAfter weeks of slow grind, SOL is now pressing into a level that triggered a major selloff in June. A clean breakout here could flip momentum hard — but if buyers stall again, a short-term double top could catch late longs off guard. Watching $185 closely.

SOL/USDT Technical Outlook – Breakout Holding, Eyes on 175+Solana has successfully broken above the key resistance zone at $155–157 and is currently testing it as new support. If the level holds, this breakout could extend toward the next major target around $175–178.
📌 Key Insights:
Clean breakout followed by a potential SR flip
Watch for confirmation of support before continuation
Target aligns with previous swing high
Invalidated on breakdown below reclaimed level
🟢 Bias remains bullish as long as price holds above the breakout zone. A confirmed retest could provide a high-probability long setup.
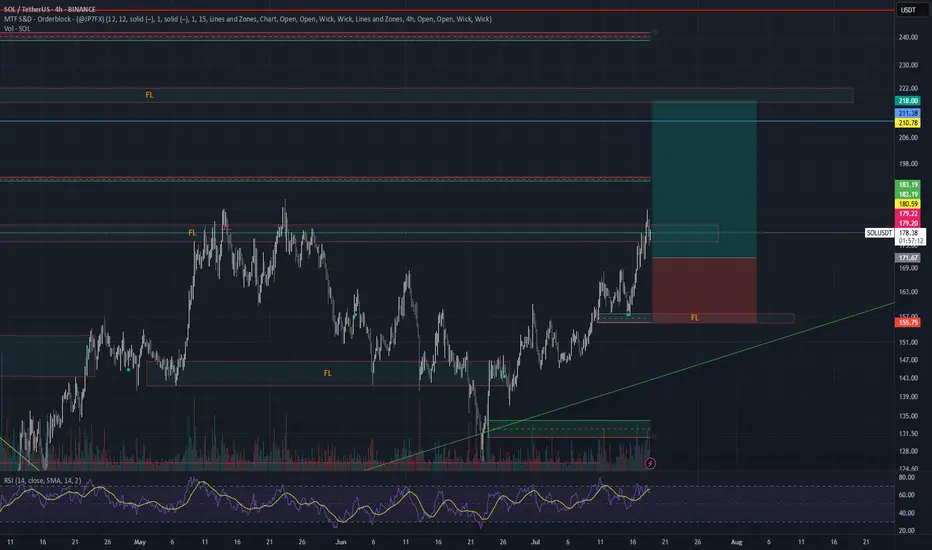
SOLUSDT – Healthy Pullback Before ContinuationSolana has shown strong bullish momentum recently, breaking out of a consolidation range and trending upward within a clear ascending channel.
However, in the short term, I expect a minor correction as price is likely to revisit the Fair Value Gap (FVG) zone marked around the $160–$165 area. This would be a healthy retracement within the trend and could provide a solid base for continuation toward higher targets.
If price respects the FVG and the lower trendline, SOL could resume its bullish move, potentially aiming for the $200 level and higher within the channel.
Key levels to watch:
FVG support zone: $160–$165
Resistance target: $200 – $220
Waiting for a pullback to enter on strength. Trend remains intact as long as the channel holds.

Solana starting to look bullish again | Target $180 - $260In my previous idea, I anticipated a liquidity hunt below the $140 level, and price action played out exactly as expected. SOL wicked below this key support zone, triggering stop-losses and inducing panic selling — classic behavior before a major reversal. Following this sweep, price quickly reclaimed the range, breaking out of the downward channel, and is now retesting a bullish break of a textbook cup-and-handle pattern, signaling a potential trend continuation to the upside.
📊 Technical Setup
Cup and Handle formation is evident, with the "handle" forming as a downward-sloping channel now being challenged.
Price reclaimed the $140 demand zone post-sweep and is now retesting.
Target zones: $180 → $220 → $260 based on historical resistance levels and measured move projections.
📉 Invalidation Level
A daily close below $120 (marked as the Invalidation Zone) would invalidate this setup and suggest bulls have lost control.
🌐 Macro Perspective
Fed Rate Cut anticipation and cooling inflation data are helping risk-on assets like crypto regain momentum.
SOL staking ETF launching this week, while SOL spot ETF approval imminent.
Solana's growing DeFi ecosystem, along with high TPS performance and low fees, continues to attract developer and user activity. SOL remains a top candidate for sector outperformance in a bullish H2 crypto cycle.
📌 Conclusion
With market structure turning favorable and strong macro tailwinds, SOL may be gearing up for a major breakout rally. Watch the $160 level closely — a decisive break and hold above could confirm the next leg higher.

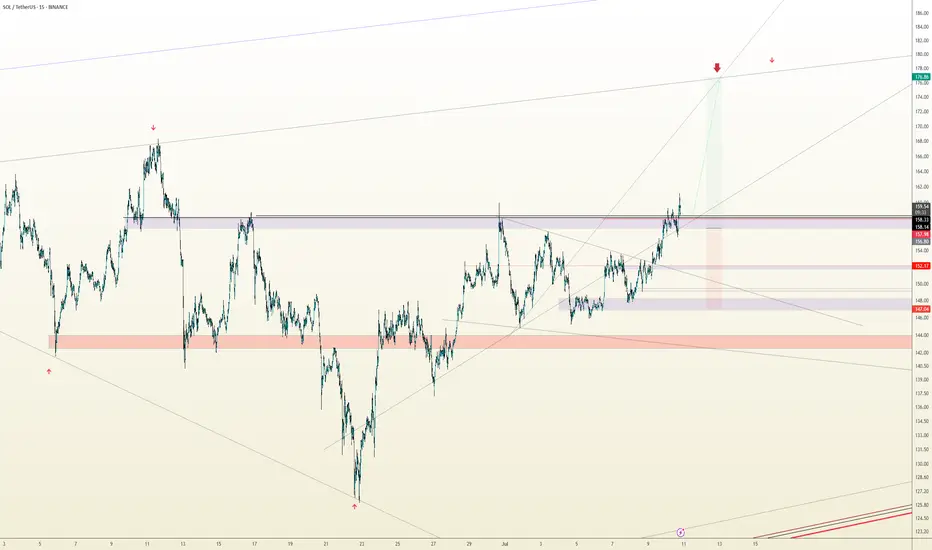
SOL USDT SHORT TRADE SETUPTechnical Analysis: SOL/USDT is currently holding at a strong resistance zone, with a high probability of an downward price move. With a very good risk reward trade.
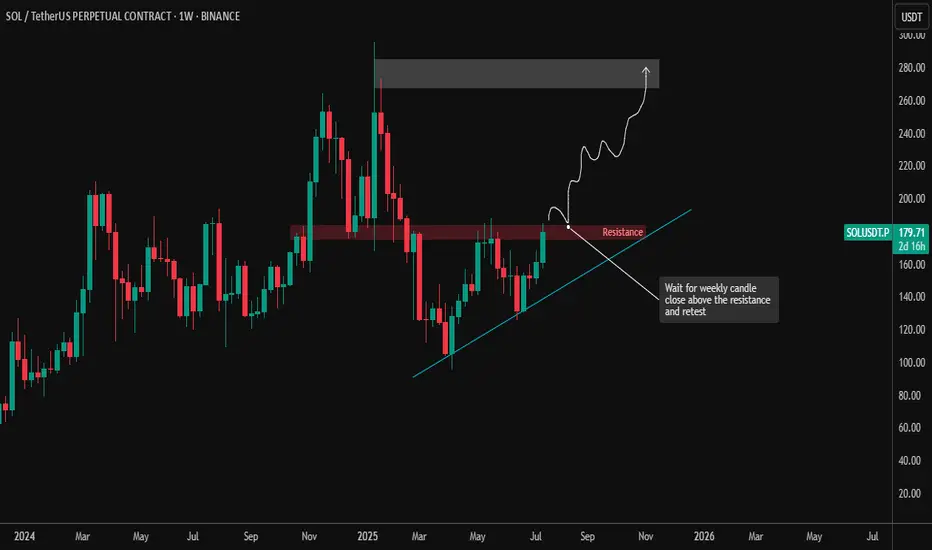
SOL/USDT – Weekly Chart Analysis (July 18, 2025)Solana is at a critical breakout point as price pushes against a long-standing horizontal resistance zone between $175–$180. This zone has been tested multiple times since late 2024, making it a significant level to watch.
🔹 Current Price: ~$179.66
🔹 Resistance Zone: $175–$180
🔹 Next Major Supply Zone: $260–$290
🔹 Trendline Support: Still intact and respected since the Q2 lows
📌 Key Setup:
SOL is attempting a breakout above the horizontal resistance.
Price structure shows a series of higher lows, indicating growing bullish momentum.
A weekly candle close above $180 followed by a successful retest would confirm the breakout and could open up upside toward the $260–$290 zone.
📈 Trade Plan:
Breakout Entry: After a confirmed weekly close + bullish retest of $175–$180
Invalidation: Break below trendline and failure to hold above $160
Target: $260–$290 zone, where previous supply stepped in
🧠 Patience is key: Wait for confirmation and don’t chase breakout candles. This level has historically acted as a trap — confirmation is critical for safer entries.
#Solana #SOLUSDT #CryptoTrading #TechnicalAnalysis #Altcoins #Binance
DeGRAM | SOLUSD seeks to confirm the breakout📊 Technical Analysis
● Bulls pushed back inside the broad rising channel and pierced the five-week gray trend-cap; the breakout has been retested at the 147-150 pivot (green strip), now acting as support.
● Price is carving a tight bull-flag on diminishing volume; its 1.618 swing and the channel median intersect with the May swing high near 173, while the upper rail aligns with 187-190.
💡 Fundamental Analysis
● VanEck’s late-June 19b-4 filing for a US spot Solana ETF trimmed perceived regulatory risk, and Firedancer’s public test-net timeline lifted developer sentiment, both fuelling fresh inflows.
✨ Summary
Long 147-150; flag break above 155 targets 173 → 187. Invalidate on a 16 h close below 140.
-------------------
Share your opinion in the comments and support the idea with a like. Thanks for your support!

#SOL Update #5 – July 18, 2025#SOL Update #5 – July 18, 2025
Solana has returned to the region where its last impulsive move was formed. It appears to be attempting another bounce, but when we look at the SOL/BTC pair, it is currently facing a strong resistance zone.
There isn't much room between this resistance and the 200 MA band, which makes this a critical decision zone. At the moment, I do not recommend entering either a Long or Short position — it’s best to wait and observe.
If Solana breaks out to the upside, the next target will likely be $179.

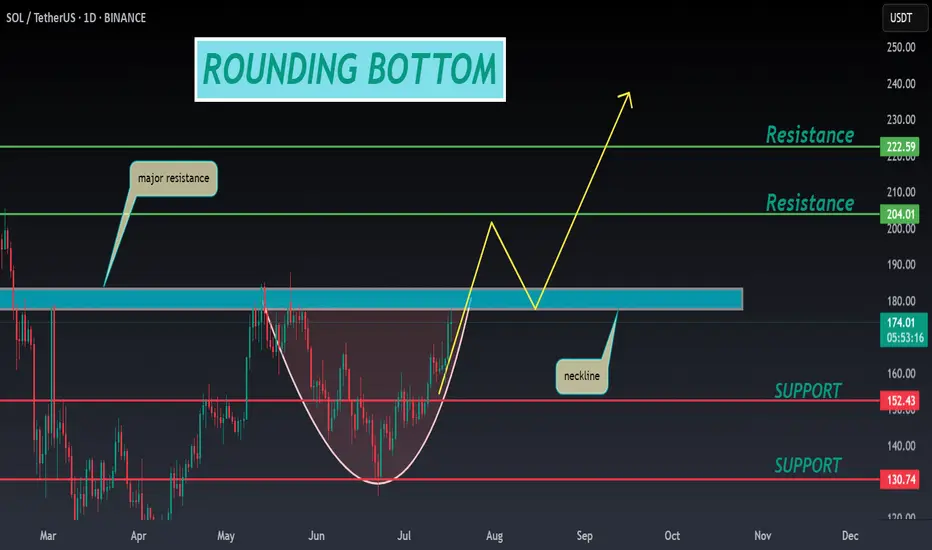
SOL ANALYSIS🔮 #SOL Analysis 💰💰
📊 #SOL is making perfect and huge rounding bottom pattern in daily time frame, indicating a potential bullish move. If #SOL retests little bit and breakout the pattern with high volume then we will get a bullish move📈
🔖 Current Price: $173.75
⏳ Target Price: $204.00
⁉️ What to do?
- We have marked crucial levels in the chart . We can trade according to the chart and make some profits. 🚀💸
#SOL #Cryptocurrency #Pump #DYOR
SOL - Excellent Trade Opportunity- Trade is giving us a trade with huge potential with huge risk reward ratio.
- Currently price is heading towards teh support around 160 range and this is strong support zone.
- I'm expecting price to bounce back from this zone and head towards the next target of 200 range
Entry Price: 163
StopLoss: 148
TP1: 172
TP2: 182
TP3: 200
Stay tuned for more updates.
Cheers
GreenCrypto

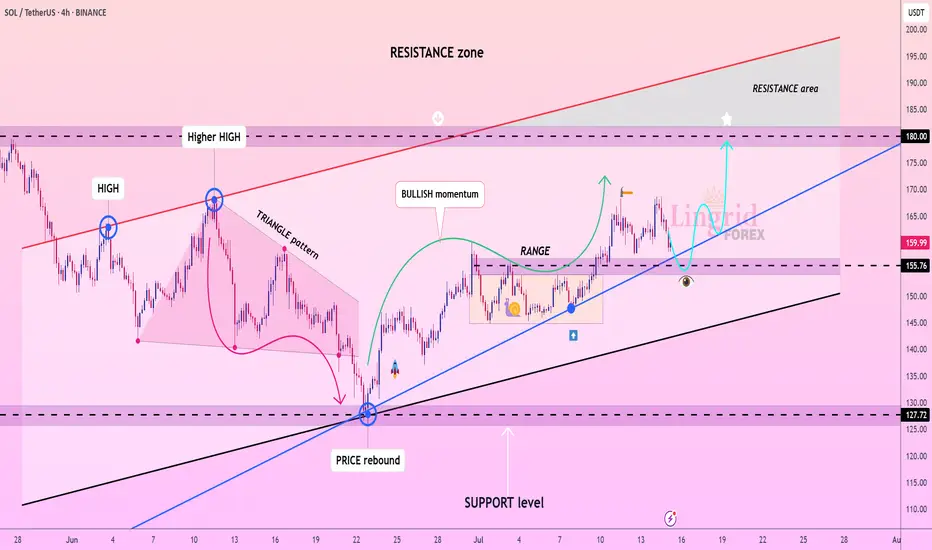
Lingrid | SOLUSDT trend Continuation TradeThe price perfectly fulfilled my previous idea . BINANCE:SOLUSDT found strong support around the 155.7 level after a brief pullback and continues to respect the ascending blue trendline. The previous bullish impulse followed by a healthy consolidation suggests a classic trend continuation structure. If buyers defend the current demand zone and reclaim upward momentum, a move toward the 180 resistance zone is likely. This setup aligns with broader bullish market structure and rising channel dynamics.
📉 Key Levels
Buy trigger: confirmed bounce from 155.7 trendline support
Buy zone: 155.7–158.0 (range floor and trendline confluence)
Target: 180.0
Invalidation: breakdown below 155.0 signals structure shift
💡 Risks
Volatility around trendline retest could trigger stop hunts
Failure to reclaim momentum above 165 may lead to ranging
Sudden market-wide weakness could pressure altcoins broadly
If this idea resonates with you or you have your own opinion, traders, hit the comments. I’m excited to read your thoughts!
Solana - The Cup is Almost FullSolana is printing a textbook cup & handle formation on the daily, and price is now pressing against the neckline resistance near $185, just below the psychological $200 zone.
This structure reflects months of accumulation and rising momentum. A confirmed breakout above the $185–$199 resistance would likely trigger the next upward leg.
This setup signals trend reversal continuation, and if SOL closes above $199 on high volume, momentum traders may pile in quickly.
📌 Invalidation below $150 = pattern risk-off.

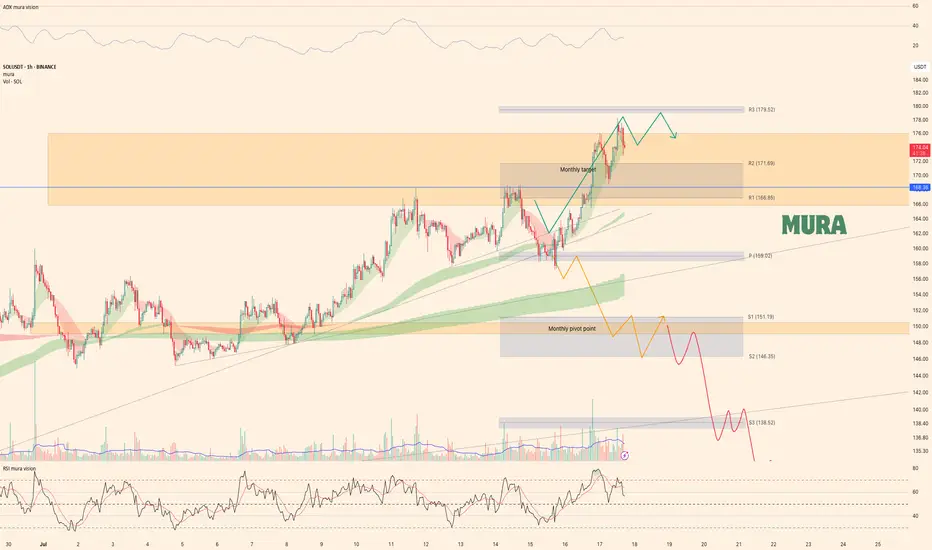
Solana - Weekly Technical UpdatePrice Action Summary:
Successfully met our weekly expectations following a minor correction
Broke both local trendlines and the weekly pivot point
Reclaimed position above weekly pivot during the bullish MA crossover (optimal long entry per plan)
Currently trading slightly above second monthly target at $175.9
Third weekly target remains active while price holds above $168.3
Technical Observations:
1 Momentum Warning Signs:
Trend weakening (declining ADX)
Bearish RSI divergence forming
2 Key Levels:
Upside: Weekly target continuation above $168.3
Downside: Potential correction if divergence confirms
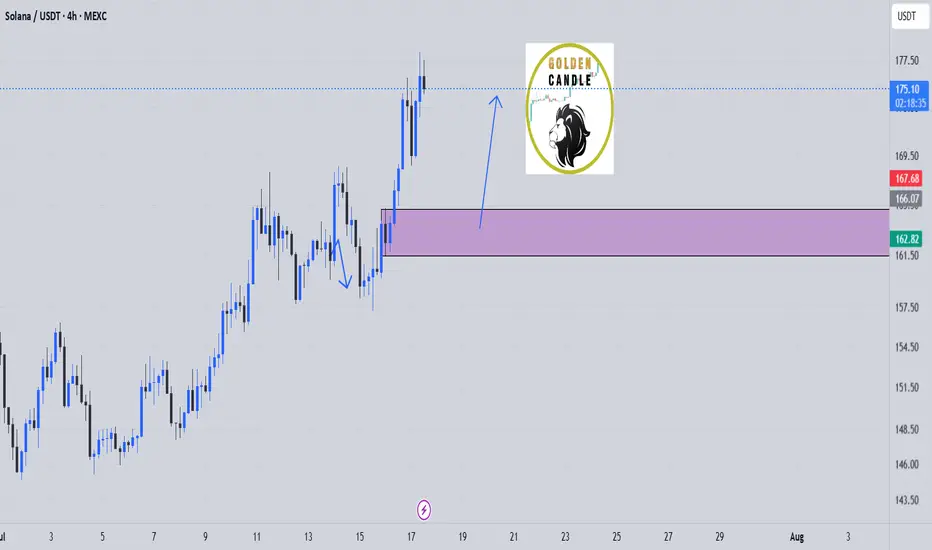
sol buy midterm"🌟 Welcome to Golden Candle! 🌟
We're a team of 📈 passionate traders 📉 who love sharing our 🔍 technical analysis insights 🔎 with the TradingView community. 🌎
Our goal is to provide 💡 valuable perspectives 💡 on market trends and patterns, but 🚫 please note that our analyses are not intended as buy or sell recommendations. 🚫
Instead, they reflect our own 💭 personal attitudes and thoughts. 💭
Follow along and 📚 learn 📚 from our analyses! 📊💡"