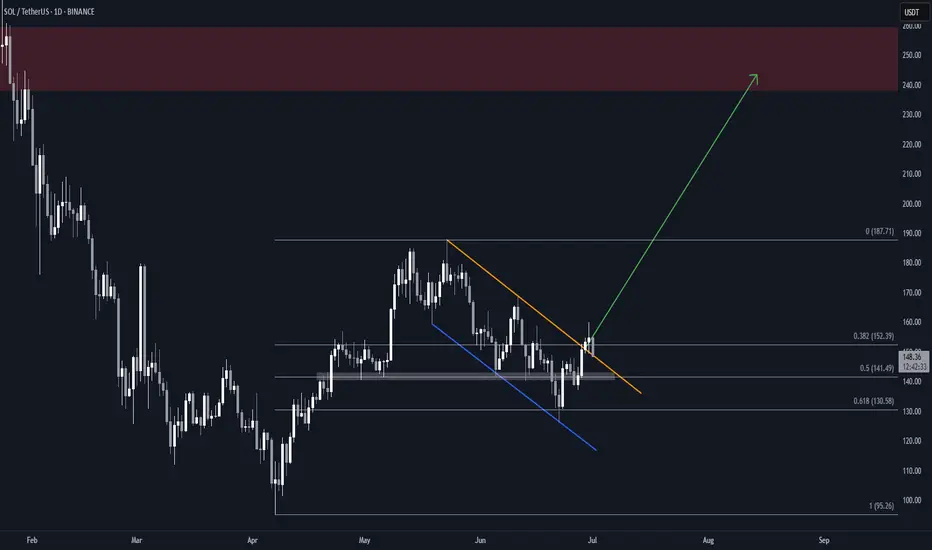
Solana (SOL) Flag & Pole Breakout (1D)BINANCE:SOLUSDT broke out of a textbook falling wedge two days ago, and is now retesting the former resistance as support.
Key Technicals
• Falling channel with clean structure and multiple touches
• Resistance trendline broken
• Price now retesting the breakout zone (~$148)
• Overhead supply zone at $238–$260
• Measured Target: $240, within supply
Why This Setup Matters
• Clear breakout followed by a retest, which can often precede the next leg up if support holds
• Falling channel retracement aligns with 0.618 Fib, a common reversal area
What to Watch
• Daily close above the previous resistance trendline
• Push above the local $160 high for full confirmation
SOLUSDT trade ideas
DeGRAM | SOLUSD retest of the 136 level📊 Technical Analysis
● Price bounced at 136 where the rising-channel base meets a long-held internal trend-line, locking in a higher-low and printing bullish RSI divergence.
● A micro falling-wedge is fading; clearance of the wedge roof/150 round turns bias up toward the 158.8 horizontal pivot and the channel mid-band near 187.4.
💡 Fundamental Analysis
● Solana’s daily active wallets and DEX volume have risen ~20 % since 20 Jun as new DeFi incentive programs (Jupiter, Pyth, Kamino) go live, hinting at returning user demand despite broader crypto lethargy.
Summary
Buy 137-145; confirmed break above 150 targets 158.8 → 187.4. Long thesis voided on a 16 h close below 130.
-------------------
Share your opinion in the comments and support the idea with a like. Thanks for your support!

Your SOUL is for SOLSO SOL looks very nice to cruise up as stated earlier, targets for 161 can be seen!

SOLANA → BINANCE:SOLUSDT.P is consolidating after breaking through trend resistance. The market trigger is 148.0, and Bitcoin is provoking the market to recover...
The market is buying back all the losses. SOL breaks the local downward resistance and forms consolidation with a trigger of 148.0. The market has come to life following the rallying Bitcoin. If the general trend continues, SOL may break out of the accumulation zone and form a distribution towards 154.0
The latest retest of resistance is provoking a correction. Before rising, the price may test the zone of interest at 144 or the lower boundary of consolidation at 142.2. The ideal scenario would be a false breakdown of support at 142.2 before rising.
Resistance levels: 148.0, 154.2
Support levels: 142.2, 137.5
Fundamentally, the situation for the crypto market is improving. Technically, the market is also showing positive dynamics. SOL is consolidating after growth, which is generally a positive sign. Now we need to wait for the price to break out of consolidation and continue its growth. One of the signs of this is a rebound from the 0.5 range and a quick retest of resistance with a gradual squeeze towards the trigger.
Best regards, R. Linda!

Solana (SOL): Aiming For $200 | June 2025Solana coin is still showing some kind of buyside dominance, where we are keeping close attention at 100 and 200 EMA on a 4-hour timeframe.
More in-depth info is in the video—enjoy!
Swallow Academy

The price can reach $160-170 and then drop to $80-90.The price can reach $160-170 and then drop to $80-90.
If you want to invest, this is not a good place to enter.
It is a downtrend.
Please do not buy on the downtrend.
you must think to Short in downtrends.
Let it go lower and buy when change to bullish.

Weekly trading plan for Solana Last week, BINANCE:SOLUSDT price followed our bullish (green) scenario perfectly and hit the first target. At this point, the upward corrective phase may be complete, so we could reasonably expect a pullback to either the weekly pivot point or support zone
Write a comment with your coins & hit the like button and I will make an analysis for you
The author's opinion may differ from yours,
Consider your risks.
Wish you successful trades ! mura

Solana (SOL): Good Possibility That We Will Move Towards $200Solana is showing strong signs of possible movement to upper zones, which would give us a chance to go towards the $200 area.
More in-depth info is in the video—enjoy!
Swallow Academy

Analisis SOLANA🔍 SOL/USDT Technical Analysis (4H)
📆 June 30, 2025
📈 Binance | 4-Hour Chart
📊 Current Context:
Solana (SOL) is currently trading around $150, consolidating within a sideways range after a prolonged corrective phase. Price action has reacted several times around key horizontal resistance levels and Fibonacci retracements, indicating a strong battle between buyers and sellers at this zone.
📍 Key Technical Levels:
$144.94: Critical support level that has served as a base multiple times since May.
$152.49 – $160.03: Immediate resistance zone. Price has been rejected here several times and is currently retesting from below.
$179.77: Major resistance ahead, aligning with the 200-day moving average and a strong psychological barrier.
$128.39: Key lower support in case of a bearish breakdown.
📐 Additional Technical Insights:
Price action is developing within an emerging bullish channel since the May lows.
Fibonacci extensions project a potential target around $300 if SOL can break and hold above $180, a move that would likely require strong volume and external catalysts (such as the already-approved SOL ETF).
Volume remains steady, with no signs of capitulation or clear institutional accumulation in this timeframe yet.
📌 Conclusion:
SOL is showing accumulation patterns, pressing against increasingly tight resistance zones. A confirmed breakout above $160 could open the door to the $180–$190 range, a key technical target supported by confluences such as the 200-SMA, prior structure, and psychological relevance.
Meanwhile, $145 and $128 remain critical support levels to watch in case of bearish rejection. The upcoming launch of the SOL ETF could act as a major catalyst, but the market is still waiting for a technical confirmation.

Is SOLANA SOL Ready for a Breakout? Bounce from Falling Channel?
🔍 Chart Pattern and Price Structure Analysis
This chart illustrates a well-formed descending channel (parallel falling channel) that has been developing since mid-January 2025. Currently, the price is approaching the upper boundary of this channel — a key decision area.
🟡 Technical Pattern
Descending Channel: This pattern is characterized by a series of lower highs and lower lows, representing a medium-term bearish trend.
The price is now testing the upper resistance of this channel, a crucial point that could either trigger a breakout or result in another rejection.
📈 Bullish Scenario
If the price successfully breaks out above the upper trendline (around $152–$154), several resistance targets come into play:
1. $164.5 — A minor horizontal resistance and key psychological level.
2. $182.2 — A strong historical resistance zone.
3. $210–$217.8 — A previous consolidation/resistance zone.
4. $237.7, then $261–$280 — Key bullish targets if momentum sustains.
5. Ultimate target near $295.1–$295.7 if broader market sentiment remains strong.
📌 Bullish Confirmation:
Valid daily candle breakout above the channel.
Strong breakout volume.
Successful retest of the breakout area as new support.
📉 Bearish Scenario
If the price fails to break above the channel and gets rejected, we may see a continuation of the downtrend with potential moves to these support levels:
1. $140–$138 — Current minor support zone.
2. $128 — Recent consolidation support.
3. $115.5 — Major support from April.
4. $95.2 — The lowest support zone on the chart.
📌 Bearish Confirmation:
Strong rejection candle (e.g., bearish engulfing) from upper channel.
Weak breakout attempt with declining volume.
Break below the lower channel support or creation of a new lower low.
📊 Conclusion
The current setup is a classic descending channel, indicating a strong mid-term bearish structure.
Price is now at a make-or-break zone — a breakout could signal a trend reversal, while a rejection could extend the current downtrend.
Traders should wait for a confirmed breakout or clear rejection before entering a position.
#SOLUSDT #Solana #CryptoAnalysis #TechnicalAnalysis #DescendingChannel #BreakoutAlert #CryptoTrading #BullishScenario #BearishScenario #Altcoins #CryptoTA

$420 Solana Within 2 Months —TargetsSolana is on a path to a hit a price target of $420 mid-term, within 1-3 months. This is the continuation of the uptrend that started in early April with the end of the previous correction and a more than a year long strong low.
This is not for the faint of heart. Solana is preparing for something massive, even scary but positive. $600+ is also possible but we are going step by step and $420 is the first step.
Immediately when prices start to rise Solana is likely to find resistance around $220 and $253.
The last high, January 2025, would be the minimum on this bullish wave. This would be price tag of $296.
The end of the retrace happened 22-June. This means that the market is already bullish for an entire week. Bitcoin is about to produce the best possible weekly close. As Bitcoin is ultra-bullish above $106,000/$107,000, the altcoins can continue to recover and will aim higher trying to catch up. Of course, no altcoin can catch up to Bitcoin but invariably the entire market will grow.
The wait is over, we are bullish now. Timing is great.
Bullish momentum will grow for weeks and then a major force will permeate the market, something not seen in many years. I hope you are prepared.
Namaste.

SOLANA ABOUT TO EXPLODE?CRYPTOCAP:SOL just broke out and is surging within a long-term bullish channel
Price action is clean, momentum is strong, and if this channel holds — we might be eyeing $700+ in the next run.
This is not the time to ignore Solana.
Chart says it all.
DYOR. Stay sharp.

sol usdt pattern identified inverse head and shoulders with chan🧠 Technical Analysis (SOL/USDT – 4H Timeframe)
🔍 Pattern Identified: Inverse Head & Shoulders
Left Shoulder: Around $137
Head: Dipped to ~$126
Right Shoulder: Formed around $135
Neckline Breakout: Successfully broken near $148–$150 zone
This classic bullish reversal pattern indicates a potential trend shift from bearish to bullish.
📈 Trend & Channel
The price was previously trading inside a descending parallel channel (marked in yellow).
The breakout from the upper channel boundary confirms strength and momentum shift.
🚀 Price Targets (Resistance Levels Ahead):
$158.36 – First resistance level (short-term target)
$168.52 – Mid-level resistance (medium-term)
$187.56 – Key resistance (long-term target area)
✅ Bullish Confirmation:
Breakout with volume from both descending channel and head & shoulders neckline
Price holding above neckline now acting as support
⚠️ Risk Note:
A retest of the breakout zone ($148–$150) can occur before moving higher
Invalid if SOL drops back below neckline and fails to hold above $145 support zone

SolusdtIn daily chart S_WAVE DONE NOW CAN move TO N_WAVE and in the weekly price so far from kumo so price can Checking kumo in weekly chart

Solana (SOL): Gameplan Remains The Same | Aiming at $100 Solana's game gameplan has not changed for us, where we are still looking for that downward movement to form a proper support zone near the psychological area at $100.
More in-depth info is in the video—enjoy!
Swallow Academy

SOL Long Idea Going Pretty WellTime Frame - D
Confluences
Turtle Soup
EOB
Breaker Block Confirmation
Retest of EOB
I am targetting atleast 158. Ideal entry was around 142.
#NFA, #DYOR

SOLUSDTSOL has been trending below the trend line for more than 162 days. It is reaching local low and my plan is to trade the breakout. If 127$ local low gets taken then we might see 110$. Lets see how it plays out.
Note: It is not a financial advise. Please DYOR

SOL/USDT 15-minute high win scalping signals are as follows:- Signal: LONG
- Entry: 147.800 ~ 148.400
- Take Profit: 149.800, 151.300

SOL Fractal long-term set up: 100% upside📈 SOL/USDT Long-Term Setup: Potential for 100%+ Upside or 16% Downside
This chart presents a Fibonacci-based technical outlook on Solana (SOL/USDT) on the daily timeframe.
🔍 Key Highlights:
Current price: $150.65
Major resistance zones: $177.12, $183.22, and $199.05
Fibonacci retracement levels (from $294.75 high):
0.618 at $171.32
0.5 at $200.08
0.382 at $222.42
Strong support at $137.97, $131.16, and $122.56
Downside risk to $126.99 (0.886 Fib) or even $105.40 (1 Fib)
Bullish target: $301.64 (+105.25%)
Bearish scenario: $126.99 or lower (-16.53%)
📊 The chart includes harmonic structures and descending/ascending channels suggesting consolidation, but the current structure could pivot into a bullish continuation if key resistances are broken.
🎯 Risk-to-Reward Ratio Favorable for Bulls: The setup offers a potential 105% upside against a 16% downside, making it attractive for medium- to long-term traders.
⚠️ As always, manage your risk appropriately and consider macroeconomic factors.

solana crazy ideaWell, I made this silly little chart for myself. I kind of expect it to follow the pattern of some bots running on Solana, at least within the range I’ve marked. But hey, it’s a bull market, and sometimes even random drawings by amateurs like me end up working out!
That said, I'm keeping my target modest — not expecting anything crazy. Stop loss depends on how Bitcoin behaves, and honestly, I wouldn’t recommend anyone follow what I’m doing. This is not investment advice, just a ridiculous idea I had.

SOL/USDT Short Setup – Targeting Range LowContext:
Price just rejected off local range high near $148 — a key resistance that has held several times historically. We’re seeing initial signs of weakness after a strong rally, with price failing to hold above resistance and beginning to break minor structure.
Setup Details:
Entry: ~$146.20
Stop Loss: ~$148.35 (above recent high)
Target: ~$141.00 (range low + demand pocket)
Risk/Reward: ~2.38R
Trade Idea:
This is a classic range play — short from top of the range, targeting the base. Momentum is fading near resistance and we have a clean invalidation just above. Price structure suggests lower highs are forming, and any further weakness should push us back into the mid-to-lower part of the range.

NothingThe SOL will increase $150 and reach to the top of the wedge in the coming weeks .
Best regards CobraVanguard.💚

Buy limit 146.60 TiqGPT buy signalAnalyzing the SOL/USDT across multiple timeframes, we observe a consistent upward momentum, particularly evident in the shorter timeframes (1H, 15M, 5M, and 1M). The 1D and 4H charts show a recent recovery from a downward trend, indicating a potential shift in market sentiment or a retracement phase.
1D Chart: The daily chart shows a series of bearish and bullish candles with recent bullish activity suggesting a potential reversal or pullback from previous lows.
4H Chart: This timeframe shows more granularity in the recovery, highlighting a resistance-turned-support level around $142, which has been retested and held as support.
1H Chart: A strong bullish impulse is visible, breaking past previous minor highs, suggesting an increase in buying pressure.
15M Chart: This chart shows a continuation of the bullish momentum with higher highs and higher lows, a classic sign of an uptrend.
5M and 1M Charts: Both these timeframes show detailed price action within the bullish trend, with the 5M chart beginning to form a pullback.
