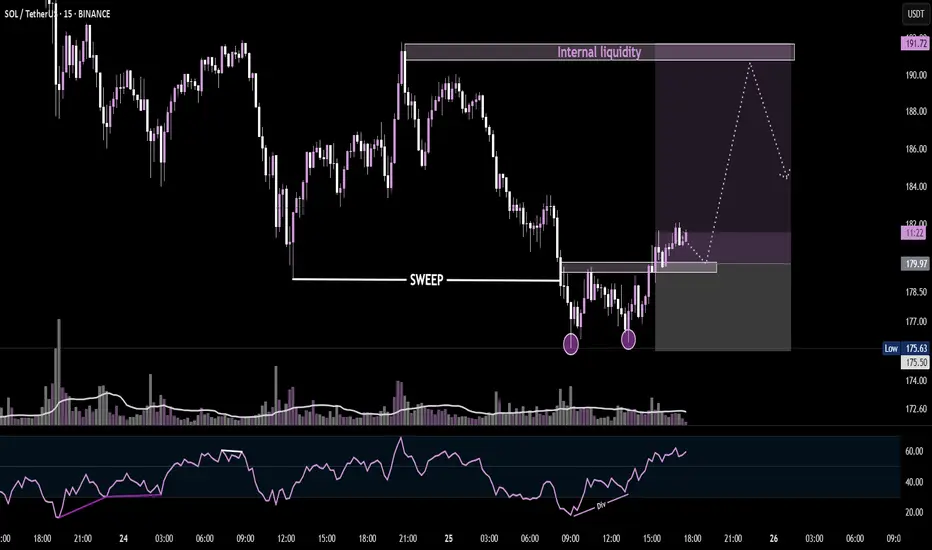
SOL/USDT - 15MINrice swept previous lows, formed a double bottom with bullish RSI divergence, and is now consolidating above the sweep zone. If support holds, we may see a rally into the internal liquidity zone around $191. Keep an eye on structure and volume confirmation for the next leg up.
SOLUSDT trade ideas
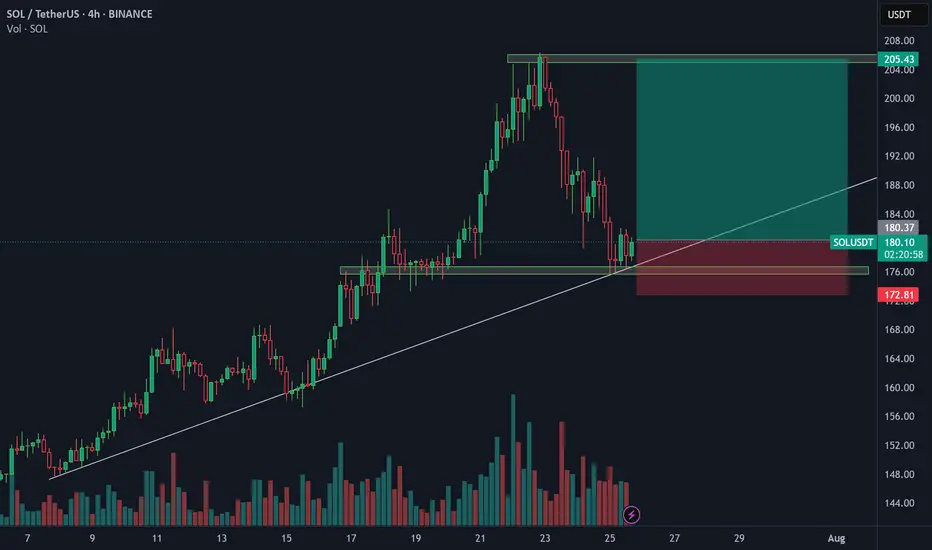
SOL LONGSolana is bouncing off the support level and the ascending trendline. Bullish movement is expected to continue and reach $205
Solana is undervalued | New ATH coming very soon | $250++Solana is slowly but surely grinding up, following the altcoin king ETH. ETH is already near its 2024 highs of $4000. If SOL were to be in the same position as ETH in terms of price, we should be around $250.
In technical terms, SOL is showing huge bullish strength at the $180 resistance. In the last attempt in breaking above this level, it faced multiple rejections and consolidated before ultimately backing down. This time, there is little to no resistance.
The REX-Osprey SOL staking ETF continues to garner inflows, having only one outflow day since the launch date 2nd July. That's nearly $100 million net inflows and 11 inflow days out of 12 trading days. Imagine the demand the spot SOL ETF by big players such as VanEck, Grayscale and Fidelity will have once approved.
BTC dominance is breaking below 60%. Capital is flowing from BTC into ETH, and once ETH hits $4000, a good amount will flow from ETH to SOL as people look for better potential gains.

SOL LONG POSITIONLooking for a long position off the bottom of this upward trendline, Trend continuation trade.

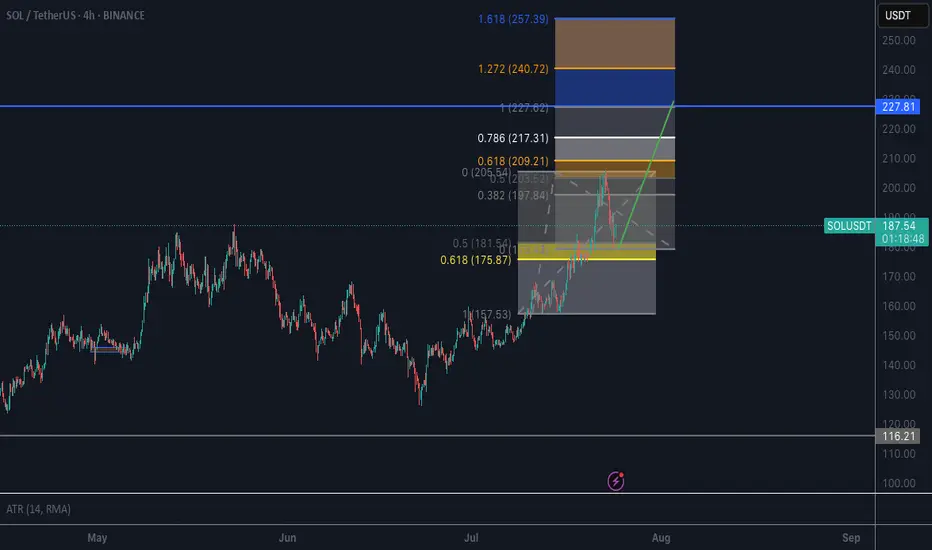
SOL Uptrend Update➡️ Solana has been correcting for the last couple of days, but the trend is clearly up.
➡️ There are 2 confluence factors that should give price support: the gray ascending trendline and the green zone.
➡️ Initial Targets (purple lines) are:
218.45 (100% extension)
258.79 (beginning of blue potential supply zone)

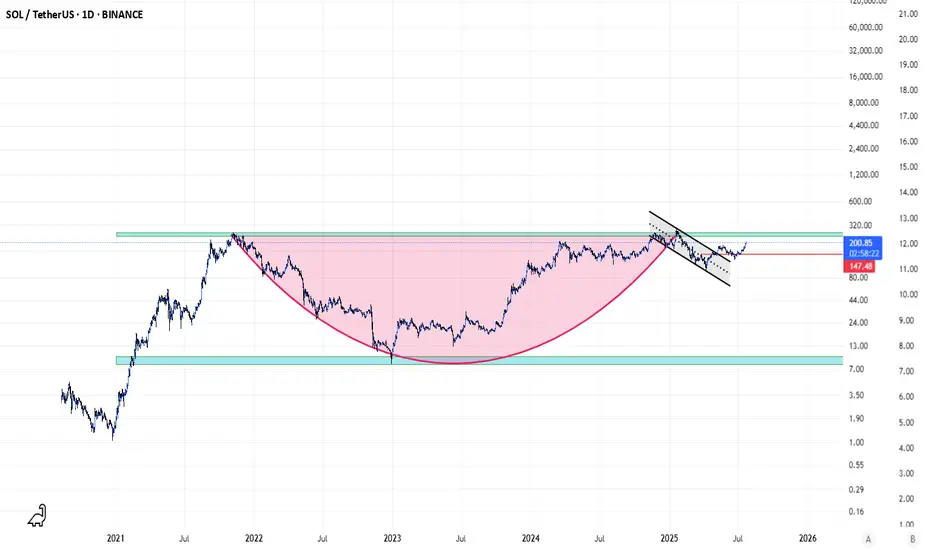
SOL/USDT.dSuch a beautiful mega structure! Price is reacting accordingly. Nice time to get in. Price will move hard once it goes beyond the neckline. Enjoy!
SOL Analysis (3D)There is no need to explain why if you are in this market for a while.
A weekly candle close above $186 will ignite a rally on SOL.
The important key word in here is "weekly" , not "daily" .
Good Luck.
TradeCityPro | SOL Holds PRZ as Bulls Eye Range Breakout👋 Welcome to TradeCity Pro!
In this analysis, I want to review the SOL coin for you. This is one of the popular Layer1 projects, nicknamed the “Ethereum killer,” with a market cap of $85 billion, currently ranked 6 on CoinMarketCap.
📅 Weekly timeframe
In the weekly timeframe, after the bankruptcy news related to FTX, this coin had a very sharp bearish move and even dropped to as low as 9.84, but it managed to recover afterward.
⭐ From the key top at 27.62, a very strong bullish move started, reaching up to 255.96 and retesting its previous ATH.
📊 Currently, a range box has formed between the 128.66 and 255.96 levels, where the bottom of this box is a very strong PRZ, created from the overlap of a major support zone and the area between the 0.236 and 0.382 Fibonacci levels.
🔍 Also, the price is being supported by the SMA99, which has supported the price twice so far and has prevented the box from breaking to the downside.
⚡️ If you have already bought SOL, you can set your stop-loss if the price closes below this area. A confirmed breakdown could lead to deep corrections toward lower Fibonacci levels.
🛒 For buying this coin, the first trigger is the break of 178.22, which is a bit riskier but offers a good price entry. On the other hand, if the price revisits 128.66 and gives confirmation, we can enter from there.
📈 However, the main trigger for spot entry is the breakout of the 255.96 top. Breaking this level can unlock some very ambitious targets. If that happens, I’ll definitely update the analysis and provide those targets.
📅 Daily timeframe
In this timeframe, we can see the price action in more detail. A small range box has formed between 144.11 and 164.74, and the price is currently stuck below the top of the box and reacting to it.
✨ If 164.74 breaks, we can enter a long position. The next major resistance is 183.54. A breakout above that will serve as the main confirmation for a long position targeting 255.96, which can also be used as a spot trigger.
💥 The RSI oscillator is now above the 50 zone, and if it enters the Overbuy area, it will serve as strong momentum confirmation for this position.
✅ If the price gets rejected from the top, we can also open short positions on lower timeframes. A break below 144.11 will be the main short trigger.
📝 Final Thoughts
This analysis reflects our opinions and is not financial advice.
Share your thoughts in the comments, and don’t forget to share this analysis with your friends! ❤️

Solana is preparing to breakthrough $200 ┆ HolderStatOKX:SOLUSDT is trapped between $172 and $180. Break above $180 may unlock $188+. Watch for volume breakout.
DeGRAM | SOLUSD seeks to the $220 level📊 Technical Analysis
● After reclaiming the mid-June swing cap 185 (now support) price accelerated along a steep parabolic fan; the move completed a 1:1 extension of the early-July flag yet leaves room to the channel crest near 220.
● Structure shows successive closes above the March–July internal resistance line; momentum pull-backs are respecting the fan base at 190, indicating healthy trend continuation toward the next fib / rail confluence at 219-222.
💡 Fundamental Analysis
● FXStreet notes Solana’s daily active addresses just hit a 12-month high, while CoinShares reports a fourth straight week of SOL-focused ETP inflows—evidence of strengthening network use and institutional demand.
✨ Summary
Buy 190-195; hold above 185 eyes 205 ▶ 220. Long thesis void on a 16 h close below 175.
-------------------
Share your opinion in the comments and support the idea with a like. Thanks for your support!
SOLUSDT on Fire! Bullish Wedge Fuels INSANE Upside Potential!BINANCE:SOLUSDT has been exhibiting strong bullish momentum, currently trading within a broadening wedge pattern. This technical structure often signals increased volatility and the potential for decisive moves in either direction. In the present scenario, the breakout above the psychological $200 resistance level suggests that bulls are firmly in control, fueling hopes of further upside.
The continuation of momentum hints at the market preparing for another leg up. The immediate price target lies at $300, where traders may expect some profit-taking and resistance. However, should momentum sustain and buying pressure persist, BINANCE:SOLUSDT has the potential to surge toward the $700 region, aligning with the pattern’s projected price expansion.
As always, managing risk is key. Use a well-placed stop loss below the support level to protect your capital. Breakouts can be explosive, but discipline and proper risk management make all the difference.
BINANCE:SOLUSDT Currently trading at $201
Buy level : Above $200
Stop loss : Below $150
Target 1: $250
Target 2: $300
Target 3: $500
Target 4: $700
Max leverage 2x
Always keep stop loss
Follow Our Tradingview Account for More Technical Analysis Updates, | Like, Share and Comment Your thoughts

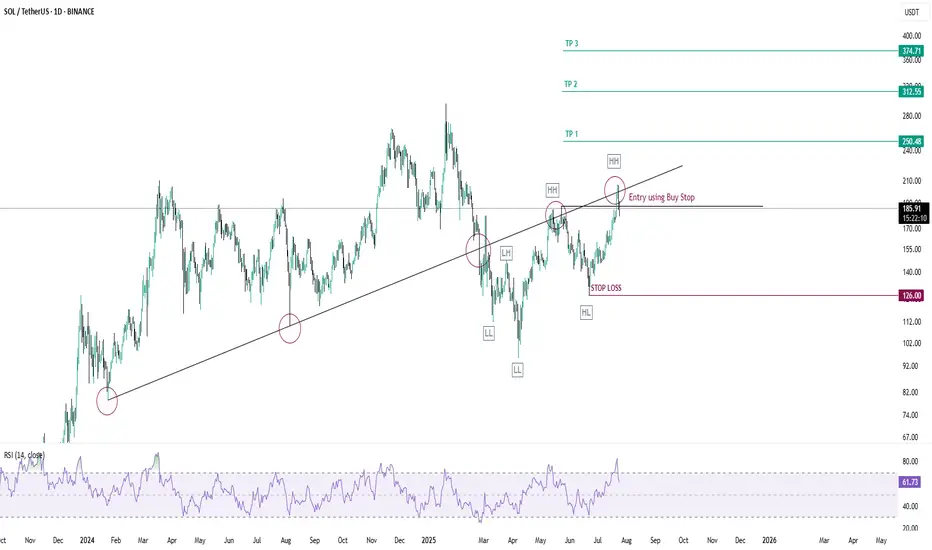
SOLUSDT-LONG IDEASOLUSDT has broken its trendline toward downside and now the structure is broken forming a higher highs and higher lows and reason behind its rejection is trendline but the structure is clearly bullish, trendline has gotten tapped two time now it has become weak take your entries using buy stop order it will give you great return again its a positional trade so if you have patience only then take this trade it will not gonna boom overnight stop loss entry and take profit points are mentioned in the chart.
Solana is bouncing back from $175 ┆ HolderStatOKX:SOLUSDT is testing the $180 barrier. Breakout could extend gains to $186. If rejected, $172–$173 may act as reentry zone. Market structure favors continuation.
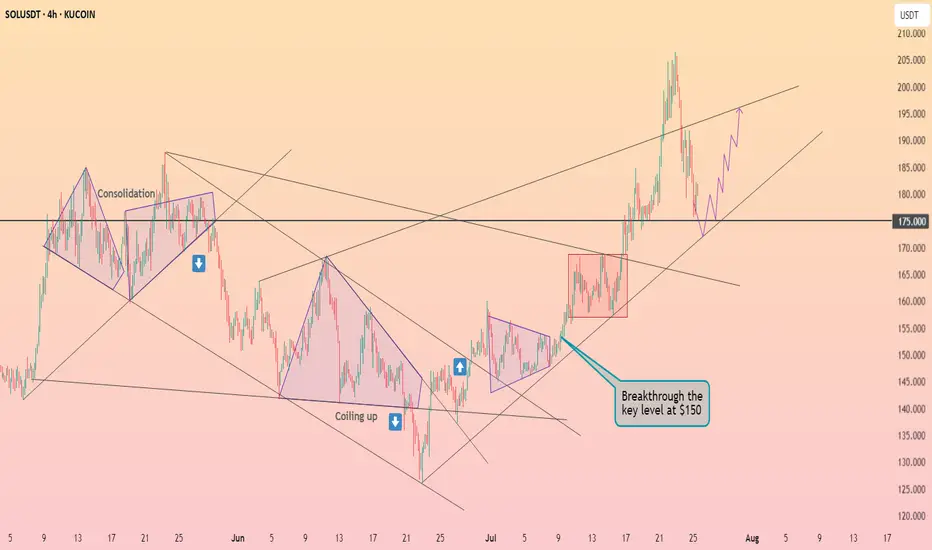
SOLUSDTThis signal for bull-trend because breaked trendline and higher high higher low.
best entry: 154
stop: 136
traget: 226
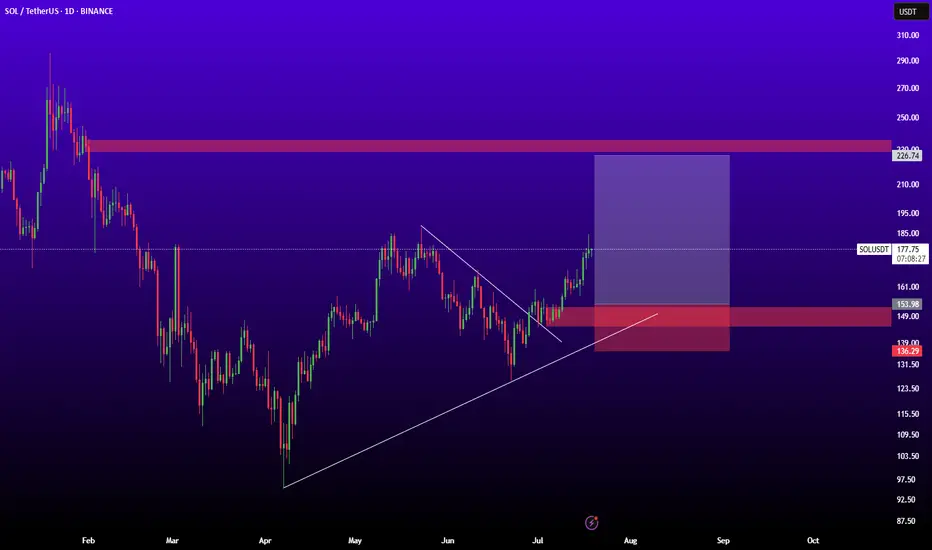
Solana Price Faces Reversal At $200 As Profits Hit 5-Month HighBINANCE:SOLUSDT price has risen 21% in the past week , now trading at $199. Despite breaching the $200 mark, Solana has failed to maintain this level, marking a five-month high.
The Net Unrealized Profit/Loss (NUPL) indicator for BINANCE:SOLUSDT shows that profits have reached a five-month high . This signals that many investors are in profit, raising concerns about a potential sell-off.
If these factors hold true, BINANCE:SOLUSDT price could decline toward the support levels of $188 or even drop to $176 . A move below these levels could erase a significant portion of the recent gains and shift the altcoin into a bearish trend.
However, if investor confidence remains strong and the market continues to show bullish signs, BINANCE:SOLUSDT could stabilize above $200 . Securing this level as support could propel the price back toward $221, invalidating the bearish outlook.
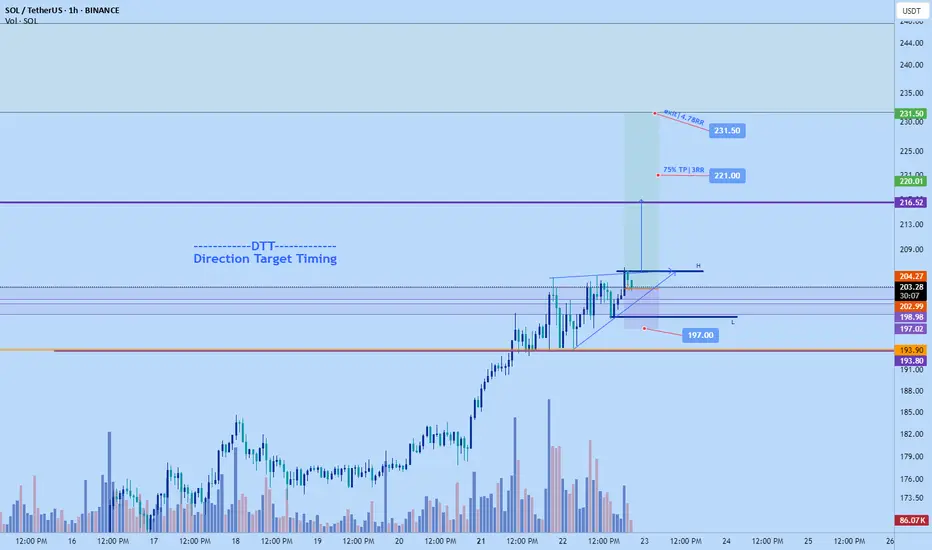
Swapped ETH for Sol long to $231.5Just abandoned the eth ship after holding it for a few days. Its price action is looking up but exited close to BE.
Solana on the other hand price action has been more positive and actually cleaner with less resistance ahead on higher timeframe compared to ethereum. In fact if all goes according to plan am expecting solana to start pushing for the $220 area tonight.
Stop is placed below 4hr HL structure at $197. Playing it conservative.
Market has free space to move into until $216.5 area thats why I have an alert there to monitor given all goes well as price could start reacting there.
I didn't go for a very precise entry. Rather I prioritize the fact that the market is at a daily prior resistance area which can provide quite a bit of support and my stop is below that area..so market has to break 4hr structure HL plus daily support to get to stop- decent protection and still can get a potential 3-5 RR which is great.
Time sensitive
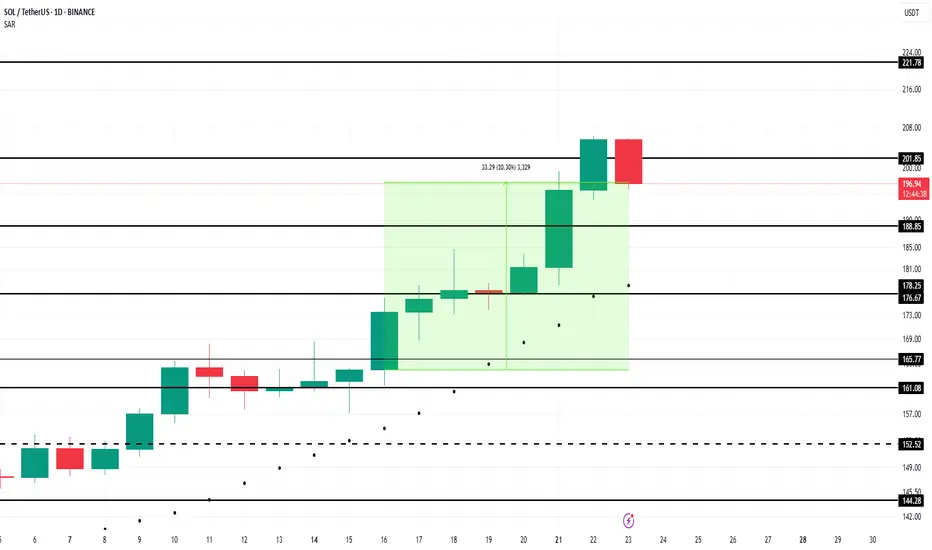
SO LONG : Next Target $220 ZoneSOL price successfully broke above the 200 resistance zone.
Trend bias is upwards currently with the next projected resistance around 225 USD
Analysis Of SOLUSDT
Why buy? market still on the bullish side this analysis is based by technical of SMC (OB,FGV) and Fibonaci
Stay Safu

Weekly trading plan for Solana Price Action Summary
SOL perfectly followed our bullish scenario, achieving all projected targets.
Price has now entered our predefined zone.
Avoid shorting in discovery mode—momentum remains unpredictable.
Key Technical Observations
Caution Signals:
Overbought RSI on higher timeframes
Bearish divergence on the hourly chart
Elevated volume + weak upward momentum → Potential institutional distribution
Critical Levels to Watch
1 Local Trendline (5-min chart):
Break below → Likely correction toward weekly pivot
Hold → Extended discovery possible
2 Weekly Pivot:
Primary downside target if trendline fails

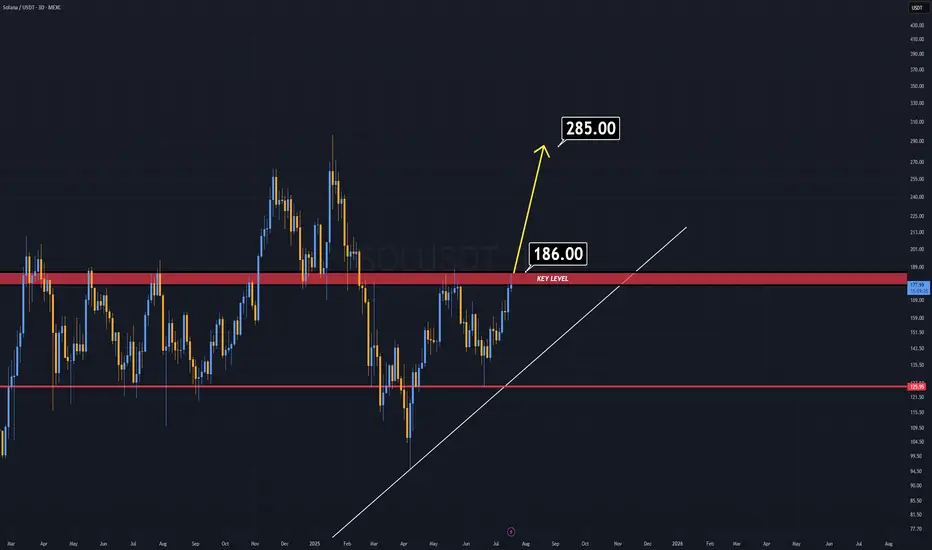
Solana at $189 Now… $295 Might Just Be Days AwaySolana (SOL) on the 3-day chart is showing strong bullish structure after bottoming out near the $95–$110 demand zone. The price has formed a series of higher lows following a prolonged downtrend from the $295 top earlier this year. After reclaiming support levels and confirming demand zones twice (marked with blue "B" signals), SOL is now heading toward key resistance with bullish momentum.
The price also broke above the short-term lower high structure and is consolidating above $189, hinting that bulls are preparing for a leg higher. The red "S" markers at ~$210 indicate past sell zones — and reclaiming this level will likely open the path for a much larger bullish continuation. This move is technically supported by multiple rejections of the $140–150 zone in the past, which now acts as a solid base.
With momentum shifting in favor of buyers and a clean structure in place, here's the bullish trade setup:
________________________________________
📊 Trading Setup (Bullish)
• 📥 Entry: Around $189.45 (current breakout zone)
• 🛡️ Stop-Loss: $140.05 (below last bullish pivot)
• 🎯 Take-Profit (Target): $295.83 (major historical resistance)
• ⚖️ Risk-to-Reward: ~2.16 (healthy R:R with 56% upside potential)
________________________________________
The target of $295.83 is justified not only by price history but also by the structure of the current recovery phase — a move from $95 to $210 followed by a minor retracement, forming a potential rounded reversal pattern. If price breaks above $210 cleanly, momentum traders are likely to enter aggressively, pushing toward $250–295 range.
The stop-loss at $140 is strategically placed just below the last accumulation zone, and protecting against deep pullbacks that would invalidate the bullish sequence.
📈 As long as SOL holds above $180 and continues forming higher lows, the chart remains bullish with $295 as a technically valid target over the next several weeks.


Solana starting to look bullish again | Target $180 - $260In my previous idea, I anticipated a liquidity hunt below the $140 level, and price action played out exactly as expected. SOL wicked below this key support zone, triggering stop-losses and inducing panic selling — classic behavior before a major reversal. Following this sweep, price quickly reclaimed the range, breaking out of the downward channel, and is now retesting a bullish break of a textbook cup-and-handle pattern, signaling a potential trend continuation to the upside.
📊 Technical Setup
Cup and Handle formation is evident, with the "handle" forming as a downward-sloping channel now being challenged.
Price reclaimed the $140 demand zone post-sweep and is now retesting.
Target zones: $180 → $220 → $260 based on historical resistance levels and measured move projections.
📉 Invalidation Level
A daily close below $120 (marked as the Invalidation Zone) would invalidate this setup and suggest bulls have lost control.
🌐 Macro Perspective
Fed Rate Cut anticipation and cooling inflation data are helping risk-on assets like crypto regain momentum.
SOL staking ETF launching this week, while SOL spot ETF approval imminent.
Solana's growing DeFi ecosystem, along with high TPS performance and low fees, continues to attract developer and user activity. SOL remains a top candidate for sector outperformance in a bullish H2 crypto cycle.
📌 Conclusion
With market structure turning favorable and strong macro tailwinds, SOL may be gearing up for a major breakout rally. Watch the $160 level closely — a decisive break and hold above could confirm the next leg higher.

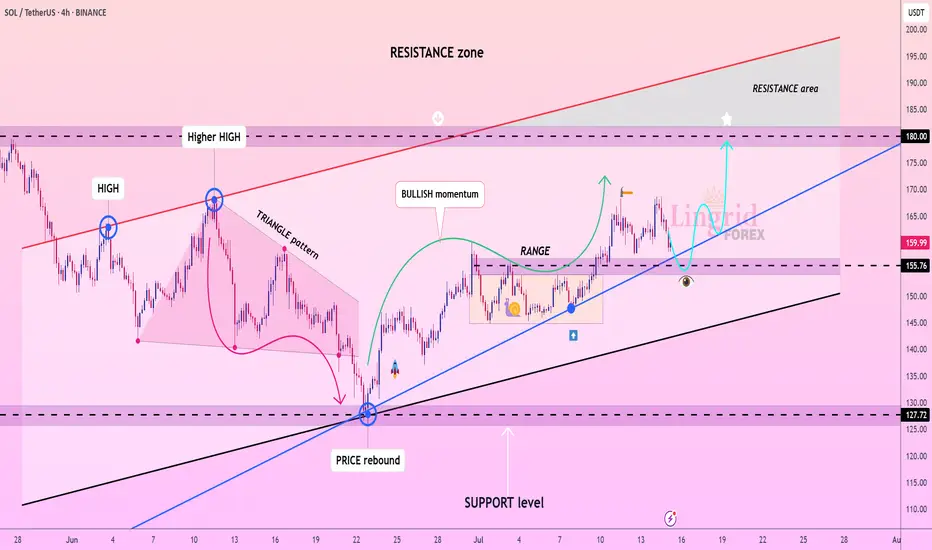
Lingrid | SOLUSDT trend Continuation TradeThe price perfectly fulfilled my previous idea . BINANCE:SOLUSDT found strong support around the 155.7 level after a brief pullback and continues to respect the ascending blue trendline. The previous bullish impulse followed by a healthy consolidation suggests a classic trend continuation structure. If buyers defend the current demand zone and reclaim upward momentum, a move toward the 180 resistance zone is likely. This setup aligns with broader bullish market structure and rising channel dynamics.
📉 Key Levels
Buy trigger: confirmed bounce from 155.7 trendline support
Buy zone: 155.7–158.0 (range floor and trendline confluence)
Target: 180.0
Invalidation: breakdown below 155.0 signals structure shift
💡 Risks
Volatility around trendline retest could trigger stop hunts
Failure to reclaim momentum above 165 may lead to ranging
Sudden market-wide weakness could pressure altcoins broadly
If this idea resonates with you or you have your own opinion, traders, hit the comments. I’m excited to read your thoughts!