sol easy tradeThe targets are clear in the picture and I think they will be touched soon due to buyer pressure. Follow for more analysis.
SOLUSDT trade ideas

SOL (Weekly timeframe): Trend structure Price is approaching a key macro support zone. However, as long as it remains below the $148 level, I cannot rule out the possibility of one more corrective leg toward the $76–$55 range before a medium-term bottom is established and a potential resumption of the broader uptrend begins.
A breakout and sustained close above the $148 level would serve as the first technical signal that either:
- a corrective wave B (preceding a deeper correction toward the macro support zone) is unfolding, or
- a new long-term bullish trend aiming for all-time highs is beginning.
Monthly outlook:
My previous idea from November 2024 has fully realized its structure:
Thanks for reading and wishing you successful trading and investing decision!

Price returned. I was already waitingThis wasn’t a pullback — it was a reset. And Smart Money doesn’t chase price. It sets traps. This is one of them.
Breakdown:
SOL delivered into a confluence zone where multiple models align:
Daily FVG overlaps perfectly with a 4H Order Block
0.5 fib retracement (141.82) tagging the midpoint of the prior expansion leg
Volatility spike? Engineered. Not reactive.
Retail is shaken. I’m composed. This is the zone you mark before price even gets there — because when it does, you don’t hesitate.
Trade logic:
Entry: 141.8–146.0 (inside D FVG + 4H OB)
SL: Below the 0.618 fib / 130.8 invalidation
TP1: 152.8 (0.382)
TP2: 166.4 (0.236)
Final draw: 188.4 — full inefficiency fill and premium rebalance
This isn’t about hitting every level. It’s about understanding why these levels matter. Structure tells the story. The fib just refines the sentence.
Final words:
“Smart Money doesn’t trade the reaction. It trades the setup that creates it.”

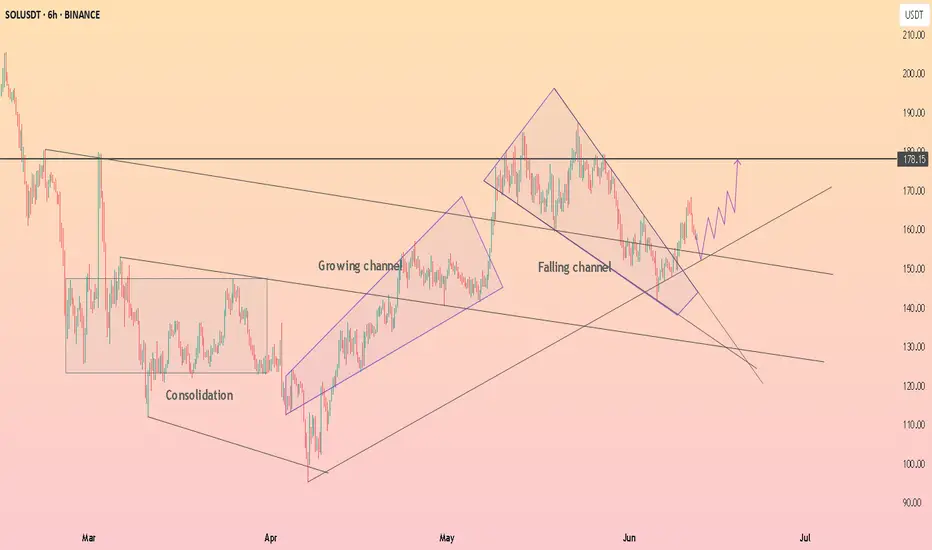
HolderStat┆SOLUSD exit from the formationBINANCE:SOLUSDT
→ Bounce off 150 trend-line fuels channel grind
↳ Reclaim 163–165 then pierce 180 cup-rim
⇢ Targets 190–195 upper rail, even 205+
⤴ Slip < 157 reroutes to 150 demand, < 148 turns bearish
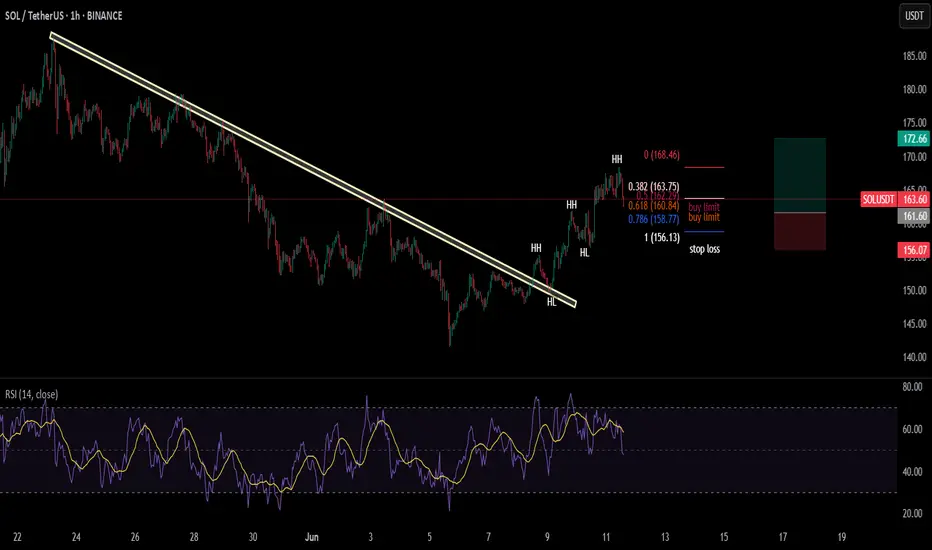
SOL/USDT (Daily Chart), ProjectionsTechnical Analysis – SOL/USDT (Daily Chart)
Projection Pattern: Higher Highs (HH) and Higher Lows (HL)
Indicators: RSI Divergence, Alligator, Support/Resistance Levels
Solana (SOL) is currently in the early phase of a bullish structure, characterized by a Higher High (HH) and Higher Low (HL) sequence. This indicates a potential trend reversal from the previous bearish cycle to a bullish trend.
Key Observations:
HH-HL Structure:
The market printed a Higher High followed by a Higher Low, indicating buyers are gradually gaining control. The current price action suggests a probable continuation to the upside if the next impulse breaks above recent highs.
Buy Stop:
A breakout trade is anticipated if SOL breaks above the Buy Stop level (approximately $156–158), aligned with Alligator indicator resistance and horizontal resistance.
Stop Loss:
Positioned just below the HL zone near $144, offering protection if the bullish breakout fails.
Take Profit (TP1):
The first target is projected near $187.71, which aligns with a historical resistance zone and the next significant swing high.
Indicators:
RSI (Relative Strength Index):
The RSI is currently at 38.05, recovering from a previously oversold region. There are several bullish divergences marked earlier in the year, which preceded major upswings. The latest bullish setup may follow suit if the RSI continues upward.
Alligator Indicator:
The Alligator lines are converging, suggesting a potential breakout phase as market momentum consolidates. A clear expansion of the green (lips), red (teeth), and blue (jaw) lines will confirm trend direction.
Conclusion:
The chart sets up a bullish continuation scenario, contingent on a breakout above the buy stop zone (~$158). If confirmed, the price may rally toward the $187 level. However, a close below $144 would invalidate this setup, suggesting a reevaluation of market sentiment.

$sol long 🧠 Trade Thesis
SOL has pulled back into a key demand zone around the $144–$145 range, forming a potential bullish reversal setup after a steep drop. This level coincides with previous structure support and could act as a springboard for a bullish bounce targeting higher resistance levels.
🎯 Trade Setup
Entry: $145.06 (current price)
Stop Loss: $139.21
Take Profit Targets:
TP1: $160.65 (recent structure high)
TP2: $168.22 (local resistance)
TP3: $179.32 (supply zone)

SOLUSDT | Short-Term Target = $185Today, we got reports that the SEC requested SOL ETF issuers to update their filings which ignited the rally past $165. This boosts investor confidence- we should see good bullish volume in the near term, targeting $185.
US-China talks have also came back positive, awaiting both presidents' approval.
The first hurdle, still, is the 200SMA. Ideally, we want to see a bullish close above $168. This should be easily taken this week, if not today. From there, we aim for the near term high of $185 before zooming out to aim for $250.


SOL 1D. Price Action Suggests a Bullish Move. 12/06/25BINANCE:SOLUSDT
The current price action looks bullish, and it's likely we’ll see a push toward the $170–$180 range without major pullbacks. I’ve outlined a potential path on the chart reflecting short-term expectations.
However, if the broader market experiences a correction, there's no reason we couldn't see a retracement to the 0.5–0.618 Fibonacci levels. For that reason, it's wise to have limit orders set just in case.
Entry Points (EP):
• Market
• $140.25
• $123.41
Take Profit (TP):
• $175.28
• $183.42
• $208.90
⚠️ This is not financial advice. Just my personal outlook based on current structure.
Please do your own research and remember: your decisions are your responsibility.
Stick to your risk management plan, and never risk more than 2% of your portfolio per trade.
Wishing everyone green candles and solid gains!
DYOR.


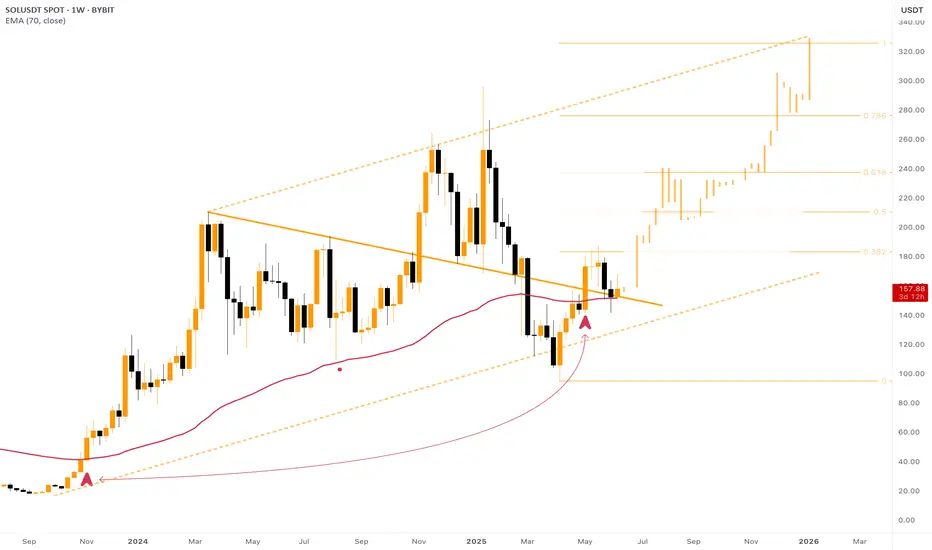
$SOL - Ready for a STRONG Comeback to $300!Throughout 2024 Solana has been moving within the Massive Ascending Channel . It does these days too.
Recently, back in March 2025, there was a fake breakdown of the channel's ascending support. It ended up with a strong pullback above the line. Moreover, the descending trend line that was initially formed in February 2024 was also broken upwards.
Signs of strong bullish volumes.
At the moment the price is consolidating above the EMA500 of 1D chart (EMA70 of 1W) , just as it did back in November 2023 before the famous x7 rally from $30 to $210.
Breakout of the 0.382 lvl by Fibo will mark the beginning of a new rally upwards. Target for this upward movement on CRYPTOCAP:SOL is $320 , must be reached in 2025.
Very strong bearish trend is ahead!We expect after a pull back to the order block solusdt fall atleast 10-20%!

Get Ready For Next MoveThese is a re-post chart from a couple of days ago, nothing has changed just the numbers and TIME but direction still the same and that is UP....UP and away.
Bitcoin is about to enter its 2nd stage UP move in the next 12 to 16hrs (if not sooner).
Once the 4 hrs prints its BIG red candle it will mark the start of next move UP.
That RED BIG candle that will print is just to get rid off greedy high lev Longs.
Be prepared for bulls to take over to continue to the ATHs.
Place your bets ladies and gentlemen and grab your popcorns cause we are heading
into wild ....wild volatility again.

Possible bearish outlook After mitigation of the breaker block, I would love to see Solana resume it's bearishness to the downside

Solana's Retrace Isn't Over, Lower HighSolana's retrace is not over, some weakness is showing up on the chart. Here we have a strong lower high on the daily timeframe coupled with very low trading volume. Low trading volume at this point signals that buyers are just not present. When no new buyers are present, the market will continue in the same trend. The trend is the drop that started 19-Jan, confirmed 23-May with a lower high. Today, a local lower high points to even lower prices.
Once the retrace is over, we can expect a new wave of growth; for now, we have to step back and watch (SHORT) until a new support level forms. When support is in, we can again buy (go LONG).
Sell at resistance, buy at support.
Adapt live to market conditions.
Thanks a lot for your continued support.
Choose wisely. Be smart.
Namaste.

Solana(SOL) in bullish trend!!!the coin has broken the trendline and then also retested it to confirm its bullish rally right now the price action is simply following DOW theory by making HHs & HLs. I have opened a long position on the chart with 1:2 RR.
Solana Hits Major Resistance After 17% Rally — Decision PointSolana (SOL) has posted an impressive 17% rally from the $143 region, which held firmly as a high-confluence support zone. This level aligned with the 0.618 Fibonacci retracement and the weekly support, leading to a strong bullish reaction.
Price is now approaching a significant resistance zone near $176, where multiple technical levels converge:
The point of control from the recent volume profile
The 0.618 Fibonacci retracement from the previous swing high
A critical daily support-turned-resistance level
This area presents a key inflection point for Solana’s trend. A clean breakout above $176 could confirm continuation of the bullish move and likely open up a push toward higher resistance targets. However, if Solana rejects this zone, it could simply result in a healthy pullback to form a higher low—a typical structure within an uptrend.
That said, failure to hold a higher low and loss of momentum may bring price back into the broader range between $143 and $176, which has acted as a containment zone on the high time frame.
How Solana reacts at this level in the coming sessions will be critical for determining whether this is just a short-term rally or the start of a larger bullish expansion.
Key Levels to Watch:
Support: $143
Resistance: $176
Breakout Confirmation: Close above $176 with strong volume

SOL USDT LONG TRADE SETUPSOL/USDT is currently holding at a strong support zone, with a high probability of an upward price move.

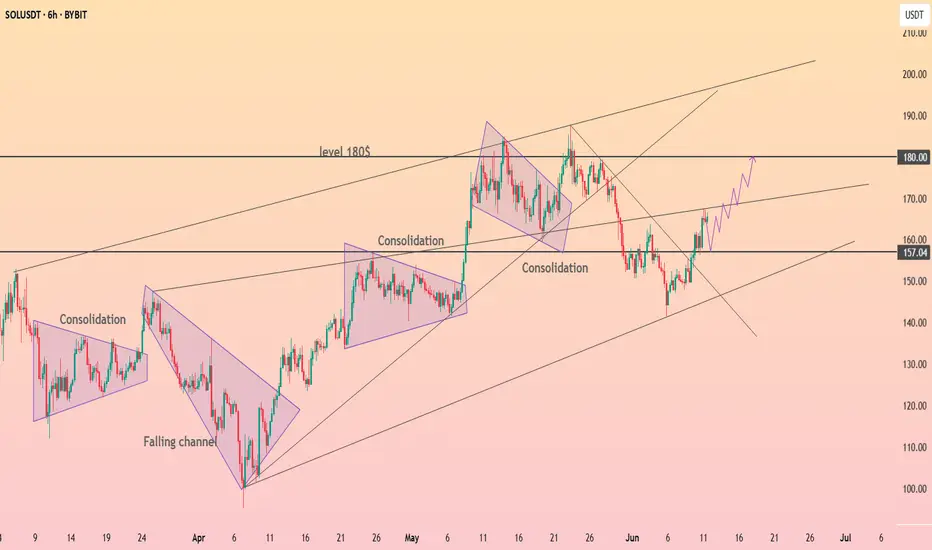
HolderStat┆SOLUSD reached resistance lineCRYPTOCAP:SOL just flipped the 157 pivot into support after escaping a falling channel and retesting the up-trend. Holding here fuels a run toward the 170 trend-cap and 180 supply shelf; failure invites 150 again. Growing channel, consolidation clusters, breakout watch.
sol updateentry price 169.14
stop loss update 169.14
take profit 160.1
145.1
131.5
result for now we hit 2 target and risk free

BUY OPPORTUNITYTrade Setup: SOL/USDT
Entry: $161.13
Stop Loss: $156.57
Take Profit: $176.53
Time Frame:4H
Technical Analysis:
SOL price has decisively broken out above a strong resistance zone between $160.48 and $162, confirming bullish price action. This breakout is likely to trigger a retest of the broken range to confirm support before continuation higher.
Key resistance to target is at $177.20, which aligns with a significant supply zone. Traders should consider scaling out or taking profits near this level due to potential selling pressure.
Risk-Reward: Approximately 1.3 favoring the trade.
RSI: Currently at 63, showing sustained bullish momentum without being overbought.
MACD: Bullish crossover present, indicating upward momentum is intact.
Fundamental Update:
The U.S. Securities and Exchange Commission (SEC) has requested prospective Solana ETF issuers submit amended S-1 forms within the next week. The SEC will review and comment within 30 days of submission. Importantly, the SEC appears open to including staking within Solana ETFs, having asked issuers to clarify language on in-kind redemptions and staking mechanisms. This regulatory openness could add significant bullish catalyst for SOL, supporting increased institutional interest and demand.

SOLANA Short Position Update – June 11, 2025We are the SeoVereign Trading Team.
With sharp insight and precise analysis, we regularly share trading ideas on Bitcoin and other major assets—always guided by structure, sentiment, and momentum.
🔔 Follow us to never miss a market update.
🚀 Boosts provide strong motivation and drive to the SeoVereign team.
--------------------------------------------------------------------------------------------------------
Solana downside perspective shared.
The first target is set at 162.94.
The bearish outlook is based on the Elliott Wave structure and volume flow.
Currently, upward momentum appears to be exhausted, and decreasing volume is increasing the possibility of a trend reversal.
Additional analysis will be shared through an idea update once the first target is reached.
