Phemex Analysis #103: SOL at $168—Bull Trap or Moon Mission?2025 has been a wild ride for Solana ( PHEMEX:SOLUSDT.P ). Its price soared from $189 on January 1 to an all-time high of $295 on January 19, only to crash over 65% to a low of $95 by April 4. Today, SOL has bounced back to around $168, sitting between a key support at $145 and resistance at $209.
Fundamentally, Solana is trending back into the spotlight. Institutional interest is up, with ETF filings from major players like Franklin Templeton, Grayscale, and VanEck. The launch of the REX-Osprey Solana + Staking ETF (SSK) in July—offering a 7.3% staking yield—has added fuel to SOL’s resurgence. On-chain activity remains strong, with over 22 million active addresses and growing developer engagement following performance upgrades like Alpenglow.
With fundamentals strengthening, institutional interest building, and price action showing renewed life, let's explore the possible near-term moves for Solana.
Possible Scenarios
1. Bullish Breakout to $209 and Beyond
SOL may continue its rebound and test the $180–$190 resistance zone. If that breaks with heavy volume, we could see a bullish continuation toward $200–$209, opening the path for a test of recent highs.
Pro Tips:
Entry Signal: Buy on a breakout above $180 with strong volume confirmation.
Profit Targets: Look to take gains near $200 and $209, while watching for further momentum toward $250+.
Risk Management: Place stop-loss just below $165 to protect against sudden reversals.
2. Consolidation Between $145–$180
If buying pressure isn’t enough for a breakout, SOL could consolidate within the $145–$180 range. This would allow the market to digest recent volatility and prepare for the next move.
Pro Tips:
Range Trading: Use grid bots or buy near support ($145–$150) and sell near resistance ($175–$180).
Breakout Watch: Wait for volume to increase at breakout or breakdown levels before taking a more aggressive position.
3. Bearish Breakdown Toward $145
If broader market sentiment shifts or ETF momentum fades, SOL could fail to hold above $145, triggering a correction toward lower support levels near $130 or even $100–$120 in a severe scenario.
Pro Tips:
Reduce Risk: Scale out of positions or go cautious if $145 fails decisively on high volume.
Dip Accumulation: Long-term investors may look to re-enter at stabilized price zones at $130–$120.
Conclusion
Solana remains in a critical phase where fundamentals—signal upgrades, active developer growth, and institutional ETF activity—align with technical bounce patterns. Whether SOL breaks out into a new rally, consolidates, or pulls back depends on upcoming price action and broader market sentiment. By using clear entry triggers, defined targets, and disciplined risk management, traders can effectively ride Solana’s next wave of volatility.
🔥 Tips:
Armed Your Trading Arsenal with advanced tools like multiple watchlists, basket orders, and real-time strategy adjustments at Phemex. Our USDT-based scaled orders give you precise control over your risk, while iceberg orders provide stealthy execution.
Disclaimer: This is NOT financial or investment advice. Please conduct your own research (DYOR). Phemex is not responsible, directly or indirectly, for any damage or loss incurred or claimed to be caused by or in association with the use of or reliance on any content, goods, or services mentioned in this article.
SOLUSDT trade ideas

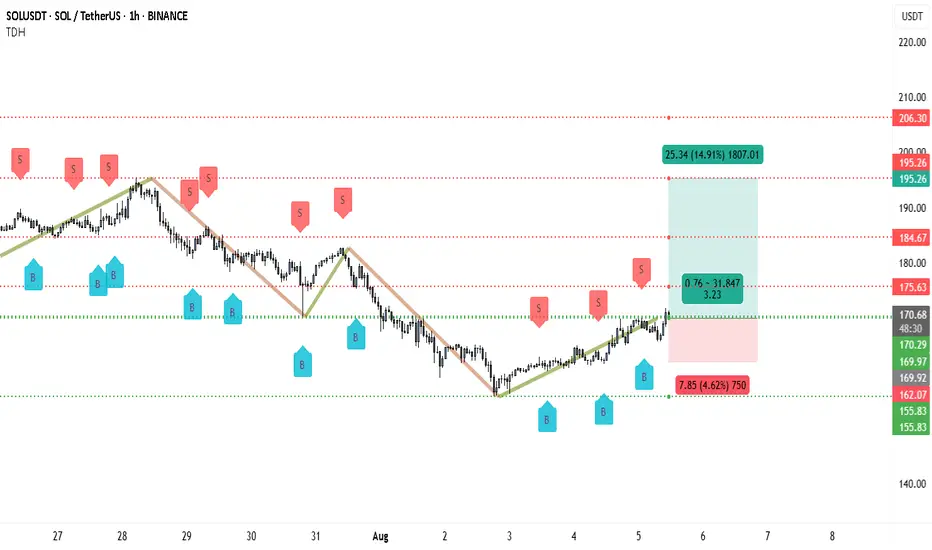
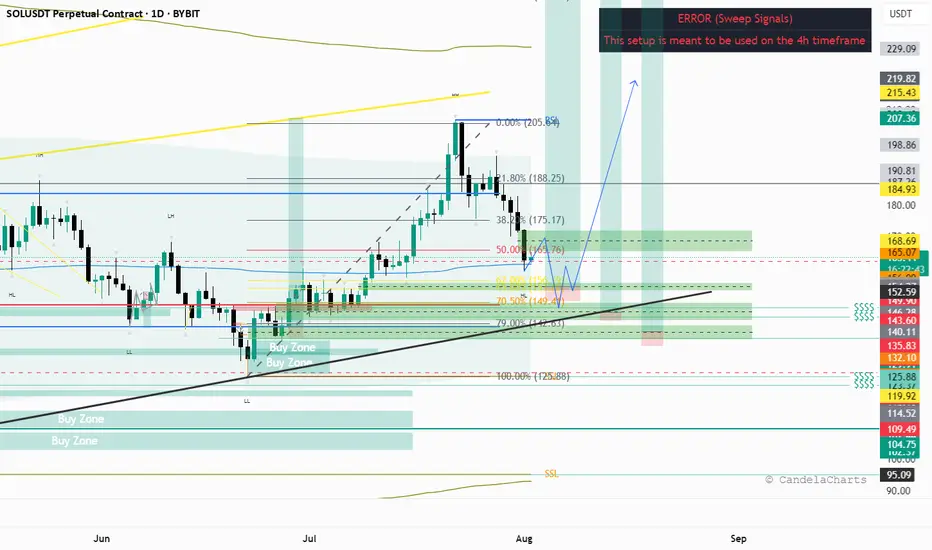
From $162 to $195 — Solana’s Next Big Move Could Be StartingSolana has recently rebounded from a strong demand zone around $162.07–$155.83 after an extended downtrend. This support has held multiple times over the past few sessions, showing that buyers are defending it aggressively. The “B” buy signals near these lows further support the case for an upward move.
Price has now broken above the $170.29–$169.97 resistance area, which has flipped into immediate support. Holding above this zone strengthens the probability of continuation toward the next key resistance levels.
The first resistance to watch is $175.63, followed by $184.67. If price sustains above these zones, the major bullish target lies near $195.26, aligning with the top of the projected profit zone in your chart.
From a structure perspective, the pattern suggests a potential short-term trend reversal, with higher lows forming since August 3. This change in market structure, combined with the break above the recent consolidation, indicates renewed bullish momentum.
Trading Setup
• Entry: Around $170.80–$171.00 (above breakout confirmation)
• Stop-loss: Below $169.90 or deeper at $162.00 for wider protection
• Take-profit 1: $175.63
• Take-profit 2: $184.67
• Final Target: $195.26
• Risk-Reward: Approximately 3.2:1
Risk Caution
Solana is known for sharp intraday swings. Traders should consider locking partial gains once the price moves 2–3% in their favor (about +3–5 USDT from entry) to protect capital while still holding for the larger target.
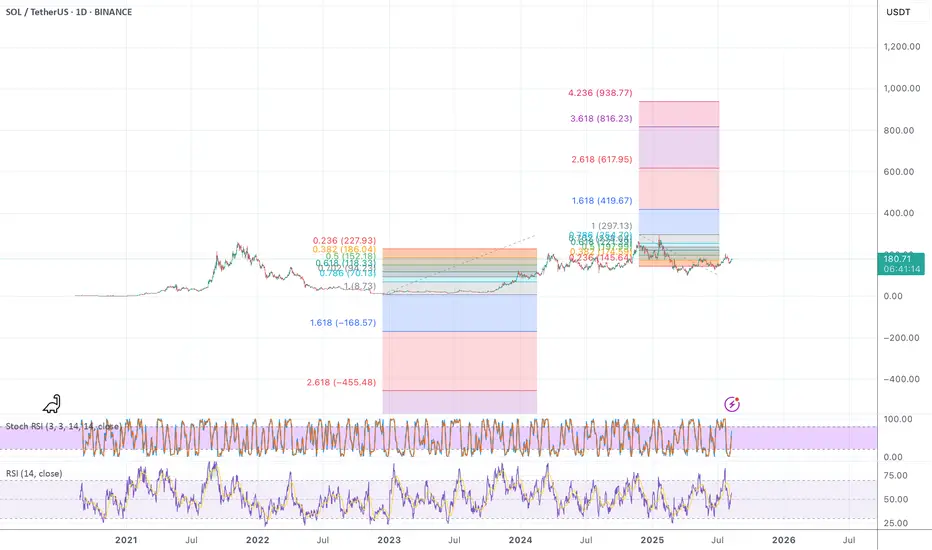
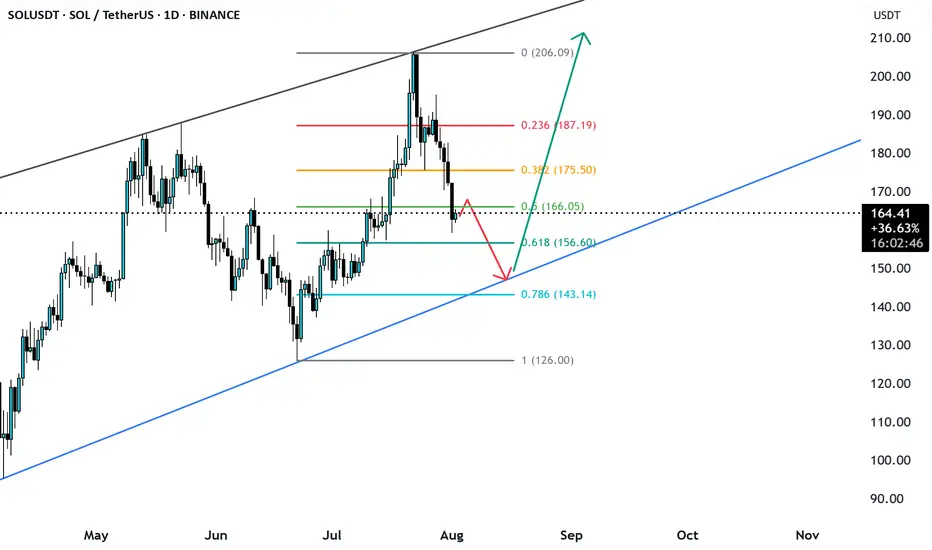
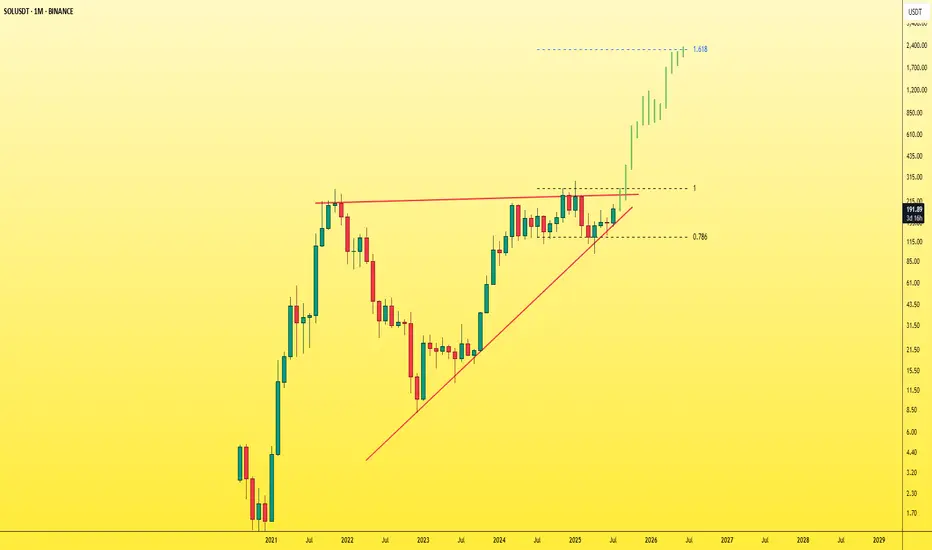
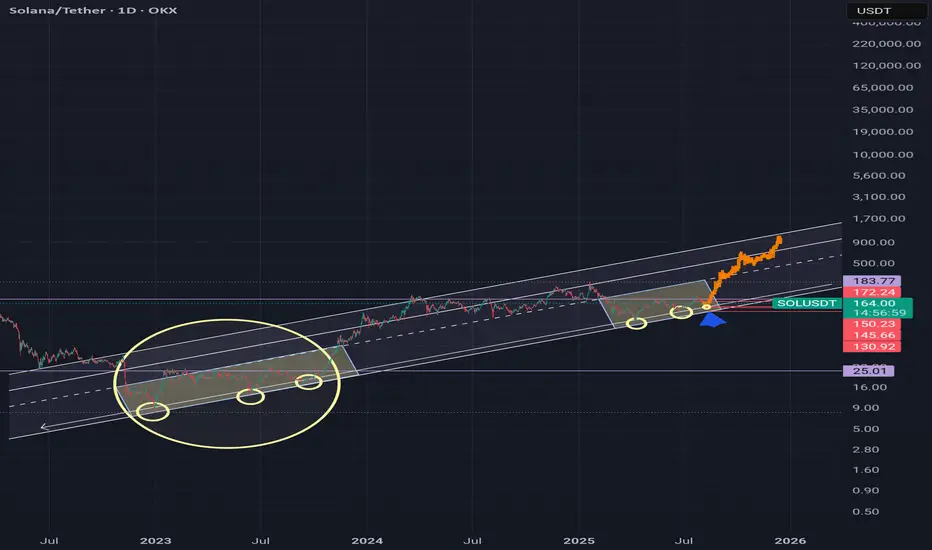
SOL - How high can this thing fly? 1000USD?? Checking the fibbs here I see what is possible.. is it really?
It looks to me like this thing hasn't even started yet.
Can it go to 1000USD? Tell me your thoughts
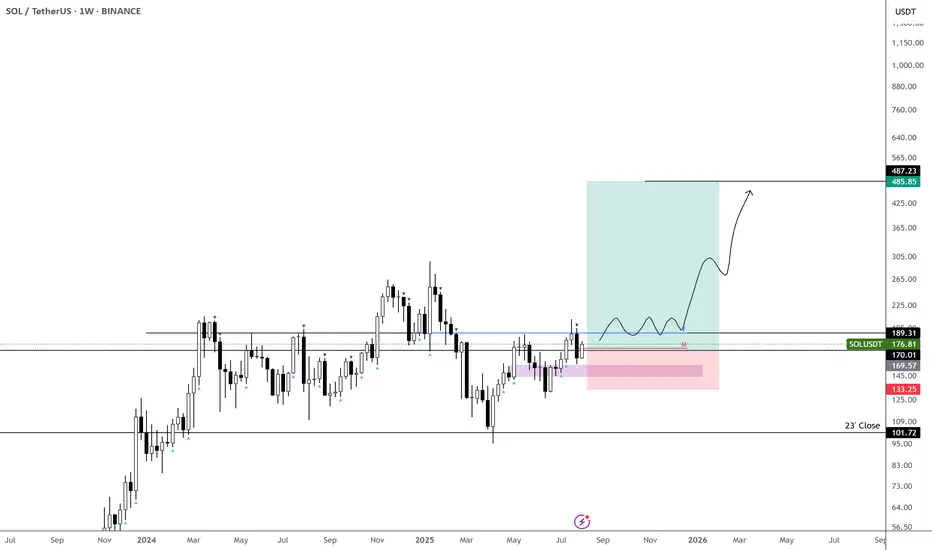
It’s Been a While... $SOL is back!
CRYPTOCAP:SOL has been stuck in a 100–200 range for a while now, with anything outside acting as a liquidity grab before reversing.
Back in March, the market was trying to print a bearish signal (obviously failed), so I didn’t have a clear picture then. Now, it’s back on track.
The monthly isn’t as satisfying as other charts—candle lacks strength and closed below the yearly open. That said, price just tapped the $100 range low, so naturally the next big expectation is a break above $200 with conviction and new highs.
I don’t think CRYPTOCAP:SOL will be the highlight of crypto this cycle, but there’s still a potential 2x from here worth taking advantage of.
next important Supportif the support break in 160 price its become resistance and i think next and strong support is 151

Long-Term Technical Outlook: Critical Decision Point Approaching
The chart illustrates a long-term technical structure where the price has been following an ascending channel after a prolonged bearish trend. However, recent price action indicates a breakdown below the green ascending trendline, raising concerns about a potential shift in market sentiment.
Currently, the $117 level is acting as a pivotal support zone. A sustained breakdown below this level — and more critically, below the red lower trendline — would validate the bearish scenario. This could trigger a deeper correction phase, with downside targets aligned along the red projection path. Such a move may lead to significantly lower price levels in the medium to long term.
🔽 Bearish Scenario:
If the price fails to hold above $117 and breaks below the red trendline, this would confirm the start of a bearish leg. Based on historical structure and projected trajectories, this could result in a descent toward the $93 level initially, with the possibility of extending further downward depending on market conditions.
🔼 Bullish Scenario:
On the other hand, if the price manages to reclaim the green trendline and more importantly, stabilize above the $204 resistance zone, it would signal renewed bullish strength. Such a move would open the path toward higher highs, potentially re-entering the previous upward channel and continuing the macro uptrend.
🧭 The price structure is now approaching a decisive zone, where either a confirmation of bearish continuation or a bullish recovery will likely unfold. Both scenarios have been visually outlined — green lines indicating bullish continuation, and red lines representing bearish momentum.
📌 Note: This analysis is for educational purposes only and should not be interpreted as financial advice.

SOLUSDT LONG- Signal: LONG
- Entry: SOLUSDT 176.95 ~ 177.10
- Take Profit: 177.68 / Stop Loss: 176.78

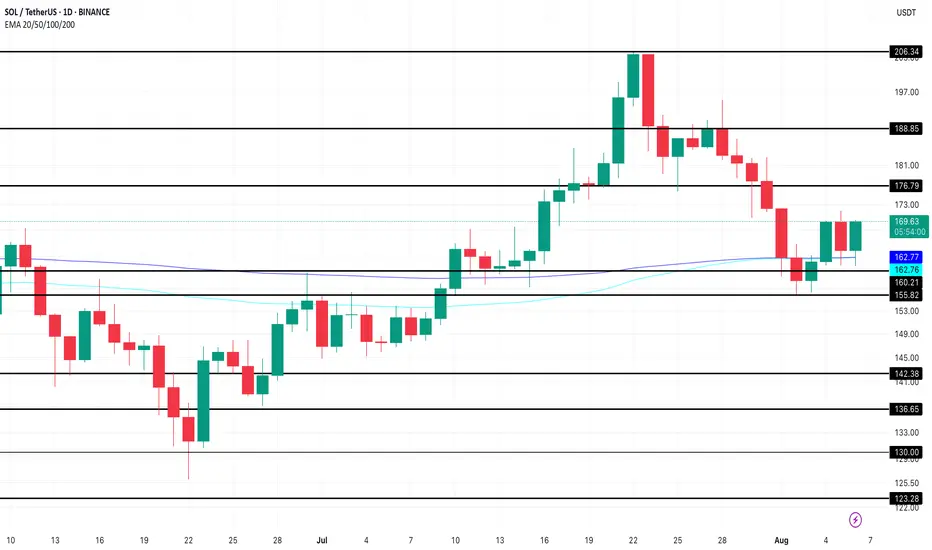
Solana Eyes Short-Term Bounce as Technical Setup StrengthensBINANCE:SOLUSDT 's price has come under pressure in recent days, falling nearly 10% from its local high. But despite the pullback, a rare technical pattern and steady institutional demand suggest the trend could be gearing up for a reversal.
On the daily chart, BINANCE:SOLUSDT is on the verge of a golden crossover, a bullish signal that occurs when the 100-day EMA crosses above the 200-day EMA. Historically, this setup has preceded short-term rallies. BINANCE:SOLUSDT is currently holding just above the $160 support level, and a move above $176 could confirm bullish momentum.
If price extends past $188, the next psychological target sits at $200. However, if BINANCE:SOLUSDT breaks below $155, downside pressure may build. A full invalidation occurs if the EMAs flip bearish, where the 200-day EMA overtakes the 100-day, forming a potential death crossover.
SOL’s balance on centralized exchanges has dropped nearly 10% since July 23, falling from 33.06 million to 30.78 million tokens. This reduction in available supply has coincided with a repeat of a historical crossover pattern, where price moves above the exchange balance trendline.
In past instances, such as on July 16 and July 24, this crossover preceded multi-day rallies. The latest crossover happened near $169. Although the price has pulled back, the trend remains valid as long as supply stays low and price holds above the $160 zone.
While SOL’s spot price corrected over the past week, CME futures open interest held steady. This divergence often suggests that larger players are maintaining their long exposure, waiting for weaker hands to exit.
A similar divergence in late July saw price rebound from $184 to $188 once open interest stabilized. As long as CME activity remains steady or rises, institutional sentiment will likely continue to act as a support buffer beneath current BINANCE:SOLUSDT price levels.
SOLANA $250 INCOMING? or $150 again?We can see a wedge is forming, price is at a major point, break above with a failed break below the resistance - we see high potential for $250.
Failed breakthroughs and a rejection? We see $150 once more.
Thoughts?

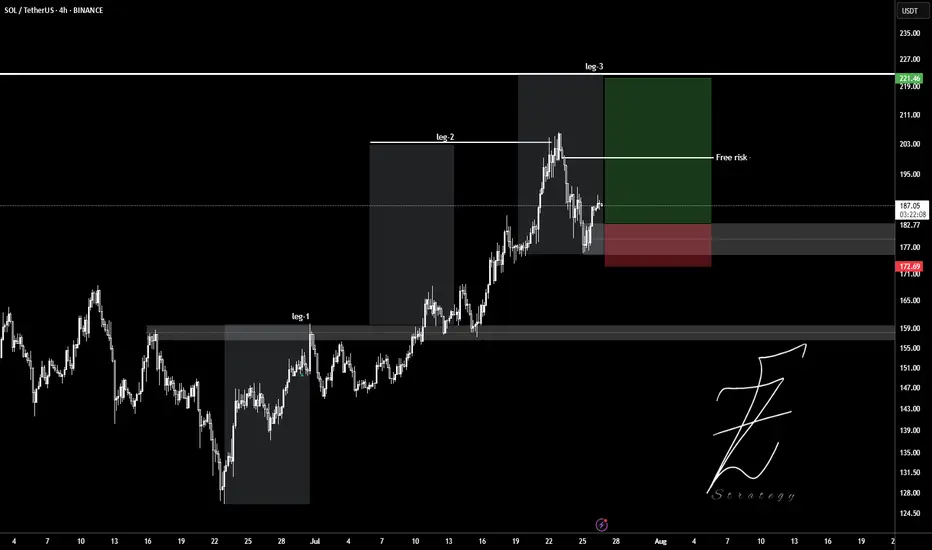
SOLUSDTWait for pollback to 180$ level and ready to get buy position.
Target set in leg2 and leg3.
Entry: 182
Stop: 177
Tp: 190 - 200 - 210 - 220
Please control Risk management.
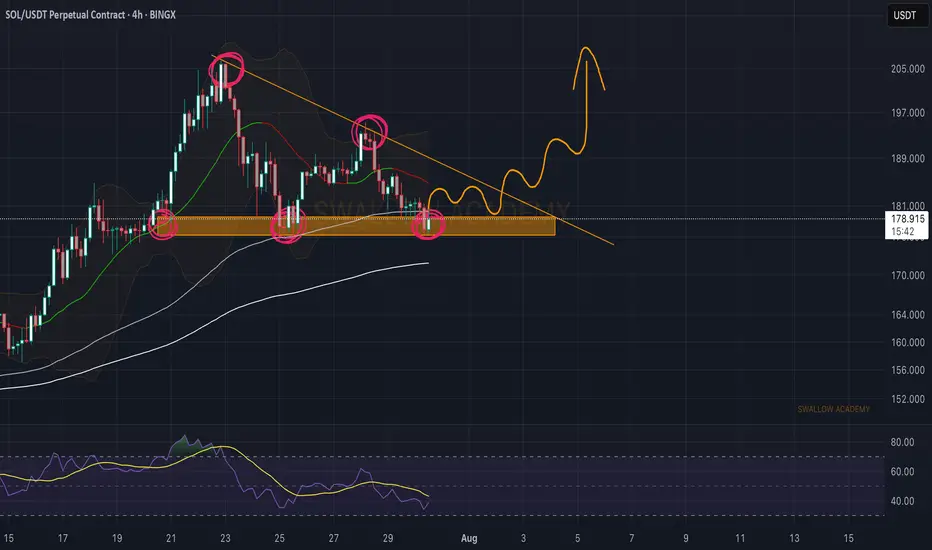
Solana (SOL): Triangle Pattern | Waiting For Bullish BreakoutSolana failed to break down from the local neckline zone (or support zone, for those who want to call it that). What we got instead is buyside dominance, where buyers took back the area and are now pushing the price back toward the upper side of that triangle pattern, so that's where our current target is sitting, as long as we break that line.
Swallow Academy

SOLUSD broke the 0.5 fib level is likely to go down SOLUSD yesterday broke the O.5 Fib level and price may further go down to trendline support from where price may get reverse.
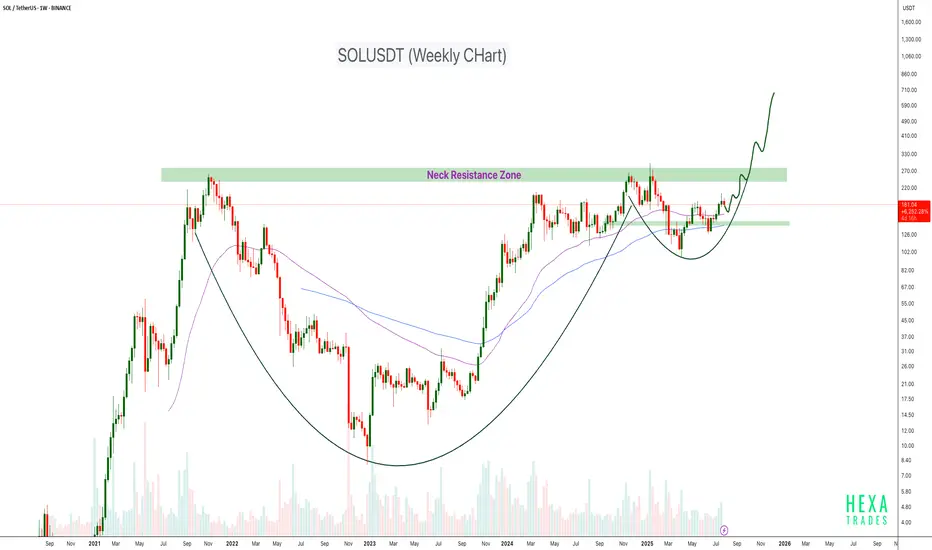
SOLUSDT Cup & Handle Formation CRYPTOCAP:SOL is forming a large Cup and Handle pattern on the weekly timeframe, a classic bullish continuation structure. Price is currently approaching the neckline resistance zone around the $250–$280 level. This area has acted as a major barrier in the past, rejecting the price multiple times, but the structure suggests it's now being retested with greater momentum.
If the neckline breaks cleanly with strong volume, the projected target could push SOL into the $600–$700+ range over the coming months.
Cheers
Hexa
BINANCE:SOLUSDT COINBASE:SOLUSD
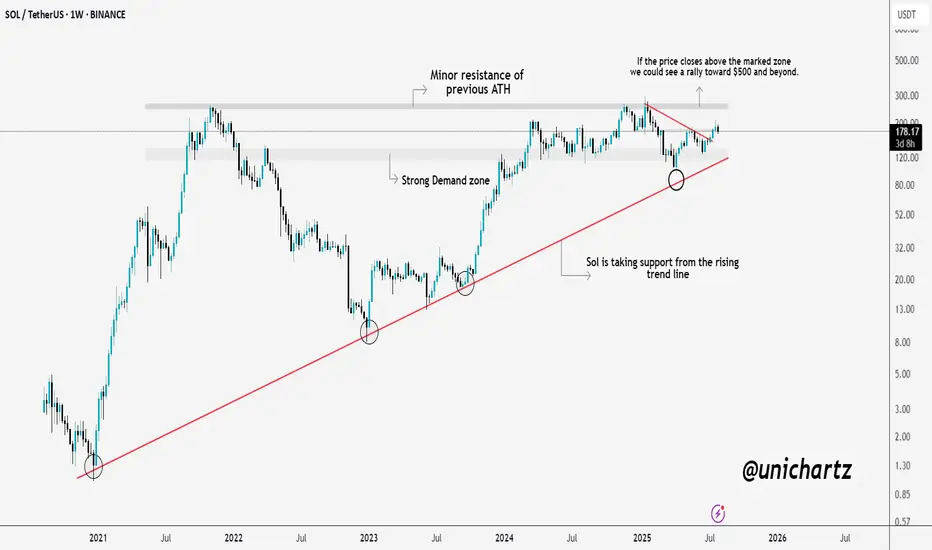
Massive Move Loading? $SOL Prepping for a BreakoutSolana is showing real strength here.
CRYPTOCAP:SOL consistently taking support from the long-term rising trendline, a sign that buyers are defending key levels. We're also approaching a critical resistance zone, which was the previous ATH area.
If SOL manages to close above this zone, we could witness a strong rally towards $500 and beyond. Until then, it’s a crucial level to watch, a breakout here could set the stage for the next leg up.
DYOR, NFA
SOL Sol next move idea.
Sol's final leg down before the final leg up for this bullrun. Fill the daily imbalances come to 70 % fib retracement level also a volume POC on a discount area below 50% of the dealing range and the daily trendline.
SOL - Don't miss the breakout before it's too late!The symmetrical triangle pattern on the monthly timeframe is showing signs of weakening after multiple failed breakout attempts — and now, a breakout seems highly likely.
Once SOL breaks out of this triangle, it will enter price discovery mode , opening the door to a massive bullish move. At that point, most traders will start saying “it’s too late”, while SOL keeps rallying aggressively — fueled by FOMO and liquidity traps.
You'll see:
- People outside the market waiting for a pullback that never comes.
- Traders inside the move getting shaken out by small dips and volatility.
Right now, SOL is still in a fair trading zone and available at a reasonable price .
Don’t wait for it to explode and then chase. Get in before the breakout .
Best Regards:
Ceciliones🎯
SOLUSDT-1D Liquidity Grab + CHoCH = Short Setup on SOL? SOL on the daily chart shows signs of a potential trend reversal:
🔻 Liquidity grab above previous highs
🔄 CHoCH (Change of Character) confirmed
📥 Entry zone tapped, price showing early signs of rejection
📉 If supply holds, eyes on the $120 zone as next target
🔍 RSI rolling over from highs = weakness incoming?

80% drop into the abyss for Solana? - July 2025** The months ahead **
Examination of the 3-week chart for SOLANA reveals several compelling technical signals that suggest a potential bearish trend reversal. This analysis highlights crucial patterns traders and investors of Solana should consider.
1. Formation of a 3-Week Death Cross:
A notable bearish signal prints on the chart: a ‘3-week death cross’. This follows a ‘2-week death cross’ that preceded a significant downward movement, just as in early 2022. The death cross, where a shorter-term moving average crosses below a longer-term one, is a strong indicator of a shift towards a bearish trend, especially on higher timeframes like this 3-week chart.
2. Broken Market Structure:
The chart clearly indicates a “broken market structure.” This typically occurs when the price fails to create higher highs and higher lows during an uptrend, or in this case, breaks below a significant support level that had previously held. It is absolutely possible price action backtests past support for a resistance confirmation, however on looking left, such a test never occurred on the last death cross.
3. Resistance from Previous Peaks (Head and Shoulders Pattern):
Price action leading up to the recent highs resembles a potential ‘Head and Shoulders’ pattern. The three distinct peaks, with the middle peak being the highest, suggest a classic reversal pattern. A subsequent break below the ‘neckline’ (implied support level below the peaks) would confirm the bearish outlook.
4. RSI Oscillator (bottom of chart) resistance
The lower panel of the chart displays an RSI oscillator indicator, which shows a clear pattern of "resistance." following a period of support since 2023. The RSI has clearly confirmed resistance from almost 3 years of support.
5. Solana vs Bitcoin
All the bearish observations made on the SOL-USD trading pair can be observed on the same 3 week time frame for the SOLANA - BITCOIN trading pair:
6. Potential for Significant Downside Target:
Based on the measured move from the previous death cross and breakdown and Fibonacci extension, the chart illustrates a potential downside target of approximately -70% from current levels toward the $30-40 area. While this is a projected target and not guaranteed, the historical precedent following similar bearish signals provides a context for the potential severity of the downturn if the bearish momentum continues.
Conclusion:
Considering the confluence of a 3-week death cross, broken market structure, resistance from previous peaks (suggesting a potential Head and Shoulders pattern), and the confirmation of RSI resistance, the outlook for SOLANA on the 3-week timeframe appears distinctly bearish.
Is it possible price action continues upwards after a 3200% rally? Sure.
Is it probable? No
Ww

#SOL Update #7 – Aug 02, 2025#SOL Update #7 – Aug 02, 2025
Solana has broken below the low of its last impulsive move, forming a new, deeper bottom. The first area where it may find support is the $158 level. If this fails, the next support level lies at $147. At the moment, Solana is clearly in a downtrend on the 4-hour chart. For Solana to resume its upward movement and confirm a trend reversal, it needs to break above the $206 level with a strong, high-volume candle. Currently, Solana might be considered a cheap opportunity only for those looking to hold spot positions long-term. Otherwise, I don't see it as a suitable option for trading.

SOL 1H – Bounce From Demand, Can It Reclaim the Breakdown Zone?SOL tapped into the key demand zone near $157 and is now showing signs of a reaction bounce. Price is approaching the former support-turned-resistance zone around $184 — a critical level that marked the start of the previous breakdown.
A reclaim of that zone would suggest bulls are regaining control, opening up room toward the $190–$200 region. Until then, it remains a lower high attempt inside a bearish structure.
📌 Demand bounce
📌 Bearish market structure
📌 Key resistance at ~$184
No confirmed reversal yet — just a bounce until proven otherwise. Keep watching the structure evolve.

Longterm Uptrend still in a Process!Look at 3 contact below.
Currently price avout to put 3rd touch to lower zone of trend and it marks to $148-$151.
After that upside move will start to gain momentum in my opinion.
Macro view is still bullish roughly above $150.
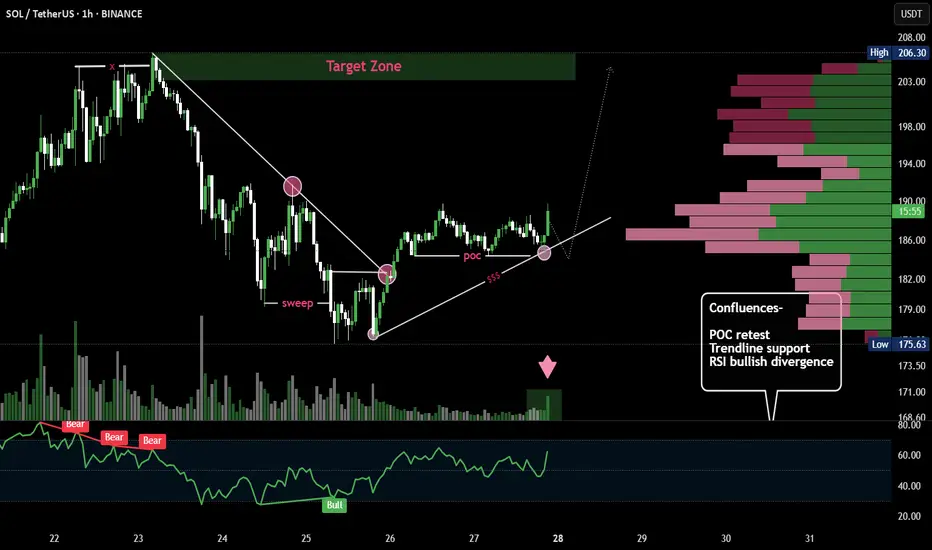
SOL/USDT 1H Chart – Technical Analysis BreakdownTrend Reversal Structure: Price broke out of a descending trendline after sweeping prior lows (liquidity grab), indicating a possible bullish reversal setup.
Point of Control (POC): Price is currently retesting the POC area (high-volume node), aligning with the trendline and prior support — a potential bounce zone.
RSI Divergence: Bullish RSI divergence marked near the sweep confirms the loss of bearish momentum, strengthening the case for upward continuation.