SOL long 50%50% retrace and higher high market structure shift on 5-15m with stop loss under previous low. Looking for a 1:3 RRR at the near highs of the 50%
SOLUSDT trade ideas

SOL ANALYSIS🔮 #SOL Analysis 🚀🚀 Update
💲💲 As we said #SOL performed the same. #SOL is trading in a Ascending Broadening Wedge Pattern and there was a breakdown of the pattern. Now we can expect a breakout of the resistance and a bullish move
💸Current Price -- $151
⁉️ What to do?
- We have marked crucial levels in the chart . We can trade according to the chart and make some profits. 🚀💸
#SOL #Cryptocurrency #DYOR

SOL / USDT Update - Breakout in Play! Check out the 1H chart for SOLUSDT. Solana is showing strength in a rising channel, with a recent breakout from a symmetrical triangle to support at $150.
If we break to $165, we could see a strong move higher. But if rejected, watch for a pullback to $150 or lower.
What’s your take?

SOL pushing into resistanceCRYPTOCAP:SOL had a great bounce off the 99 SMMA on the weekly.
This weekly close will be key to see if we get a market structure shift or just a rejection.

SOL SHORTShorting solana on the weekly bearish OB at 166.6 and my second entry at precisely 170.
Targeting 150s and lower.
Goodluck

#SOL/USDT#SOL
The price is moving in a descending channel on the 1-hour frame and is expected to continue upwards
We have a trend to stabilize above the moving average 100 again
We have a descending trend on the RSI indicator that supports the rise by breaking it upwards
We have a support area at the lower limit of the channel at a price of 134
Entry price 137
First target 140
Second target 144
Third target 149

#SOL/USDT#SOL
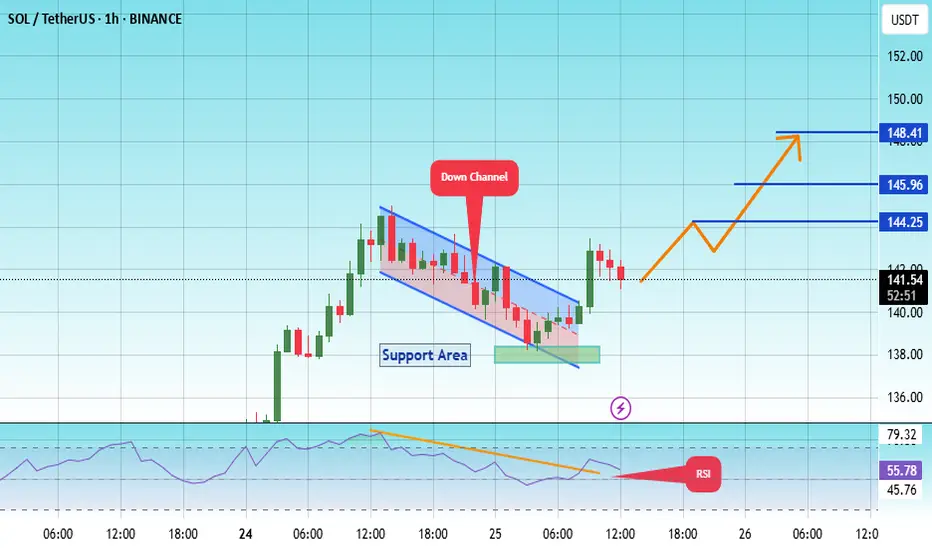
The price is moving within a descending channel on the 1-hour frame, adhering well to it, and is heading for a strong breakout and retest.
We are seeing a bounce from the lower boundary of the descending channel, this support at 138.
We have a downtrend on the RSI indicator that is about to be broken and retested, supporting the upward trend.
We are looking for stability above the 100 moving average.
Entry price: 142
First target: 144
Second target: 146
Third target: 148
#SOL/USDT#SOL
The price is moving within a descending channel on the 1-hour frame and is expected to continue lower.
We have a trend to stabilize below the 100 moving average once again.
We have a downtrend on the RSI indicator that supports the upward move with a break above it.
We have a resistance area at the upper limit of the channel at 127.
Entry price: 126
First target: 124
Second target: 122
Third target: 119

SOL in coming weeksThe SOL will increase $150 and reach to the top of the wedge in the coming weeks .
Give me some energy !!
✨We spend hours finding potential opportunities and writing useful ideas, we would be happy if you support us.
Best regards CobraVanguard.💚
_ _ _ _ __ _ _ _ _ _ _ _ _ _ _ _ _ _ _ _ _ _ _ _ _ _ _ _ _ _ _ _
✅Thank you, and for more ideas, hit ❤️Like❤️ and 🌟Follow🌟!
⚠️Things can change...
The markets are always changing and even with all these signals, the market changes tend to be strong and fast!!

SOLUSDT Weekly Technical Analysis – April 25, 2025Trend Structure & Key Technical Zones
Solana (SOL) has been respecting a long-term uptrend line (green dotted) since its 2022 lows. This trendline served as a dynamic support throughout the bullish expansion in late 2023.
However, price action since Q1 2024 shifted into a broad sideways consolidation range, where SOL formed a well-defined horizontal range between $76.78 (support) and $294 (resistance).
Recently, SOL retested the lower bound of this range around $100, which aligns with a strong historical support zone, and bounced decisively, validating it once again. The bounce is marked with a green arrow in the image — signaling buyer dominance at this key structural area.
Range-Bound Market & Price Behavior
This chart clearly presents a multi-month horizontal consolidation where SOL has:
Rejected the $76.78 level multiple times (strong demand)
Struggled to break through the upper barrier at $294
Remained confined within this accumulation/distribution range, offering both trading and positional opportunities
The dotted black trendline within the range (slightly upward sloping) suggests a mild internal bullish bias, pointing to gradual accumulation from smart money.
MACD Indicator Analysis
Below the price chart, the MACD (Weekly) shows
Bullish crossover forming with the MACD line crossing above the signal line
Bearish momentum fading, as visible from the shrinking red histogram bars
A potential shift in medium-term trend direction, supporting the bullish bounce
This momentum shift aligns perfectly with the recent support zone rebound, increasing the probability of a move toward the top of the range.
Trade Idea (Position-Based)
The image outlines a position trade idea with a clear setup based on range-play strategy.
Entry Point: $154.51
Stop Loss: $121.48 (below key structure, protecting against breakdown)
Take Profit: $259.78
Risk-to-Reward Ratio: ~3.19
Potential Gain: +68.13%
Potential Risk: -21.38%
The trade aims to capture the move from mid-range to range-high, capitalizing on momentum reversal and strong technical confirmation from MACD and price structure.
Summary & Outlook
Long-term trend remains bullish, as evidenced by the major trendline and price structure.
Strong support at $76.78 continues to hold firm.
MACD confirms bullish reversal signs, supporting a possible rally toward the top of the range.
Risk is well-defined and positioned below structure.
Next resistance levels to watch: $259.78 and extended zone at $294.53 (top green line)
SOL shows a high-probability bounce from a strategic support zone, supported by momentum reversal and trend structure. Traders can look for range-to-range swing plays while longer-term investors may also monitor for breakout above $260+ for trend continuation.

SOLANA (SOL) – Bearish Breakdown Incoming? Watch These Key LevelHey Traders!
#SOL is currently showing strong bearish signals on the 2H timeframe:
🔸 Rising Wedge Pattern spotted — a classic bearish reversal structure.
🔸 Bearish Divergence on RSI — momentum is weakening while price continues higher.
🔸 Breakdown from the wedge already occurred — confirming the initial weakness.
Next Key Support Zone: $120–$130
This zone has held multiple times, but a clean break below followed by a retest could offer a high-probability short setup.
🎯 Trade Plan:
We’re watching for:
Break of the $120–$130 support
Retest of the broken level
Entry on confirmation with strict risk management
💬 What’s your take on #SOL? Are you bullish or bearish? Drop your thoughts below!
🧠 Trade smart, manage your risk, and follow for more TA like this!
📌 Like, comment, and share if you found this helpful.
#SOL #Solana #CryptoTrading #BearishDivergence #RisingWedge #TechnicalAnalysis #TradingSetup #ShortTrade #CryptoTA #Altcoins

SOL?
Hi,
This asset passed earlier sell off. 145.500
Now trading 151.600
I need to be careful. 151.600 gap to 145.500 if Im buying now.
Due to bullishness in this crypto space recently. Further up n up likely,
Just be careful, reminder for myself.. to not be stuck at higher prices.
May wait for retraces.. 150.. if it wants
All the best
Not a guru

SOL/USDTInitially, there is a level, there is also a liquidity removal.. but I would like to show you the indicator that I came up with and prescribed and how it works. Thank you all so much!

SOL/USDT SOL currently testing support line of, as well as testing recent fair value gap. if your trade continue in solana then no need of close trade just update stop loss, for fresh the can start trade with
Target 01 : 164.00
Target 02 : 179.00
Stop loss : 133.00

SOL/USDTSOL/USDT looking good right now, it show divergence on daily time frame also break the down trendline with good volumes, currently react as the support line.
Need to break recent high for further confirmation

Solana (SOL/USD) Elliott Wave Update – Countertrend Rally in ProBINANCE:SOLUSDT
🟠 Current Elliott Wave Outlook
After completing Wave ③, Solana began a sharp correction. This is how the current structure unfolds:
The initial leg down unfolded as a clear (1)-(2)-(3)-(4)-(5) structure in black – forming the white Wave A of a larger A-B-C corrective pattern.
We are now in the corrective counter-move, forming Wave B.
🔄 Zooming into Wave B: Internal Progression
The early part of Wave B is unfolding as a small impulse:
→ Wave 1, 2, 3, 4 have already played out.
→ We are currently moving from Wave 4 into Wave 5, which is expected to complete the black (A) of white B.
The top of Wave (A) is already marked on the chart, coinciding with key Fibonacci Extension levels, which reinforce the probability of local exhaustion.
🟨 Next Structure – Building Wave (B) of B
After the black (A) completes, we expect a retracement wave (B).
This would then be followed by a yellow 1-2-3-4-5 impulse to the upside – forming the full structure of white Wave B.
📉 What Comes After B?
Once Wave B (in white) is complete (built from the black (A)-(B)-(C)), we anticipate another larger leg to the downside – white Wave C.
This would complete the full A-B-C correction from the macro top of Wave ③.
🎯 Key Zones to Watch:
Black Wave (A) Top = short-term resistance
Fibonacci Extension Area = likely exhaustion zone for the current rally
Wave B (white) = potential bearish trap before the real drop (Wave C)
✅ Summary
Solana is currently in a countertrend corrective phase after finishing a macro Wave ③ top. We are in the midst of building Wave B, starting with a local impulse that forms black (A). After a minor pullback (black (B)), a 5-wave push (yellow) could complete Wave B before another major leg down kicks off in Wave C.

Solana Long Term I think it will form a handle-cane pattern. I will open a short position when Solana reaches $180.
Volume must be observed while this pattern is forming.
The maturity of this position is 1-2 months. I will open a long position if it closes above $180 for 3 days.

solona SOL/USDT: Key Levels to Watch
SOL/USDT trades at 146.66 (+2.94%), showing bullish momentum but facing key tests ahead.
Critical Levels
- Support: 142.12 (immediate), 138.21 (strong), 130.00 (major)
- Resistance: 151.10 (breakout zone), 155.00 (next target), 160.00 (major hurdle)
Outlook
- Bullish: Holding 142.12 and breaking 151.10 could push SOL to 155-160.
- Bearish: Losing 142.12 may trigger a drop toward 138 or 130.
Watch RSI (60.57) and MACD (4.88) for momentum clues.
Trade wisely—always confirm with volume and price action.

Solana structur-update ElliotWaveBINANCE:SOLUSDT
I'm still anticipating the same pattern; the only change is an additional high in wave 3.

Trading Observation on SOLSOL has officially reawakened.
After respecting the GB11 Order Block in the $98–$130 range — a clean accumulation zone — price has initiated what appears to be a calculated delivery run toward the GB89 OB near $273. This move aligns perfectly with the Goldbach pathway (GB11 → GB89), signifying that smart money is in full control, executing a textbook liquidity sweep and redistribution cycle.
Recent PA shows SOL breaking structure above the OB with conviction, flipping resistance into support. The order block was mitigated cleanly, offering an optimal entry for those paying attention. With volume tapering into breakout and now expanding on bullish momentum, the roadmap is being laid out in real time.
I’m projecting price to magnet toward the unmitigated imbalance zones above — particularly the inefficiencies left between $200 and $240. These are natural resting points on the journey to GB89.
Bias: Bullish continuation
Entry: $130–$144 (Order Block Breakout)
Target: $273 (GB89 OB)
Invalidation: Clean break below $120 closes the path
Path of least resistance is up. Liquidity is calling. I’m watching SOL unfold with the patience of a general at war — calculated, focused, and positioned.
Lord MEDZ

SOLANA SHORT TERMIf the uptrend continues and we see a bullish Total chart (i.e. we get volume support) then this pose will work.

SOLANA; BEARISH ASCENDING WEDGECRYPTOCAP:SOL had a false breakout from a descending wedge around the $127 price area marked with a horizontal green trend line.
This false breakout appears as a bearish ascending wedge, which would eventually break down because there is a fast pace of higher lows and a very slow pace of higher highs, which shows that lots of traders have been looking to short from the $147 price area, which appears to be a major resistance.
I would be entering a short position around the $150 price area, and my TP will be at $130.

SOLANA → Pre-breakout consolidation relative to 136.00BINANCE:SOLUSDT relative to the range support forms a false breakdown. The market reacts quite positively and the price recovers, forming a consolidation in front of strong resistance
Bitcoin is also in consolidation, as well as SOL, in general the movements coincide, but lately bitcoin is leading relative to the stock market.
SOL is in consolidation in front of a strong resistance level at 136.00. The primary test may end with a small correction to 0.5 fibo, or consolidation near the level, but a breakout and price consolidation above the current consolidation will be a positive signal for continued growth. The global trend reversal is out of the question, we are aiming at local targets, such as 140, 147, 152.
Resistance levels: 147,152
Support levels: 129, 123, 111
In general, the global market situation is bearish, the local situation is neutral as the price is in a sideways range. A false breakdown was formed against the support of the current range. Technically, due to liquidity imbalance (after the false breakdown) the price may head towards such zones as 147 - 152
Regards R. Linda!
