Long trade
15min TF overview
📅 Trade Log Entry
Pair: SOLUSDT
Date: Sunday, April 20, 2025
Time: 4:30 PM (NY Time)
Session: New York PM
Entry 136.068
Profit level 137.391 (0.97%)
Stop level 136.023 (0.03%)
RR 29.4
📊 Trade Setup – Buyside Idea
🧠 Strategy Components:
Volatility Zones Identified:
🔹 White: Resistance zone
🔹 Green: Support zone
🔹 Yellow: Midpoint (key POI)
Liquidity Sweep: Price swept below support capturing liquidity before reversing.
Order Block & Choch: Institutional buy zone confirmed with a bullish change of character.
Break of Midpoint (Brk): Confirmed directional bias following midpoint breakout.
30sec TF overview
SOLUSDT trade ideas

$SOL - Pullback to $120 Likely?Solana recently rebounded from a key higher-timeframe support level. However, a short-term pullback to around $120 could be on the horizon before any significant upward move.
For a short-term outlook, check this video.

Short trade
📉 Sell-side Trade – SOL/USDT
📅 Date: Sunday, April 20, 2025
⏰ Time: 4:00 AM (NY Time) – London Session AM
🕓 Structure: 4Hr Timeframe
🎯 Target: Liquidity low
Trade Details:
Entry: 137.133
Take Profit (TP): 133.559 (–2.61%)
Stop Loss (SL): 137.275 (+0.10%)
Risk-Reward Ratio (RR): 22.17
"This is a refined supply zone rejection, with the 4-hour structure aligning for a liquidity sweep, confirming a sell-side trade setup." and following early executed sell side trade.
15min FT overview.

SHORT SOLUSDT SOONI believe we may be setting up for a potential short opportunity between the 138 and 150 levels. This appears to be an expanded flat, which is one of the most common corrective patterns seen in wave 4.
Wave B has already successfully bounced off the 1.38 Fibonacci level, which adds further confidence to this structure. Currently, it looks like we're in the process of completing wave C, which would finalize the correction and potentially mark the beginning of the next impulsive move downward.

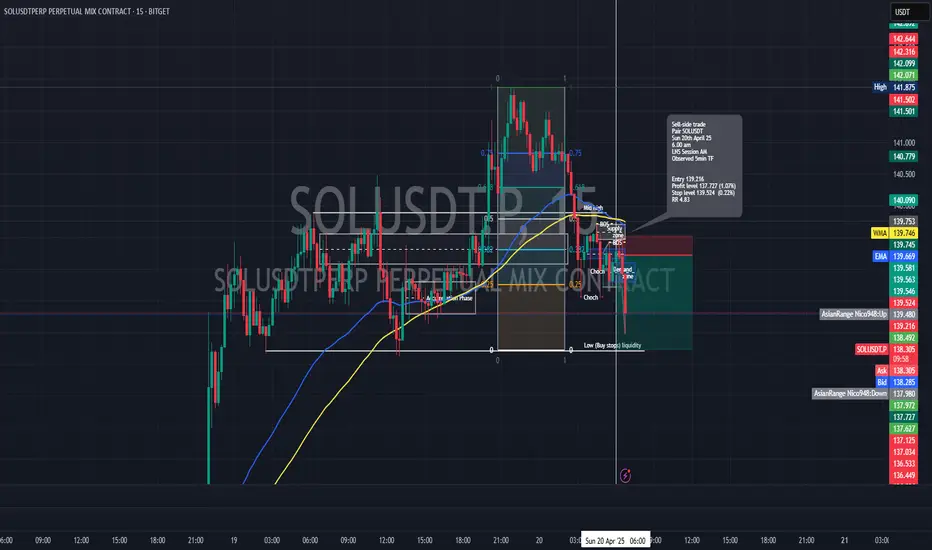
Short trade
📉 Sell-side Trade – SOL/USDT
📅 Date: Sunday, April 20, 2025
⏰ Time: 6:00 AM – London Session AM
🔍 Observed Timeframe: 5min
Trade Parameters:
Entry: 139.216
Take Profit (TP): 137.727 (–1.07%)
Stop Loss (SL): 139.524 (+0.22%)
Risk-Reward Ratio (RR): 4.83
Focused on lower timeframe structure and supply zone rejection - internal liquidity sweep for a sell-side trade idea.
Stop level moved (0.50%)
SOL - Beautiful TA days ago with updates.2 Days Ago we were waiting for some Levels to be broken, so we can jump into a trade.
At the Beginning there was a big fight between Bulls and Bears.
I said :
"Big Money is shorting the Local Daily and absorbing Longs. The probability that Whale Sellers get exhausted is high too!"
"A short at Grey TL would be Risky"
Updated hours later: Bulls were getting stronger.
"That POC level is a key level .Nice scenario would be: if POC gets broken and retested. Perfect Short Scenario."
"We are ready to short below POC or long above hVn or loc Daily :)"
Bulls were getting stronger (especially on POC level and Market sentiment shifted to bullish).
A Long immediately above "loc D" Level could give us over 3%.
As i Wrote: Long above loc D or hVn. Long above hVn with nice retest :
🎯 👌 😎 2.6% till now.
All candles are closed above hVn and loc D was pierced through !
Eyes on loc-D Level. Currently a Long at retest of loc-D would be more plausible. But lets see what happens if the price reach loc-D again !
Here is the Original TA. Click on it and read all Updates ;)
Follow for more ideas/Signals.💲
Just donate some of your profit to Animal rights or other charity :)✌️

$SOL is showing strength on multiple timeframes.CRYPTOCAP:SOL is showing strength on multiple timeframes.
On the hourly chart, it has broken out of an inverse head & shoulders pattern with the neckline now acting as support a strong bullish signal.
On the 3-day chart, price has bounced from the lower boundary of a long-term expanding channel, suggesting a potential continuation toward the upper range.
Both short-term and macro structures are aligned for further upside. If momentum continues, a move toward $170 and beyond is possible.
This might be the calm before a major breakout.
Stay sharp.
Comment below if you want me to share the best long-term accumulation zones for $SOL.
#Solana

SOLUSDT NEXT MOVESell after bearish candle stick pattern, buy after bullish candle stick pattern....
Best bullish pattern , engulfing candle or green hammer
Best bearish pattern , engulfing candle or red shooting star
NOTE: IF YOU CAN'T SEE ANY OF TOP PATTERN IN THE ZONE DO NOT ENTER
Stop lost before pattern
R/R %1/%3
Trade in 5 Min Timeframe, use signals for scalping

SOLANA WILL RETURNCurrently, SOL is moving in bottom sides of a trendline which is not broken yet.
Despite being full of liquidity, this trendline for SOL might be the best opportuinty to buy for long term.
As long as the level 60$ is not broken, SOL will rise for a new all time high.
Remember, The Ecosystem of Solana build on casino. Gambler always return.
If SOL closes below the level of 60$ in weekly timeframe, the analysis is invalid and you can assume that SOL is diving through a bearish season.

SOLUSDT heading towards resistance 180SOLUSDT has bounce from monthly support MS1. A weekly support marked as WS1 on the chart is also sitting just above it. Therefore, this zone 95-110 was a confluece of these support levels and a bounce was justified. Now the price is heading towards weekly resistance which is sitting around 165-180 zone. However, it is facing daily resistance DR1 and currently pushing there. With a bit of struggle, it shall pierce through this DR1 resisatnce to head towards weekly resistance. And exactly above that weekly resistance, monthly resistance MR1 is also sitting with zone 180-200. Therefore, this is a confluence of the resistances and will cause the upward movement of the price to stall there and cause some push back. Lets see how it reacts there but if in long some profit taking on that resistance confluence zone is definitely a rational behavior.

Global Market Overview. Part 4.2: SOLANA
Solana: The American Blockchain Making a Comeback
(Previous post: )
Continuing from everything I’ve written earlier about Bitcoin and Ethereum, Solana deserves a separate spotlight.
Because this asset is a different story altogether. It’s not like Bitcoin. It’s not like Ethereum.
Solana has its own path, its own logic — and most importantly, its own market cycle, which follows a very different pattern of growth.
Why did Solana rally?
Let’s be blunt: Solana isn’t just a blockchain — it’s the epicenter of the new crypto cycle, where the main drivers weren’t decentralization or institutional capital, but memes, hype, and community.
Thousands of new tokens launched on Solana became the spark behind an explosion of interest.
The network surged with activity, and it was that real usage — not marketing — that pushed market cap higher.
But that’s not all.
Solana is Made in the USA.
And in crypto, just like in politics, that matters.
An American project, developed on U.S. soil, Solana quickly gained the trust of the largest and wealthiest crypto investor base in the world — American investors.
To be precise: it was the U.S. crypto community that pushed Solana into the mainstream.
And once funds and OTC brokers joined the party, it became clear — this asset isn’t going anywhere.
What about fundamentals?
Peak price: nearly $300
Growth from 2021 to 2024: one of the fastest in crypto
Network load: consistently high
Number of projects in the ecosystem: growing
Confirmed approval for a Solana ETF in the U.S.
Technological flexibility and strong developer support
U.S. jurisdiction: trusted by both institutions and retail
Why didn’t it crash with the rest of the market?
Here’s the twist: even as the crypto market was rocked by negative news and broad corrections, Solana held above $100.
That’s a key support level — and it held up under pressure from:
Trump’s tariff panic
Futures market liquidations
Capital outflows from other altcoins
Rising Bitcoin dominance
Yes, the price pulled back to the $130–140 range, but it never broke major support — a clear sign that strong hands haven’t let go.
But why hasn’t it gone higher if things are so good?
Simple: the Solana ETF hasn’t officially launched yet.
But once formal approval from the SEC is in place — the asset is set to explode.
We already saw a pump above $200 just on rumors.
Now the clock is ticking — when will rumor become reality?
And here’s a spoiler: the Solana ETF has already been approved.
In crypto, that’s how it goes — first the whispers, then insider info leaks, then the price runs.
And finally, when the official news drops — that’s when the real move starts.
We haven’t seen that final leg yet because of all the macro confusion over tariffs.
What’s next?
I’m not giving financial advice.
But here’s the reality — I bought Solana on the dip and I’m still buying.
Why?
Because I need to recover the $300K I lost on Ethereum
Because everything points to a continuation of the bull trend
Because no other major asset offers this kind of symmetry between fundamentals and upside potential
Solana isn’t a bubble.
It’s a trading platform for the meme economy — and one of the few blockchains where actual demand matches real scalability and low fees.
And in crypto, that means a lot.
My personal take
If you’ve got free cash right now — don’t be afraid to look Solana’s way.
I see no reason to fear this asset in the medium to long term.
The network is alive. The network is growing. The asset is holding strong.
Now all we need is the next trigger — and it will come.
The potential to see $200 again in the coming months?
Very real.

SOL/USDT:SIGNALHello friends
According to the price growth we had, you can see that the price is in a range and now, as it approaches the ceiling of the range, if it manages to break our channel, it can move to the specified targets.
*Trade safely with us*

SOLANACRYPTOCAP:SOL a clear 4H breaker block with a valid displacement. Lets see which one gets the first fill, either the short or a long : ).
GOOD LUCK !

SOLA Trendline support..
took liquidities.
weekly bullish english enngulfing
and also retested....
(not a buy sell recommendationns. just for annalysis)

SOLUSDT - Trade LogSOLUSDT – Long Setup in Daily FVG
Entry: Buy at 124 USDT (floor of the daily Fair Value Gap)
Stop Loss: 105 USDT (just below the daily FVG low)
Take Profit: 200 USDT (new all‑time highs)
Rationale:
• Price is retracing into the daily FVG, offering a high‑probability support zone
• Daily RSI double divergence & trendline support reinforce the FVG floor
• Spot accumulation targeting euphoria phase—leveraging the FVG for entry
Risk Management: Risk ~5% of account. If SOL closes below 105 USDT (invalidating the FVG), exit and reassess. Keep an eye on BTC direction as the primary driver.

SHORT SOLWe're approaching the end of the ending diagonal in wave C. One more leg up could complete the structure, potentially setting up a great opportunity to catch the big wave 5 move

Solana SOL Reveals The Manipulator's Plan!Hello, Skyrexians!
It's time to update BINANCE:SOLUSDT analysis. We have already told about Solana dump when price was next to $300 where told about $110 and as usual did not count last wave, but anyway bounce from this area was anticipated. What is next?
Recent top was the wave 5 of higher degree, we have shown it many times, today no need to do it again. Now asset is in ABC correction. Wave A was 5 waves shaped. Last wave has been finished with the green dot on the Bullish/Bearish Reversal Bar Indicator and now we are in the wave B. It has the target at 0.5-0.61 Fibonacci which is somewhere next to $200. From there we expect the huge crash below $90 in the wave C. Solana potential dump is not cancelling potential altseason on OTHERS.D because it's in top-10 crypto cap assets. May be it's time to transfer money from overvalued SOL to undervalued crypto?
Best regards,
Skyrexio Team
___________________________________________________________
Please, boost this article and subscribe our page if you like analysis!


we are heading towards massive rejection on sol.As I am short on solana massive rejection has been verified we are goin down to 126 atleast thats what i can see ,Remember what i said all of my analysis on confirmations not fomo's so lets see where we headed with this sort of volume,RSI isn`t in our favour this time but CIPHER B and daily volume and rejections has given us confirmations lets roll our dice.

#SOL/USDT Analysis📊 #SOL/USDT Analysis 📊
📉 CRYPTOCAP:SOL is currently testing the Daily Bearish IFVG zone.
🔹 I'm expecting a Buy-side Liquidity Grab first before entering any short positions — there's also a Bearish OB sitting right above as confluence.
🔻 Major Support: PMH $112

SOLWhile SOLANA is vastly choppy in the recent days, this idea is the closest I could get with an accurate trade. Y ou can see huge resistance with stored SSL which will likely get sweeped in the coming days as well as potentially fill the untapped breaker laying around the 140s zone as seen on the chart. Take profits as you find comfortable

SOLUSDT – Final Ascent Before the Abyss?"If this isn’t a trap, then FTX is still solvent."
📈 THE SCENE:
Solana’s looking bullish? Sure. So did Luna, Celsius, and Three Arrows before they became bedtime horror stories.
Price: Hovering around $134.5, acting like it’s immune to gravity.
VPVR: Volume cliff right below — there’s literally nothing until $128… then $118.
POC: $132.8 — aka the spot where poor souls entered late, juiced on hopium and influencer tweets.
🧠 THE DATA (a.k.a. The Smoking Gun):
OI climbing like it’s 2021, but without the bull market to back it.
Delta positive, yet price stagnant = buyers getting absorbed harder than WeWork’s liquidity.
Volume slowing = momentum fading = perfect setup for smart money to yank the rug.
📉 MACRO PERSPECTIVE (4H):
What do we see?
Long buildup without follow-through.
Price crawling up while BTC is on thin ice.
If Bitcoin sneezes, SOL's lungs collapse.
BTC below $84K = SOL going back to $120s faster than CZ deletes a tweet.
🎯 TRADE IDEA:
Short from $134.5–135.5
SL: $137.2 (because we respect market makers' yacht fund)
TP1: $128
TP2: $118
Leverage? Whatever makes your palms sweat and your broker call your therapist.
💬 FINAL WORDS:
“This rally feels about as real as Elizabeth Holmes’ biotech vision.
Everyone’s long. Everyone’s confident. Everyone’s... about to get margin called.”
Smart money isn’t buying this. They’re selling it... to you.
And when they dump, it’s not a correction — it’s a funeral procession with fireworks.

SOL - Some new TA- IO and CVD increased regarding last highs (15.04.) but price has not broken Local Daily line. This means Big Money is shorting the Local Daily and absorbing Longs.
- Price is going up while Volume (OBV and AD) is decreasing in almost every time frame. Again. Big money is selling heavily to the Longs. The probability that Whale Sellers get exhausted is high too!
- 1H:
Grey line would be a nice Short if we can catch it.
Price on 0.78 Fib.
Risky...
1H Chart :
Follow for more ideas/Signals.💲
Just donate some of your profit to Animal rights or other charity :)✌️
