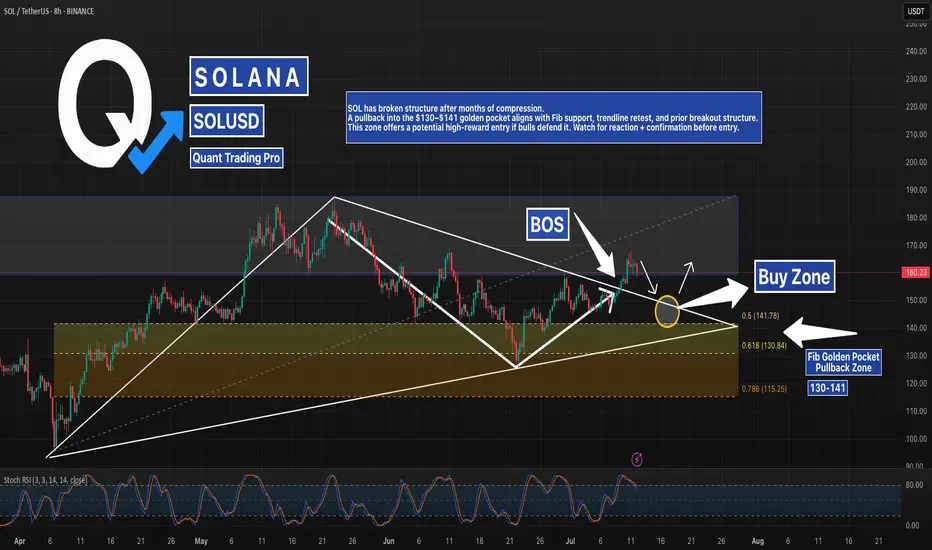
SOL Breakout Confirmed – Golden Pocket Pullback Next?Solana just posted a clean Break of Structure (BOS) from a long-term descending wedge and is now hovering above a major breakout zone. A deeper pullback into the Fib Golden Pocket (130–141) could present a high-conviction buy opportunity.
The confluence of:
0.5–0.618 Fib retracements
Rising wedge support
Previous breakout structure
…makes this area a prime “Buy Zone” to watch. A higher low here could fuel the next macro leg toward $190+.
📍 Key Levels:
Buy Zone: $130–$141
Resistance: $193.80
Support Trendline: Still intact
👀 Monitoring RSI oversold + reclaim signals for optimal entry.
#Solana #SOLUSD #GoldenPocket #Breakout #CryptoSetup #Fibonacci #QuantTradingPro #TradingView
SOLUSDT trade ideas
SOL Sell / Short SetupSell at cmp 163.49, 2nd entry mentioned and tp also mentioned, Must keep SL, best of luck.

SOL USDT SHORT TRADE SETUPSOL/USDT is currently holding at a strong resistance zone, with a high probability of an downward price move. Also RSI is overbought.

HolderStat┆SOLUSD seeks to the resistance lineBINANCE:SOLUSDT has broken out of a descending wedge and is coiling in a symmetrical triangle above 150. The setup supports a push toward 165–170, with momentum favoring bulls if the triangle resolves upward.

#SOL Update #3 – July 8, 2025🟠 #SOL Update #3 – July 8, 2025
Solana, much like Litecoin, is still undergoing corrections following its latest impulsive move. While it currently holds above a strong support level, two significant resistance zones are ahead.
The market is undecided, and Solana's direction remains uncertain, making it one of the riskiest assets to trade today.
If the $145 support fails, the price may drop toward $137. Conversely, a daily close above $159 could trigger a move toward $167. For now, it's best to stay on the sidelines and monitor the price action closely.

Monday, 7 July 2025 - SOL/USDT.P ShortTrading Journal Entry: SOL/USDT SHORT
Date of Entry: July 8, 2025
Asset: SOL/USDT Perpetual Futures
Position: SHORT
Entry Price: $149.40
Stop Loss: $153.50
Take Profit: $141.20
Risk/Reward Ratio: 2.00:1
Setup Grade: A+
1. Core Thesis
The trade is a high-confluence short position designed to capitalize on a probable breakdown of a key support level, driven by overwhelming bearish sentiment and a clear liquidity-based objective. The core thesis is that the market, having failed to show strength at a critical resistance point within a larger downtrend, is incentivized to purge the liquidity resting at the bottom of the local range.
2. High-Timeframe Context (The Strategic Landscape)
My analysis began with a top-down approach to understand the broader market environment.
Weekly Context: The market is in a multi-month corrective phase after a significant long-term uptrend. This indicates that the primary bullish momentum has stalled, making the market susceptible to deeper corrections and range-bound activity. Trading between major HTF zones is the governing dynamic.
Daily Context: The immediate trend on the daily chart is clearly bearish, defined by a series of lower highs and lower lows. This downtrend brought the price to a pivotal support zone identified by the Volume Profile Point of Control (POC) around $140-$145. This created the central conflict: a dominant bearish trend meeting a significant historical support level.
3. Order Flow & Sentiment Analysis (The Deciding Factor)
This layer of analysis was the key to resolving the trend vs. support conflict and solidified the bearish bias.
Liquidation Analysis: The liquidation maps revealed a very large and proximate pool of long liquidations concentrated around $145. This liquidity cluster acts as a powerful magnet for price, providing a clear, logical target for a downside move.
Funding Rate Analysis: Funding rates across the majority of major exchanges were negative. This provided clear evidence that derivative traders were predominantly positioned short and were willing to pay a premium to maintain those positions. In this context of price failing at resistance, it signaled strong bearish conviction and a market leaning heavily in one direction.
Synthesis: The presence of a large downside liquidity target (the "magnet") combined with dominant bearish sentiment (the "conviction") created a high-probability scenario for a breakdown. The path of least resistance was for the market to resolve the consolidation by pushing down to trigger the liquidity pool below.
4. Tactical Execution (The Entry Trigger)
With a firm directional bias, the final step was to find a low-risk entry.
4-Hour Structure: The price action leading into the entry was weak. The 4H chart showed a low-volume, corrective bounce that failed to decisively reclaim its Point of Control around $150. This lack of a strong rejection from the lows was a critical sign that buyers lacked control and that the support was fragile.
1-Hour Entry Pattern: I identified the perfect entry trigger on the 1H chart.
Price formed a tight consolidation pattern, building a clear support base around the $149.50 - $150.00 level.
The volume throughout this consolidation was visibly declining, indicating a coiling of energy before a volatile move.
My entry at $149.40 was a stop-limit order placed to trigger on a confirmed breakdown of this immediate support, allowing us to join the move with momentum.
5. Risk Management (The Trade's Foundation)
Stop Loss ($153.50): The SL was not an arbitrary price but a logical invalidation point. It was placed just above the structural high of the 1-hour consolidation range. A move to this level would have proven the breakdown thesis incorrect and signaled that buyers had absorbed the selling pressure.
Take Profit ($141.20): The TP was chosen for two reasons:
Rule Compliance: It mathematically secured my required 2:1 risk/reward ratio.
Strategic Placement: It sits just above the major daily support zone and the daily POC, increasing the probability of a fill before a significant HTF reaction and potential bounce.
This trade represents a textbook example of our strategy: using high-timeframe analysis to build a directional bias, confirming it with order flow and liquidity data, and executing with precision on a low-timeframe pattern, all while adhering to strict, non-negotiable risk management rules.

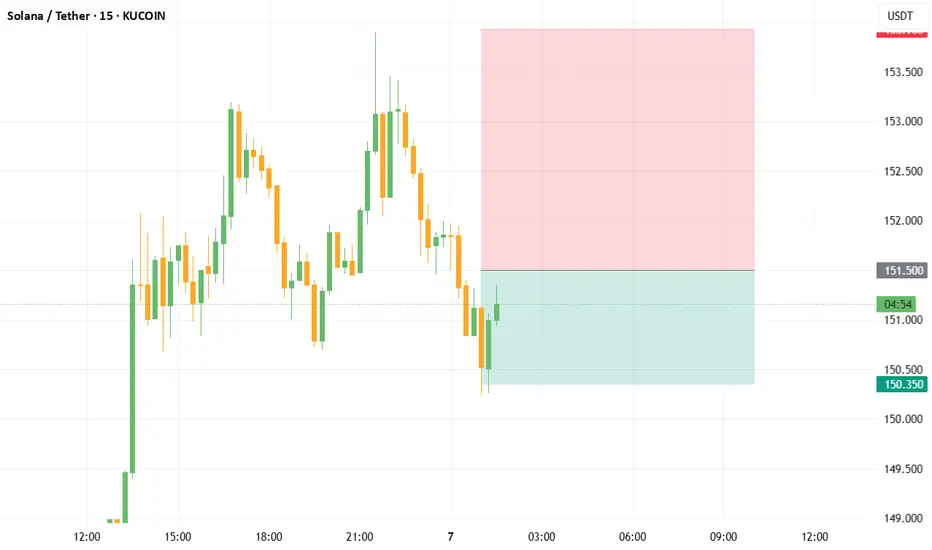
[SOLUSDT scalping short signal]- Signal: SHORT
- Entry: 151.300 ~ 151.500
- Take Profit: 150.820, 150.350
Chasing highs and lows is prohibited, so miss it;
Prohibit stop-loss operation, only to do "controlled static and dynamic resonance zone" within the transaction.
SOL USDT CAN BE BULLISH IN A WEEK Just my opinion not make tradeAt the time Sol USDT will trade in 147.50
My analysis this is spot level
I am not recommending to buy but I think this is the best move for sol

SOL/USDT Breakdown: Bearish Retest Sets Up ShortPrice action on SOL just confirmed a key structural shift 📉
The ascending trendline has been broken, and we’re now seeing a textbook bearish retest below prior support — which is flipping to resistance.
This setup suggests momentum is turning.
A lower high beneath the new downtrend line points to possible continuation toward the 132 zone.
• Trendline broken
• Retest in progress
• Short thesis active unless price reclaims 159+
This is not financial advice — just a breakdown of a technical idea based on structure and market behavior.
#SOL #CryptoTrading #TrendBreak #BearishSetup #TechnicalAnalysis #TradingView #QuantTradingPro

SOL/USDT : Strong Bullish Move Ahead?By analyzing the #Solana chart on the daily timeframe, we can see that the price is currently trading around $149.62. If the price holds above the key level of $146.28, we could expect the beginning of a strong bullish wave, potentially delivering over 25% short-term returns.
If this scenario plays out, the next bullish targets are $168.50, $187, $220, and $263.
(Personal research is strongly recommended for long-term investment decisions.)
Please support me with your likes and comments to motivate me to share more analysis with you and share your opinion about the possible trend of this chart with me !
Best Regards , Arman Shaban

HolderStat┆SOLUSD got out of the triangleBYBIT:SOLUSDT is trading in a well-structured upward channel with a history of consolidation zones acting as breakout springboards. The price recently bounced off trend support and now targets the resistance at 170. Structure remains bullish as higher lows continue to form.

SOLUSDT Holding Long Term Trendline SupportSOLUSDT continues to show strong bullish structure, with price consistently holding above a multi-year ascending trendline a key structural element that has defined its uptrend. This dynamic support has anchored price action within a broader ascending formation, reflecting steady long-term accumulation.
Additionally, the chart reveals a well defined Cup and Handle formation, further reinforcing the bullish outlook. As long as price respects the immediate demand zone, this area remains a prime region for re-accumulation, with expectations for it to hold as a firm support level.
The projected target for this setup is clearly illustrated on the chart, aligning with the broader bullish continuation narrative.
Share your view, do you see SOLUSDT pushing higher from here, or is a deeper retest likely before the breakout?

Exactly as I expected Lower low Love to see it as I plane 💯😬
The chart followed my plan so perfectly, I’m starting to worry it’s stalking me...
Like, chill Solana, I was just kidding when I said “do exactly this!” 😂📉📏

Can Solana reach $175 target after breaking $160 level?Hello,✌
let’s dive into a full analysis of the upcoming price potential for Solana 🔍📈.
BINANCE:SOLUSDT is approaching a crucial daily resistance level between $150 and $160. A clear break above this zone could lead to a 15% upside, with a target near $175 🚀. Keep an eye on volume for confirmation before entering the trade 📈.
✨ Need a little love !
We pour love into every post—your support keeps us inspired! 💛
Don’t be shy, drop a comment—we’d love to hear from you.
Big thanks , Mad Whale 🐋

Solana Will Grow Despite "3,200% Rally"Oh my god! Folks, this friend of ours is saying Solana is going down because of a "3,200% rally." Crazy stuff. Can it continue growing after a 3,200% rally? But he is ignoring a massive correction between January and April. How big is the correction you ask? 67%. Meaning, there is no need to mention the previous rally because it has been corrected already.
Ok, hold on... Let's breatheeeeee deeply first.
Solana ETFs. Growing Cryptocurrency market. Global adoption. Old finance finally waking up to the new financial system. Even banks are starting to buy Crypto and opening up a ramp for their customers to buy Crypto, Solana, using their savings and other funds. This is why it will grow.
Think of this. Think of Apple, Inc. when it was young. Think of Tesla and Google and Microsoft. Would you quit after a 3,000% rally? Well, these companies are still growing today. Crypto is no different, it will grow for decades to come. Solana is going up. 100% certainty, you can see it on the chart; the fundamentals as well.
Get on board the bullish train, it is not too late.
Everything money goes into Crypto. You will be happy with the results.
If you stay out, your loss.
Namaste.

Solana Price Poised to Explode — But Only If This Level BreaksThe chart shows Solana trading around $153.85 USDT after a corrective rally from the June lows. Overall market structure has shifted in recent sessions, highlighted by a clear Break of Structure (BOS) on June 29, which signaled the first real attempt to reclaim higher ground after persistent weakness. However, the price has now approached a cluster of supply zones, which could either trigger a further rally if absorbed or mark a fresh rejection.
Above the current level, you can see strong red zones between 160–180 USDT, representing prior swing high supply and institutional sell interest. These are areas where large sellers previously stepped in to push price lower, so if Solana fails to break above this region with convincing volume, sellers may become more active again. In contrast, the nearest major demand zone sits around 137–140 USDT, highlighted in blue. This zone has acted as a key support and liquidity pocket where price has rebounded multiple times.
The Smart Money Concepts on the chart, including frequent CHoCH (Change of Character) and EQ/CHoCH labels, indicate that liquidity sweeps and engineered reversals have been common. This suggests the market may be preparing to hunt stops above recent highs or below recent lows before committing to a longer-term move.
At this point, the trend bias is cautiously neutral to bullish in the short term because the BOS suggests an attempt to reclaim higher levels. However, this bullish bias remains unconfirmed until Solana cleanly breaks and holds above 160–170 USDT. If sellers defend that area, the market could revert to the 137–140 zone.
Below is a clear trade scenario based on what the chart is showing:
Potential Trade Setup (Not Financial Advice)
Scenario: Short from Supply Resistance
o Entry: 153.85–154.35 USDT (currently being tested)
o Stop Loss: Above 160 USDT (invalidates bearish rejection)
o Take Profit Target: 137–140 USDT demand zone
Alternatively, if Solana rejects and returns to retest demand, this would offer a possible buy scenario for traders looking to play the rebound:
Scenario: Long from Demand
o Entry: 137–140 USDT demand zone
o Stop Loss: Below 135 USDT (confirms demand failure)
o Take Profit Target 1: 153.85 USDT resistance retest
o Take Profit Target 2: 170 USDT upper supply
At the moment, the price is balanced between these zones, so a wait-and-see approach can help confirm whether supply breaks or holds. A clean break above 160 USDT with strong momentum could invalidate the short idea and favor continuation higher toward the upper supply region around 170–180 USDT.
In summary, the chart structure is showing early signs of potential accumulation but still faces significant overhead resistance. Careful confirmation around the 154–160 level is critical before committing to either direction. If you’d like, I can help you refine these plans further or overlay additional indicators like volume or moving averages for extra confirmation.

HolderStat┆SOLUSD confirmed the breachBINANCE:SOLUSDT rebounded sharply from the 145 region and broke above descending trendline resistance. Now holding the retest zone, it’s coiling for a move toward 164 in a classic breakout continuation setup.

#SOL/USDTSOLANA →
The price is moving within a descending channel on the 1-hour frame and is expected to break and continue upward.
We have a trend to stabilize above the 100 moving average once again.
We have a downtrend on the RSI indicator that supports the upward move with a breakout.
We have a support area at the lower limit of the channel at 142, acting as strong support from which the price can rebound.
Entry price: 144
First target: 146
Second target: 149
Third target: 152
For risk management, please don't forget stop loss and capital management
When we reach the first target, save some profit and then change the stop to entry
Comment if you have any questions
Thank You

$SOL Bullish Breakout from Falling Channel | Eyeing $180 NextSolana (SOL) has broken out of its falling channel on the daily timeframe, indicating a potential trend reversal. After the initial breakout, SOL made a successful retest of the channel. However, it faced rejection at the 200 EMA, which is now acting as a critical resistance level.
Currently, SOL is attempting a second retest of the 200 EMA. If it breaks and holds above this dynamic resistance, we could see a swift move toward the next major target at $180, with potential to eventually revisit the previous all-time high near $260.
Supporting the bullish outlook:
📈 RSI is showing bullish divergence, confirming upward momentum.
📊 Price action is forming higher lows, establishing a clean uptrend structure.
🔍 Key level to watch: $156 resistance. A daily close above this could confirm the next leg up.
📌 Key Levels:
Resistance to break: $156
Short-term target: $180
Extended target: $260
EMA to watch: 200 EMA (Daily)

SOLUSDT Bullish Flag Pattern!Price has formed a Bullish Flag pattern on the daily timeframe. After multiple touches of both support and resistance, the price has now broken out above the falg resistance, signaling a potential trend reversal. and price trading above 50 and 100 EMA
Currently, SOL is bouncing from the channel breakout level, indicating strong bullish momentum. A clean breakout candle confirms buying interest, and the setup favors a strong bullish continuation if the breakout sustains.
Entry: Above $150
Stop-loss: Below $135
CRYPTOCAP:SOL TRADENATION:SOLANA

SOL - He sees everything!Ironically - It took my local SL and went up, but now it have two moves - two moves means either on the down bottom to top or moves directly on the top as said!

80% drop into the abyss for Solana? - July 2025** The months ahead **
Examination of the 3-week chart for SOLANA reveals several compelling technical signals that suggest a potential bearish trend reversal. This analysis highlights crucial patterns traders and investors of Solana should consider.
1. Formation of a 3-Week Death Cross:
A notable bearish signal prints on the chart: a ‘3-week death cross’. This follows a ‘2-week death cross’ that preceded a significant downward movement, just as in early 2022. The death cross, where a shorter-term moving average crosses below a longer-term one, is a strong indicator of a shift towards a bearish trend, especially on higher timeframes like this 3-week chart.
2. Broken Market Structure:
The chart clearly indicates a “broken market structure.” This typically occurs when the price fails to create higher highs and higher lows during an uptrend, or in this case, breaks below a significant support level that had previously held. It is absolutely possible price action backtests past support for a resistance confirmation, however on looking left, such a test never occurred on the last death cross.
3. Resistance from Previous Peaks (Head and Shoulders Pattern):
Price action leading up to the recent highs resembles a potential ‘Head and Shoulders’ pattern. The three distinct peaks, with the middle peak being the highest, suggest a classic reversal pattern. A subsequent break below the ‘neckline’ (implied support level below the peaks) would confirm the bearish outlook.
4. RSI Oscillator (bottom of chart) resistance
The lower panel of the chart displays an RSI oscillator indicator, which shows a clear pattern of "resistance." following a period of support since 2023. The RSI has clearly confirmed resistance from almost 3 years of support.
5. Solana vs Bitcoin
All the bearish observations made on the SOL-USD trading pair can be observed on the same 3 week time frame for the SOLANA - BITCOIN trading pair:
6. Potential for Significant Downside Target:
Based on the measured move from the previous death cross and breakdown and Fibonacci extension, the chart illustrates a potential downside target of approximately -70% from current levels toward the $30-40 area. While this is a projected target and not guaranteed, the historical precedent following similar bearish signals provides a context for the potential severity of the downturn if the bearish momentum continues.
Conclusion:
Considering the confluence of a 3-week death cross, broken market structure, resistance from previous peaks (suggesting a potential Head and Shoulders pattern), and the confirmation of RSI resistance, the outlook for SOLANA on the 3-week timeframe appears distinctly bearish.
Is it possible price action continues upwards after a 3200% rally? Sure.
Is it probable? No
Ww
