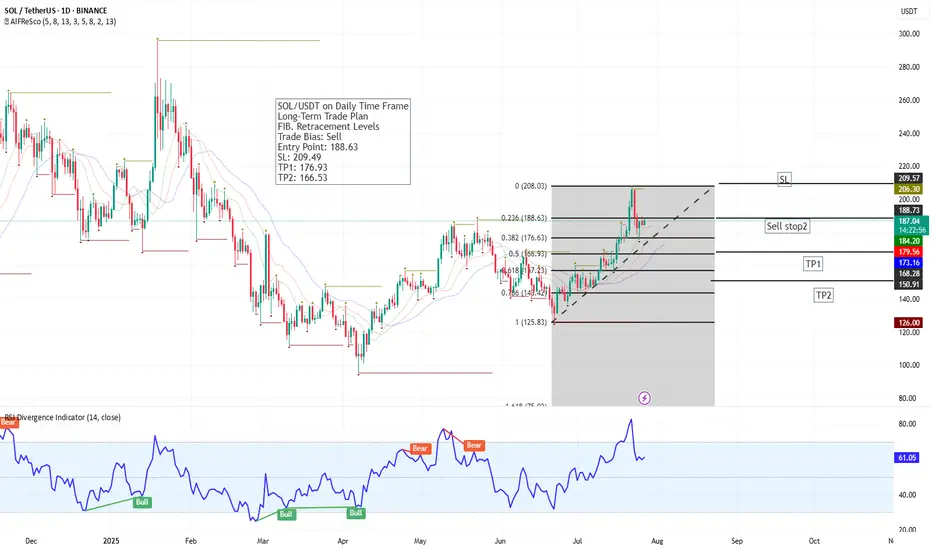
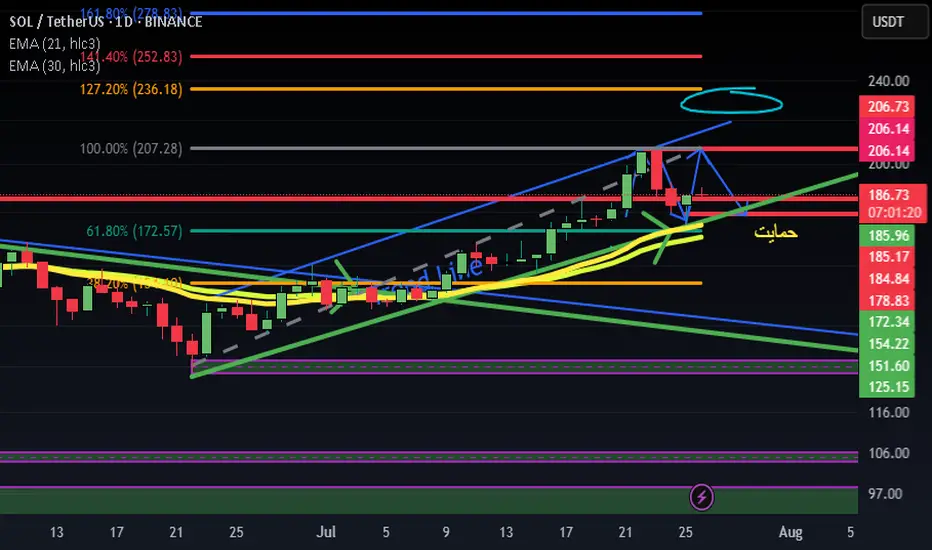
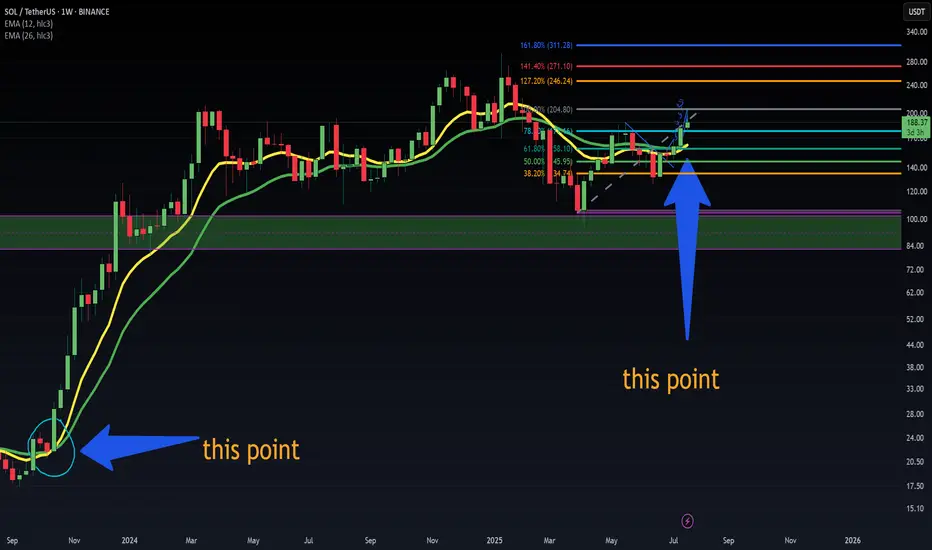
SOL/USDT – Daily Chart | Long-Term Fibonacci Sell SetupSOL has completed a strong bullish leg and is now reacting from the 0.236 Fibonacci retracement level at 188.63. A sell setup is developing based on this resistance zone and weakening momentum.
🔻 Trade Plan:
Sell Stop: 188.63
SL: 209.49
TP1: 176.93 (38.2% Fib)
TP2: 166.53 (50% Fib)
📉 RSI at 61.02 shows early signs of a bearish divergence. If price loses momentum at current levels, this setup could offer a solid retracement trade toward the mid-Fibonacci levels.
Watch for breakdown confirmation and manage risk accordingly.
SOLUSDT trade ideas
new theoryi have new theory i change rsi lenght to 1 and i see over buy and over sell zone in short term what your idea when rsi reach above 70 we sell and open a short position after reach over sell zone we close the sell position and open a long position in future we make big money
signal of buyingthis is morning star we need this cadle! i see a morning star candle in one day
this is strong bulish signal what is your idea>?
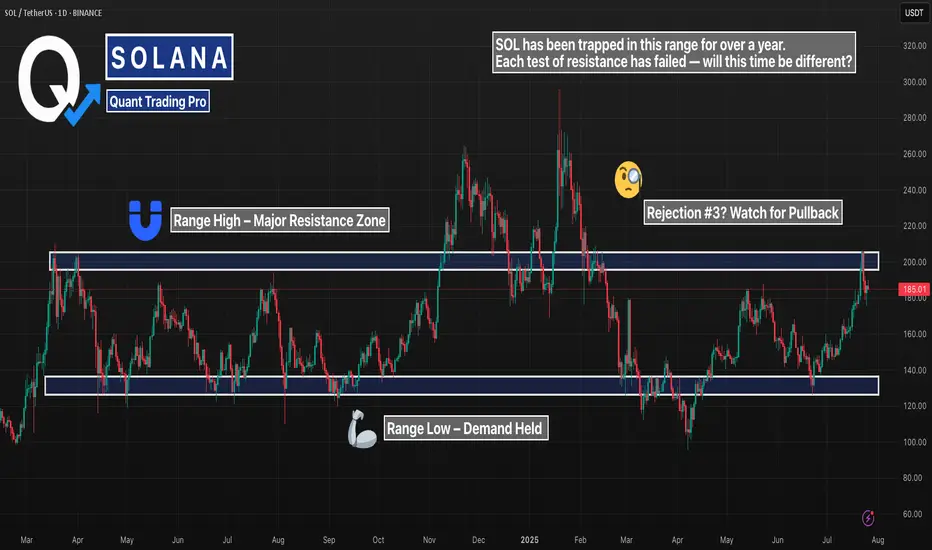
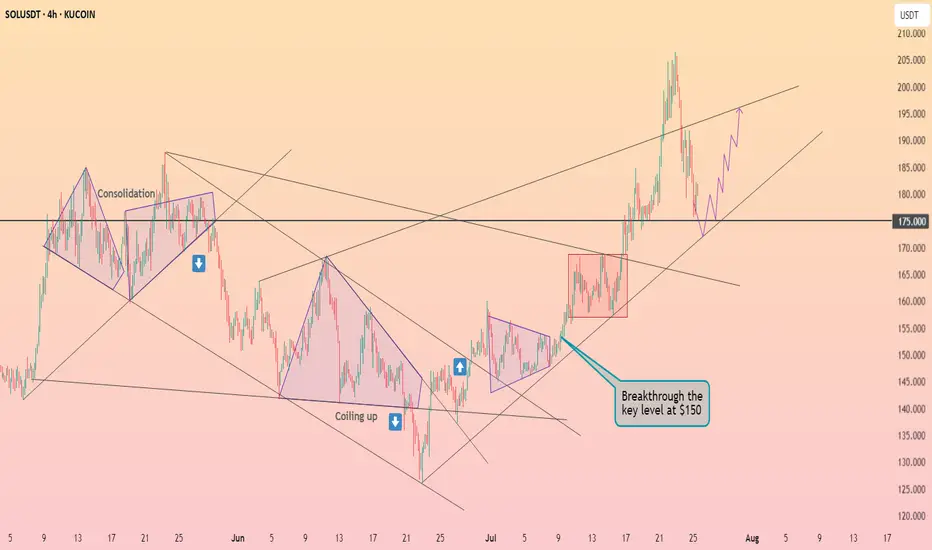
SOL 1D – Range High Rejected… Again?Solana just tapped major resistance — the same level that’s capped every rally since early 2024. This is now the third clean rejection off the $200 zone, and the structure couldn’t be more clear:
– Long-standing range between $115 and $200
– Previous rejections at the top led to full retracements
– This latest attempt? Rejected again — for now
If bulls want to flip the script, they’ll need a confirmed breakout with volume and a clean retest. Otherwise, this chart is screaming “range still intact.”
Until proven otherwise, this zone remains supply-heavy. Keep your risk tight — the next leg could move fast.
#Solana #SOL #RangeTrading #ResistanceZone #CryptoAnalysis #TechnicalBreakdown #QuantTradingPro #PriceAction
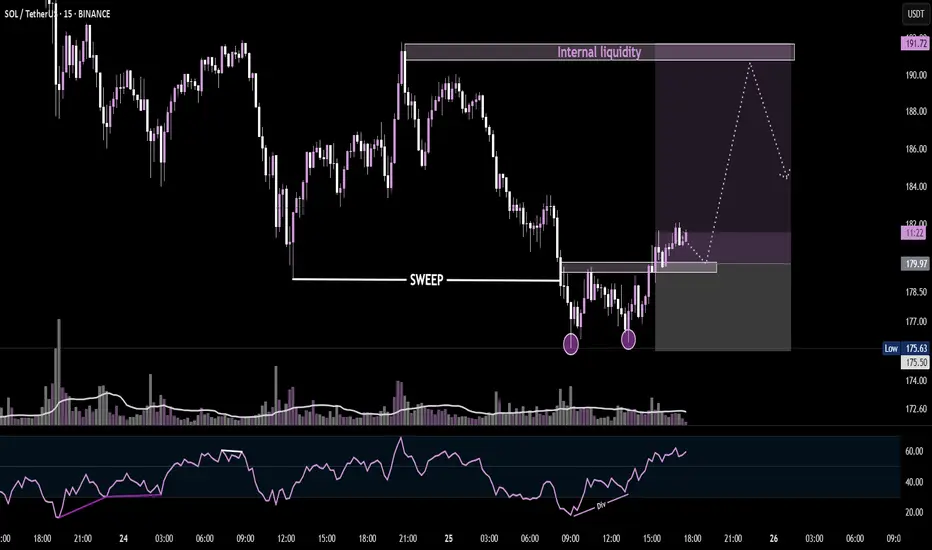
SOL/USDT - 15MINrice swept previous lows, formed a double bottom with bullish RSI divergence, and is now consolidating above the sweep zone. If support holds, we may see a rally into the internal liquidity zone around $191. Keep an eye on structure and volume confirmation for the next leg up.

Just like #AKRM, #SOL can also pump 100%Just like #AKRM, #SOL can also pump 100%..
SOL will also have this kind of exit rally. Whether there is a war between the US, Iran, and Israel or not, the market will crash very badly.

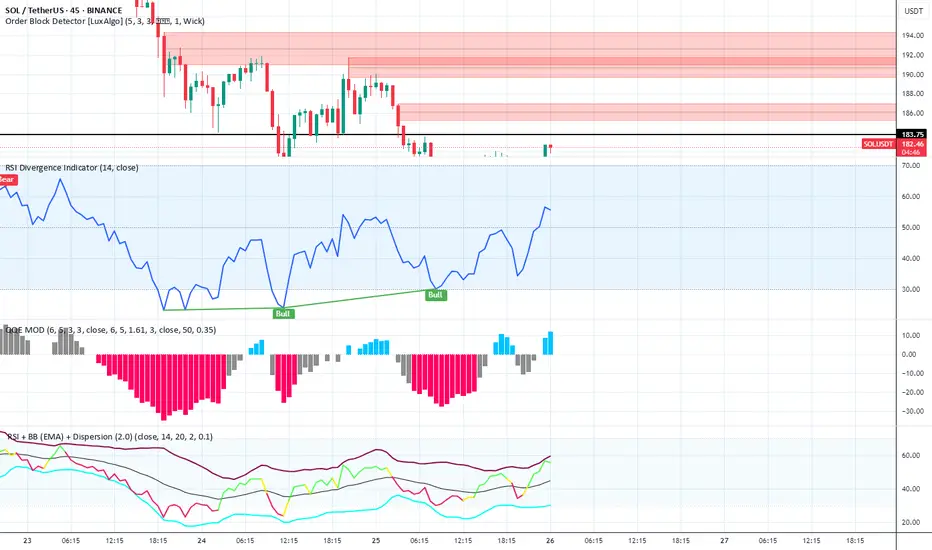
Vijay D - Smart Order Block + RSI Divergence Reversal SuiteIndicators Used in the Setup
Order Block Detector
Settings: (5, 3, 3), 1 Wick
Function: Highlights institutional order blocks to identify high-probability supply/demand zones.
Chart Insight: Multiple bearish order blocks marked in red between $186–$194, confirming strong overhead resistance. Price is reacting at the lower boundary (~$183.75), showing signs of rejection.
RSI Divergence Indicator (14)
Settings: 14-period RSI
Function: Detects bullish and bearish divergences between price and RSI.
Chart Insight: Bullish Divergence identified — price made a lower low while RSI made a higher low, signaling a potential trend reversal or bullish bounce.
QQE MOD
Settings: (6, 5, 3), Smoothing: 6.5, RSI Length: 14
Function: A momentum oscillator derived from RSI with smoothing and histogram representation.
Chart Insight:
Histogram flipped from red (bearish) to blue (bullish).
Bullish transition suggests increasing momentum in favor of bulls.
TSI – BB (EMA) + Dispersion
Function: Combines True Strength Index with Bollinger Band (EMA-based) and dispersion overlays.
Chart Insight:
TSI is rising toward midline with narrowing dispersion bands.
Indicates a potential volatility contraction before an expansion — likely upside if TSI crosses above signal.
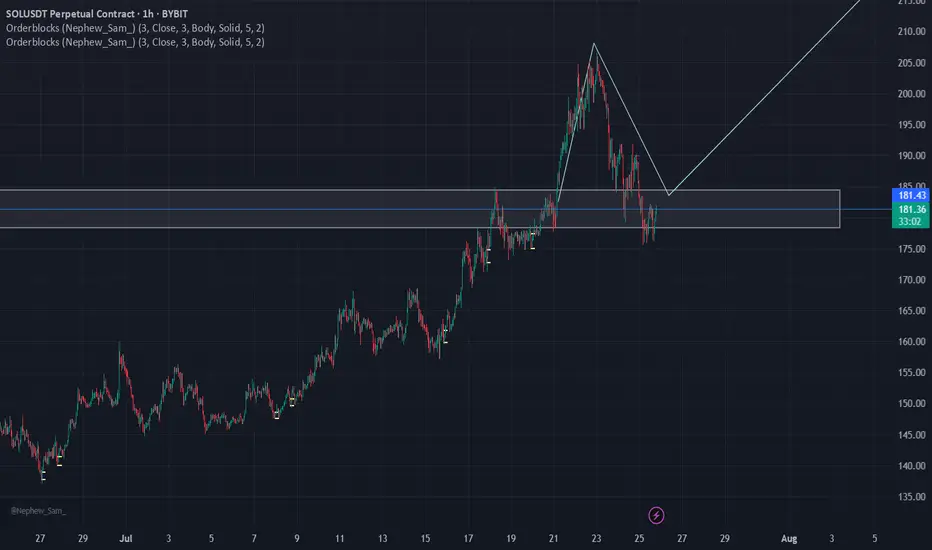
SOL LONGSolana is bouncing off the support level and the ascending trendline. Bullish movement is expected to continue and reach $205
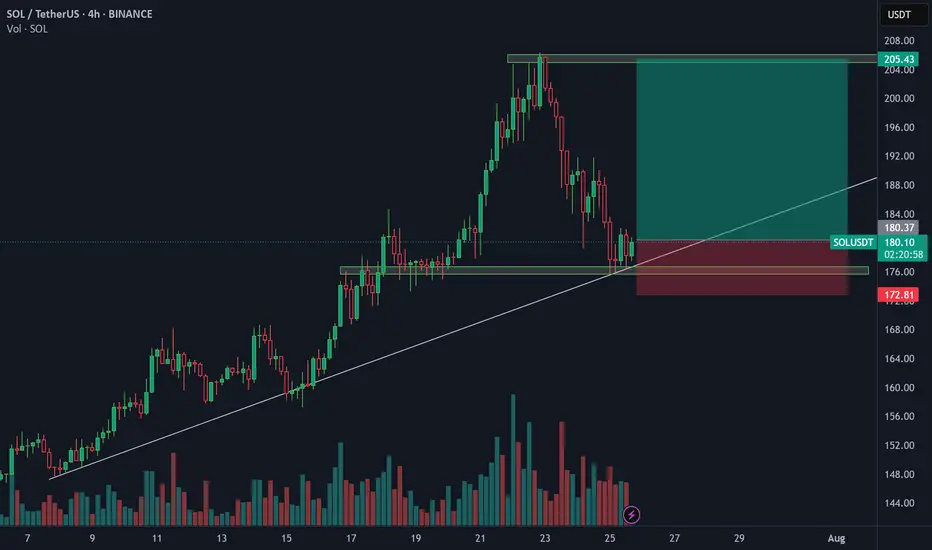
Solana is bouncing back from $175 ┆ HolderStatOKX:SOLUSDT is testing the $180 barrier. Breakout could extend gains to $186. If rejected, $172–$173 may act as reentry zone. Market structure favors continuation.
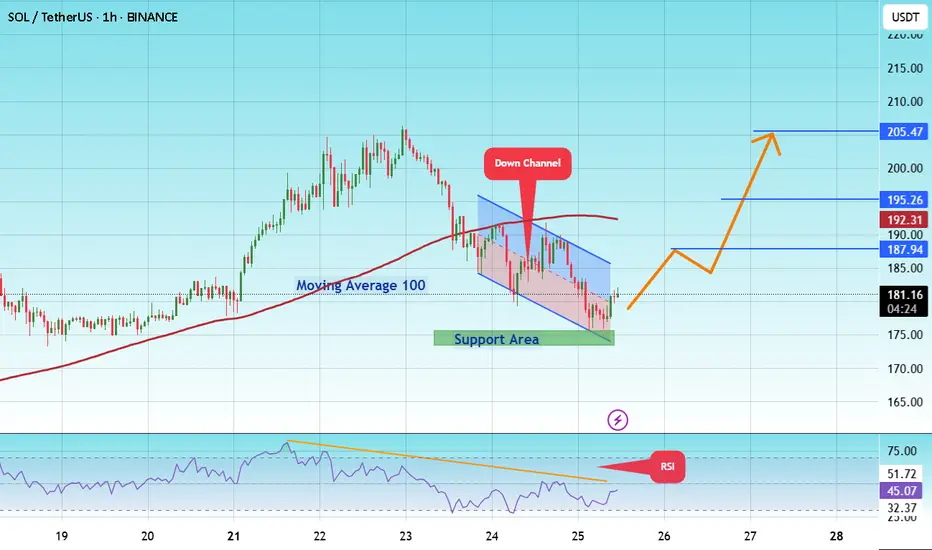
#SOL/USDT coin market structure analysis#SOL
The price is moving within a descending channel on the 1-hour frame and is expected to break and continue upward.
We have a trend to stabilize above the 100 moving average again.
We have a downtrend on the RSI indicator that supports the upward move with a breakout.
We have a support area at the lower boundary of the channel at 175, acting as strong support from which the price can rebound.
We have a major support area in green that pushed the price upward at 174.
Entry price: 181.
First target: 187.
Second target: 195.
Third target: 205.
To manage risk, don't forget stop loss and capital management.
When you reach the first target, save some profits and then change the stop order to an entry order.
For inquiries, please comment.
Thank you.
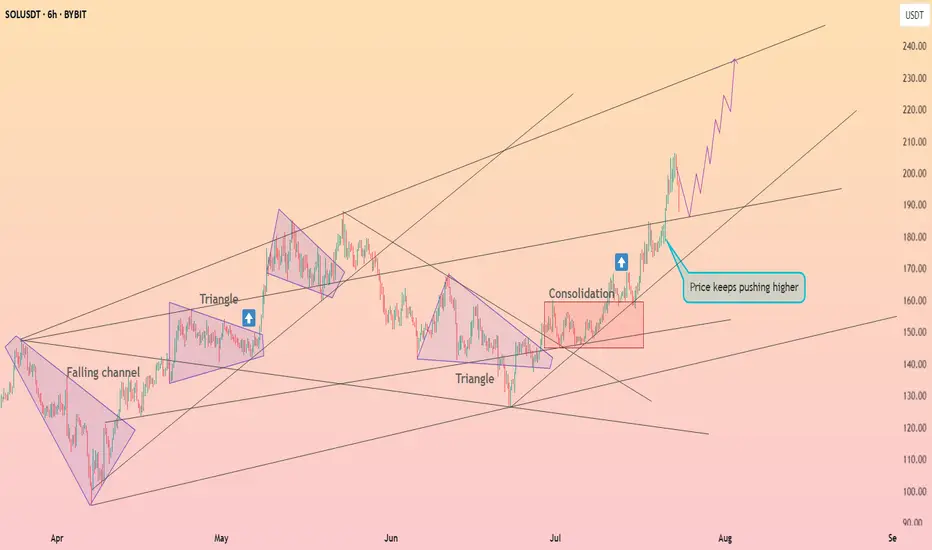
SOLANA UPDATEHello friends🙌
📉Given the decline we had, you can see that buyers came in and supported the price and were able to change the trend and create an ascending channel.
📈Now, considering that the price is hitting higher ceilings and floors, we can expect an ascending wave until the ceiling of the channel.
Don't forget risk and capital management.⚠
🔥Follow us for more signals🔥
*Trade safely with us*
Solana is preparing to breakthrough $200 ┆ HolderStatOKX:SOLUSDT is trapped between $172 and $180. Break above $180 may unlock $188+. Watch for volume breakout.
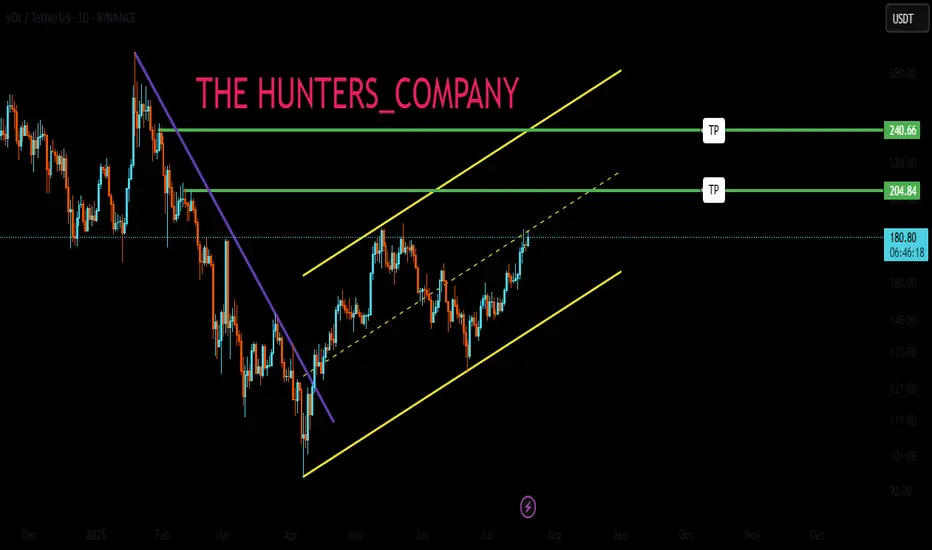
SO LONG : Next Target $220 ZoneSOL price successfully broke above the 200 resistance zone.
Trend bias is upwards currently with the next projected resistance around 225 USD
Solusdt bullish daily time frame A bullish iH&S/cup&handle pattern is forming. A close above 168 may activate the pattern.
Targets are 180, 200 and 220
Invalidation if closes below 157

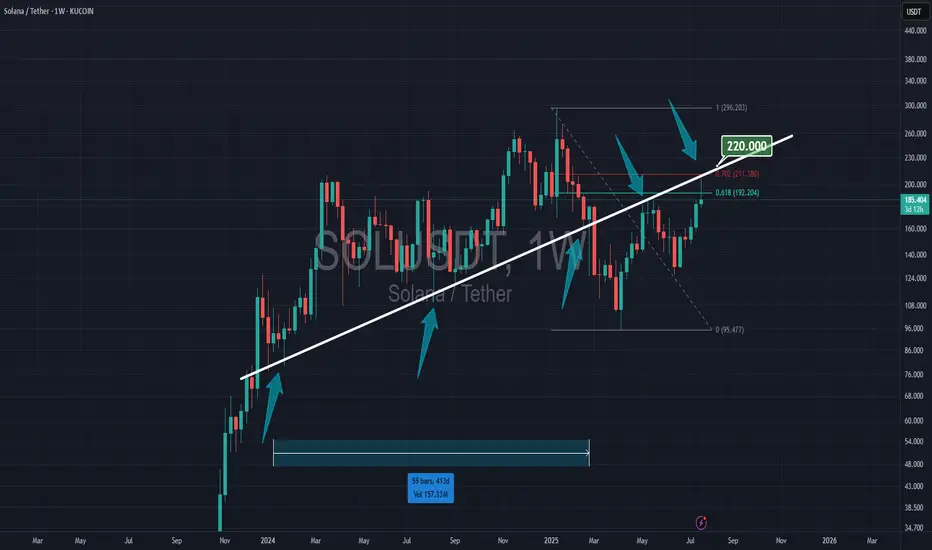
SOLANA & 220 RESISTANCESolana is at 61% of Fibonacci, and the trendline has held since early 2024. To stay in the bull run, Solana must break the 220 resistance.
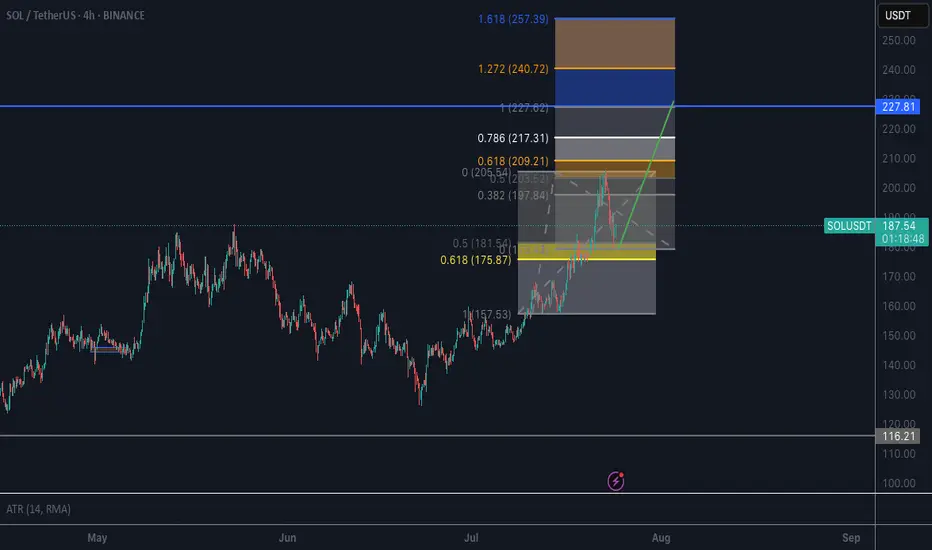
SOL Uptrend Update➡️ Solana has been correcting for the last couple of days, but the trend is clearly up.
➡️ There are 2 confluence factors that should give price support: the gray ascending trendline and the green zone.
➡️ Initial Targets (purple lines) are:
218.45 (100% extension)
258.79 (beginning of blue potential supply zone)

Analysis Of SOLUSDT
Why buy? market still on the bullish side this analysis is based by technical of SMC (OB,FGV) and Fibonaci
Stay Safu

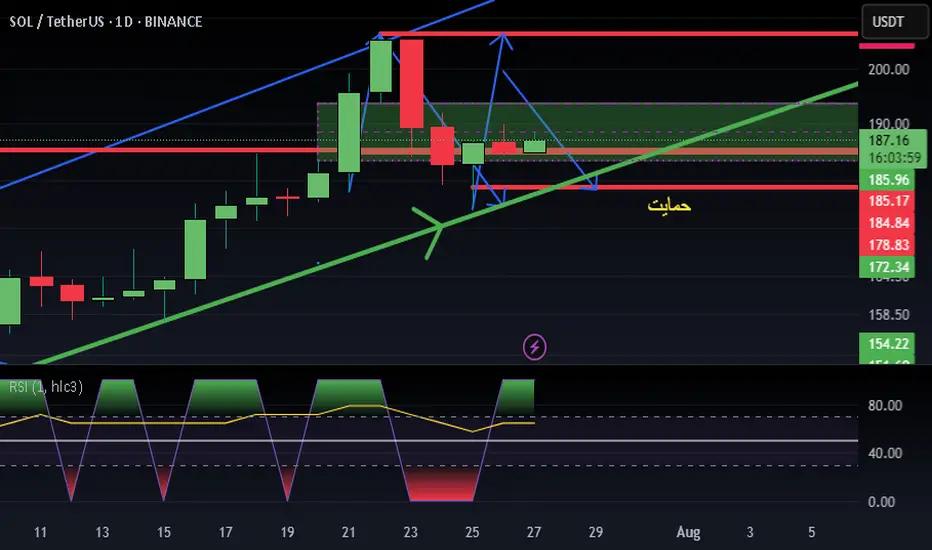
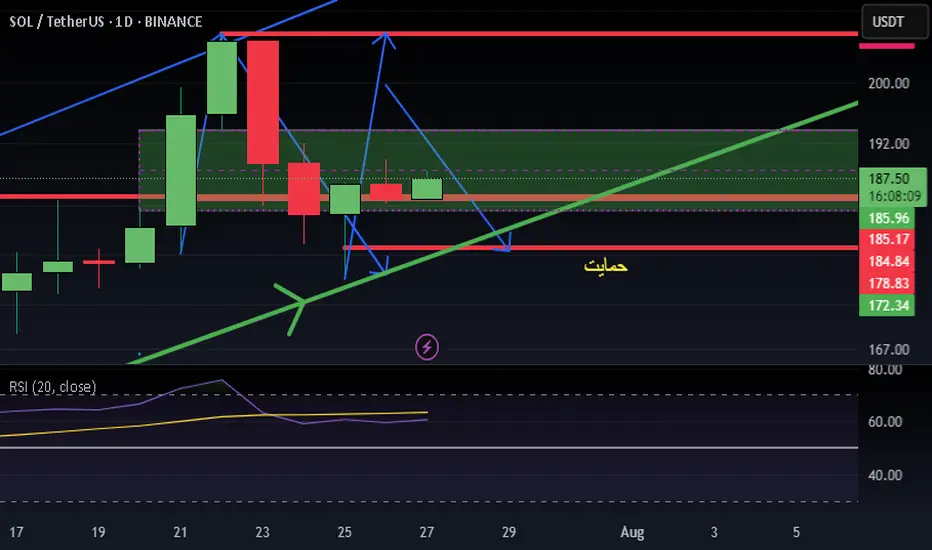
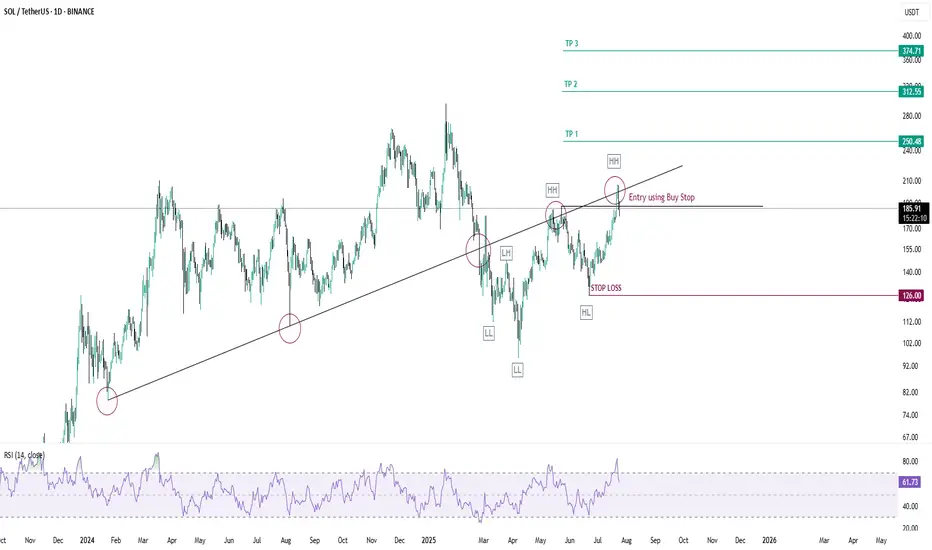
SOLUSDT-LONG IDEASOLUSDT has broken its trendline toward downside and now the structure is broken forming a higher highs and higher lows and reason behind its rejection is trendline but the structure is clearly bullish, trendline has gotten tapped two time now it has become weak take your entries using buy stop order it will give you great return again its a positional trade so if you have patience only then take this trade it will not gonna boom overnight stop loss entry and take profit points are mentioned in the chart.
need a green candleif a green candle apear we se morning star candle but hope still not dea!just a green candle
