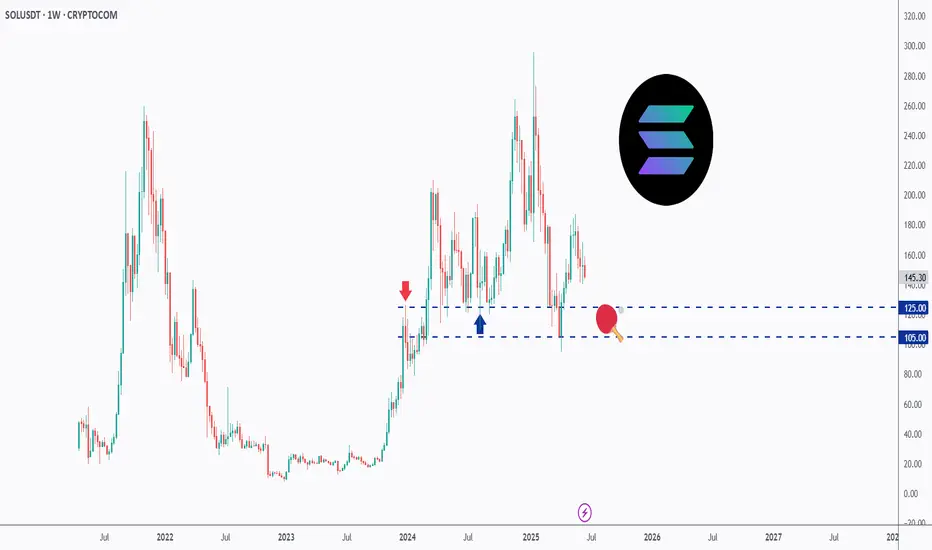
SOL - Playing Ping Pong!Hello TradingView Family / Fellow Traders. This is Richard, also known as theSignalyst.
📈SOL has been trading within a range between $100 and $200 round number.
And it is currently retesting the lower bound of the range which has been acting as a magnet lately.
As SOL approaches the $105 - $125 support zone, and as long as the $105 support holds, we will be looking for longs targeting the $200 round number.
📚 Always follow your trading plan regarding entry, risk management, and trade management.
Good luck!
All Strategies Are Good; If Managed Properly!
~Rich
SOLUSDT trade ideas
an eye for an eye! a SOUL for a SOLI dont know i like that SOL and what i wish it moves in the way, just wait for a sweep below to move, keep targets of 160 on the sweep!
Solana (SOL): Re-Testing Major Moving Average Line | 200 EMASolana has reached the 200EMA line on the daily timeframe, which has been broken recently after a long rally to upper zones. We caught 2 possible trades here, where one would be 1:5 RR and the second one would be 1:3 RR.
More in-depth info is in the video—enjoy!
Swallow Academy

Solana scalp shortRecently opened a scalp short position on solana. The market structurally is at LL point in usual market continuation but we having a big sell off it seems so could push lower down to $144.35 area before we get a bounce. In the event though I get stop I"ll look for a re-entry as $144.35 is like area to get tested before any major upside.

HolderStat┆SOLUSD successfully retested the supportBYBIT:SOLUSDT is springing off the 148 mid-channel rail inside a descending-flag bust, shifting retrace into rally restart. Protecting the trend-line keeps bulls in control; clearing 158 opens 172-180 pursuit 🌞

Weekly trading plan for SolanaBINANCE:SOLUSDT The price is already below the weekly pivot point. After updating the last bottom, the price may continue its downward movement. There are some level crossings so it is possible to reach them. More details in the video idea
Write a comment with your coins & hit the like button and I will make an analysis for you
The author's opinion may differ from yours,
Consider your risks.
Wish you successful trades ! mura

#SOL/USDT#SOL
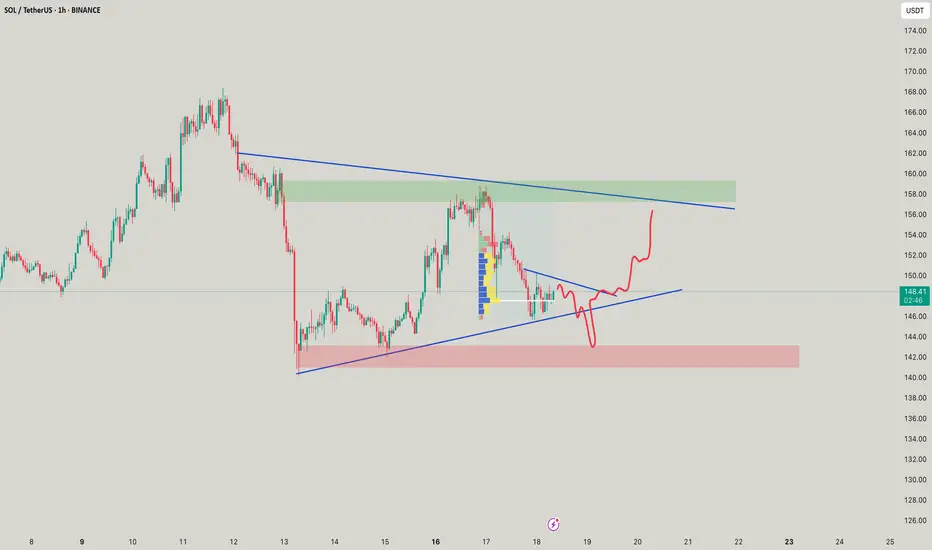
The price is moving within a descending channel on the 1-hour frame, adhering well to it, and is heading for a strong breakout and retest.
We are experiencing a rebound from the lower boundary of the descending channel. This support is at 149.
We are experiencing a downtrend on the RSI indicator, which is about to break and retest, supporting the upward trend.
We are heading for stability above the 100 moving average.
Entry price: 153
First target: 155
Second target: 159
Third target: 162

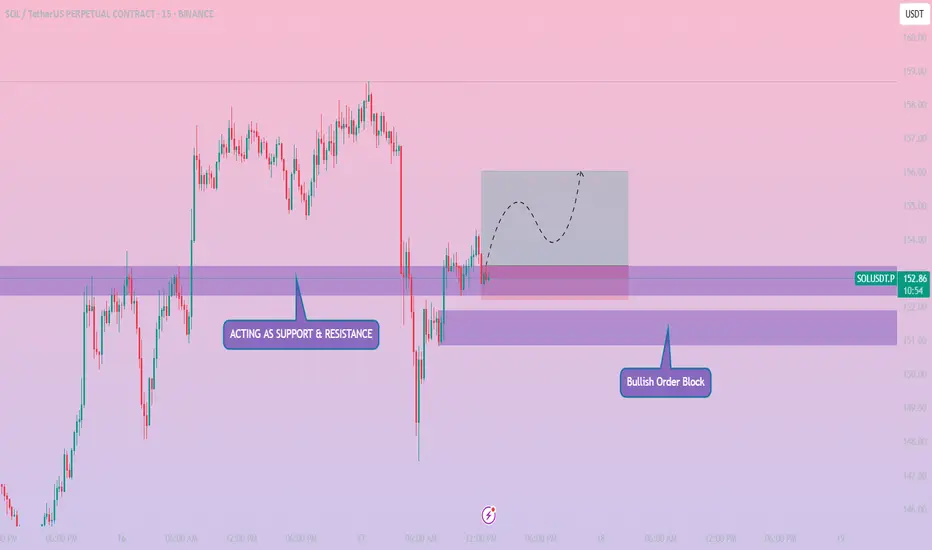
SOLUSDT // 15M // LONGPrice tapped into a previous support zone which is now acting as support & resistance flip, showing early signs of a bullish structure shift.
Just below, a clearly defined Bullish Order Block between ~151.00 and 152.20 is providing institutional demand, which strengthens this zone further.
The current entry sits slightly above this confluence, giving a high-probability long setup.
📈 Expected Price Path: Anticipating a possible liquidity grab, internal pullback inside the grey box, followed by continuation toward target liquidity around 156.00+.
🔹 Entry: 153.23 (Market Execution)
🎯 Take Profit (TP): 156.02
🛑 Stop Loss (SL): 152.22
📊 Risk-Reward Ratio (RRR): ~1:2.53

Impulse without purpose? Not in Smart Money termsSOL didn’t just break structure — it filled inefficiency and positioned above. Now price is sitting in the upper FVG, where decisions are made — not guesses.
What just happened:
Price rallied from the OB below and left an IFVG in its wake
Current price is hovering at the edge of a higher FVG, right where liquidity rests from trapped shorts
The move is complete — now it’s about what price does next in this zone of intent
From here, two paths:
Sweep into FVG, reject, and rotate back down toward the 154–147.4 range
React bullishly from mid-FVG, reclaim structure → break to new internal high and keep running
The OB down at 145 is still valid if price unwinds — that’s where Smart Money bids.
Execution view:
Rejection from 158–159 = short bias down to 147–145
Clean invalidation above FVG high
If price consolidates at 154 and reclaims → setup flips bullish
The setup isn’t about what price did — it’s about what it’s preparing for.
You want more trades like this — precision zones, mapped logic — check the profile description.

SOL | Key Demand Zone Retest in PlayBINANCE:SOLUSDT has pulled back into a major demand zone, following rejection from a local supply block. This zone previously acted as the base of the last impulsive move and now presents a critical level for a bullish reversal.
🟩 Key Demand Zone: $135–$125
• Valid demand cluster from April expansion
• Looking for bullish reversal signs or SFP before confirming entry
• Invalidates below $122.75
📌 Trade Setup (if confirmed):
• Entry near $125–130
• Target: $220 (79% upside)
• SL: Below $122.75
• R:R ≈ 4.88
🟥 Invalidation:
• Clean break below $122.75 = structure break
• Bearish continuation toward $102–105 zone
📌 This is the zone to look for strength — weak bounce = stand aside. Strong reaction = high R:R opportunity.

#SOL/USDT#SOL
The price is moving within a descending channel on the 1-hour frame, adhering well to it, and is heading for a strong breakout and retest.
We are experiencing a rebound from the lower boundary of the descending channel. This support is at 142.
We are experiencing a downtrend on the RSI indicator, which is about to break and retest, supporting the upward trend.
We are heading for stability above the 100 moving average.
Entry price: 144
First target: 149
Second target: 153
Third target: 157

Solana to crash with btc 97k pullback?Solana could have been bottomed, but since btc likely to crash next. Then Solana 130$ is likely next

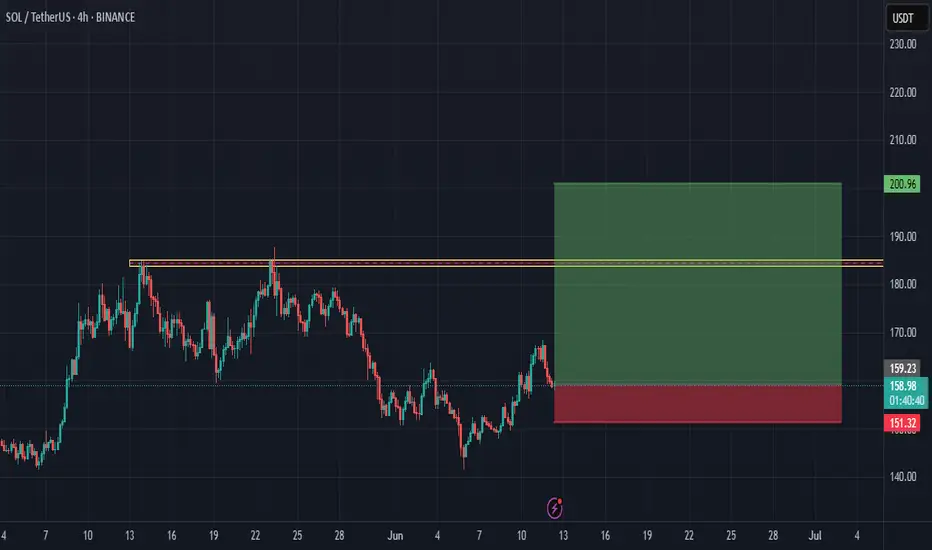
SOLUSDT Perpetual–High R:R Short Setup from Key Resistance ZoneSOLUSDT printed a strong bullish impulse candle, reaching a key resistance zone around $151.76, where a short position has been opened, anticipating a potential reversal.
Trade Details:
Position: Short
Entry: $151.76
Stop Loss: $153.17 (0.88%)
Take Profit: $142.05 (6.44%)
Risk/Reward Ratio: 7.3, highly favorable for intraday or swing shorts
Setup Rationale:
Price tapped into a potential supply zone / previous resistance
Sharp move up without pullback may indicate overextension
Ideal for traders using a fade-the-pump or reversal-based strategy
This setup relies on a quick rejection from resistance, with tight risk control and a deep profit target — a clean and efficient play for high-risk:reward traders.

SOLUSDT Forming Bullish FlagSOLUSDT is currently forming a classic bullish flag pattern on the chart, which is often seen as a continuation pattern indicating the potential for a strong breakout to the upside. The price has consolidated within a tight range following a significant upward move, creating a flag-shaped formation that typically precedes the next wave higher. This structure is being supported by solid volume behavior, which is an essential confirmation for bullish breakouts. Based on historical performance and technical projections, a 50% to 60% gain could be on the horizon if this pattern resolves upward.
Solana (SOL) has remained one of the strongest-performing layer-1 blockchain projects in the market, and current investor sentiment is highly favorable. With recent developments in its ecosystem and increased institutional interest, SOL continues to attract substantial inflows. The bullish flag pattern aligns perfectly with the broader market optimism and technical indicators such as RSI and MACD that are showing early signs of renewed momentum.
Traders should watch closely for a breakout above the flag's resistance line, as this could trigger a new wave of buying pressure. Key levels to monitor include the breakout point and potential price targets around the previous highs and Fibonacci extensions. The market structure remains bullish, and if confirmed by volume and market momentum, SOLUSDT may offer one of the most attractive risk-reward setups in the current crypto landscape.
In summary, SOLUSDT is technically poised for another rally, supported by a bullish flag and growing interest from both retail and institutional investors. With a favorable risk profile and strong fundamentals, this is a setup that many traders will be watching in the coming days.
✅ Show your support by hitting the like button and
✅ Leaving a comment below! (What is You opinion about this Coin)
Your feedback and engagement keep me inspired to share more insightful market analysis with you!

SOLUSDT | The Final Liquidity Hunt | $250 is the Next StopSOLUSDT is currently in an uptrend after recently breaking out of its extended downtrend to $95 which took out millions of long positions. Now, we are seeing yet another extended downtrend on the lower time frame, but the overall direction is still up.
Last week, price action printed two very bullish pinbars at the $155 level which could have been considered support, where price was consolidating around late April. High leverage traders entered here and eventually got liquidated last Friday.
Following the liquidity hunt, price reversed quickly, but not strong enough to reclaim the $155 zone. Many of those who were liquidated likely re-entered on this fast move, thinking that the liquidity hunt is over and price cannot move lower.
I am anticipating one FINAL move down to $140 before the uptrend resumes. This will be the move that takes out the dumb money and where smart money will take their positions. The alternative is that the liquidity hunt never happens, and price breaks out of the falling wedge to resume its uptrend.
What about macro and micro factors?
⚖️ Ripple vs SEC Case
On 8th May, both parties agreed to settle, which ignited a massive market-wide rally. Unfortunately, their filings were rejected due to a procedural issue. The next deadline for refiling is on 16th June. Once accepted, we can expect another massive rally.
🤝 US-China Trade Talks
This week, US and China will meet at the negotiation table again. On 12th May, US & China reached a deal in Geneva and sent markets on another rally. IF (big if) they come to another deal this time, we can expect another rally.
✂️ Fed Rate Cut Expectations
The Fed talked about cutting interest rates in late 2025. They are currently in a "wait and see" stance however, due to uncertainties. Eventually we will see a rate cut, and I believe this would be a "buy the rumor, sell the news" event. Markets will price in the anticipated rate cut before it happens later this year.
Our first price target is $250.

They saw a crash. I saw where the next rally beginsThis isn’t chaos. It’s sequence. SOL sold off into a well-defined 1H OB, paired with a high-volume low. Price didn’t break. It anchored.
The setup:
After an aggressive dump, price settled into an Order Block between 140–143. This isn’t weakness. It’s rebalancing. Right above? A perfect FVG at 149 and inefficiency zones that align with liquidity draws at 152 and 160.
Volume is telling — it spiked into the OB, not on exit. That’s how Smart Money positions.
Expectation:
Accumulation near the OB → quick reversal → reclaim 145
From there, watch price reprice through:
TP1: 149 (FVG reclaim)
TP2: 152 (full inefficiency fill)
TP3: 160 (external liquidity sweep)
Any deeper dip below 140 becomes a deviation — not a breakdown — unless structure is violated with follow-through.
Execution:
Entry: 141–143 zone
SL: Below 139.8
TP1: 149
TP2: 152
Final: 160
This is engineered — not emotional.
Final thought:
“You don’t need to predict the bottom. You just need to know where price is built to return.”

Short trade
Pair: SOLUSDT
Trade Type: Sell-side trade
Date: Sunday, 15th June 2025
Time: 1:00 AM
Session: Tokyo Session
Entry Timeframe: 15min TF
📍 Trade Details
Entry Price: 147.33
Profit Level: 144.54 (1.89%)
Stop Level: 148.19 (0.58%)
Risk-to-Reward Ratio (RR): 3.19
🧠 Context / Trade Notes
Trade executed during the Tokyo session, known for lower liquidity and often used to fade exaggerated price moves from the prior sessions. Price tapped into a minor supply zone formed during the late NY session, showing early signs of sell-side intent.
1Hr TF Overview

#SOL/USDT#SOL
The price is moving within a descending channel on the 1-hour frame and is expected to break and continue upward.
We have a trend to stabilize above the 100 moving average once again.
We have a downtrend on the RSI indicator that supports the upward move by breaking it upward.
We have a support area at the lower limit of the channel at 148, acting as strong support from which the price can rebound.
Entry price: 153
First target: 156
Second target: 159
Third target: 162

Solana Weekly TF, Good NewsI've gone deeper into Solana's chart and I have good news... You are looking at the weekly timeframe.
I looked at EMA34 and MA200 for some of the major Crypto projects, Bitcoin, Dogecoin, XRP, Cardano and Ethereum. You can find these in my profile @MasterAnanda.
Some were clearly bullish as the action was happening above both moving averages, others were mixed and one was bearish.
Solana is trading below EMA34 weekly but safely above MA200.
MA200 weekly sits at $100 for SOLUSDT.
There is another level of relevance, EMA89. On this chart shown as a blue line and this is the good news. EMA89 is working as support, it worked last week and this week it still holds. This same level matches perfectly the 0.5 Fib. retracement support relative to the move from 7-April to 19-May.
This is all to say that we are looking at a strong support zone, which means that it is likely to hold. If it breaks, it should be brief followed by a recovery right away.
Namaste.

Solana breakout incomingSol preparing for massive big move, war kinda be monitored, and markets dont care anymore. send it

SOLUSDT H4 12th Juneresistance specified which is touched two times. I think that the resistance would break and SOL hit 200$
War Shakes Markets: SOL Dips Below Key Support — What’s Next?Solana (SOL) bulls are sweating. After a rough 3% daily drop, SOL has decisively broken below the critical $149–$150 support zone, with price currently hovering around $144. A powerful rejection from the $160 level last week now appears to be more than just a dip—it’s starting to resemble a trend reversal.
But that’s not all. There’s a geopolitical tremor behind the technicals.
Macro Heat: Israel–Iran Conflict Sends Shockwaves
Global markets are rattled after Israel’s latest strike on Iranian military facilities, prompting a missile-heavy retaliation from Tehran. As investors flee risk assets, the “war premium” is being priced into everything—from oil and gold to crypto.
This risk-off sentiment is putting extra pressure on altcoins like SOL, especially those already at key technical inflection points.
The Chart in Focus
Here’s the real-time breakdown:
Price Action: SOL has closed below the $149.81 support (a previous consolidation base). That zone is now likely to flip into resistance.
Volume: 24H volume remains elevated (273M+), suggesting sellers are still active—not just a low-liquidity dip.
RSI: The RSI is sitting at 37.99, creeping toward oversold territory but not there yet—leaving room for further downside.
Next Target: If momentum continues, all eyes are on the $124.50 level — a well-tested demand zone and potential bounce point.
The blue arrow on the chart isn’t just aesthetic—it’s a warning.
What to Watch Next
A daily close below $142 would solidify the breakdown and make a drop to the $124–$125 range highly probable.
However, if SOL reclaims $149 with strong volume, it could trap bears and launch a relief rally.
Keep an eye on macro headlines. If the Israel–Iran conflict escalates, expect more risk-off moves across the cryptocurrency market. Solana, like most altcoins, doesn't thrive in global uncertainty.
Conclusion:
The break below $149 isn’t just technical—it’s emotional. As fear grips markets globally, SOL is caught in the crossfire. Risk management matters now more than ever.
