SOL is preparing for new ATHSOL / USDT
Solana didn't make a move since long time but i think its time will come very soon
Currently SOL is trying to breakout the most important key level in chart
Breaking out here => very high chance of making a new ATH
For those who interested in SOL …its the time
SOLUSDT trade ideas

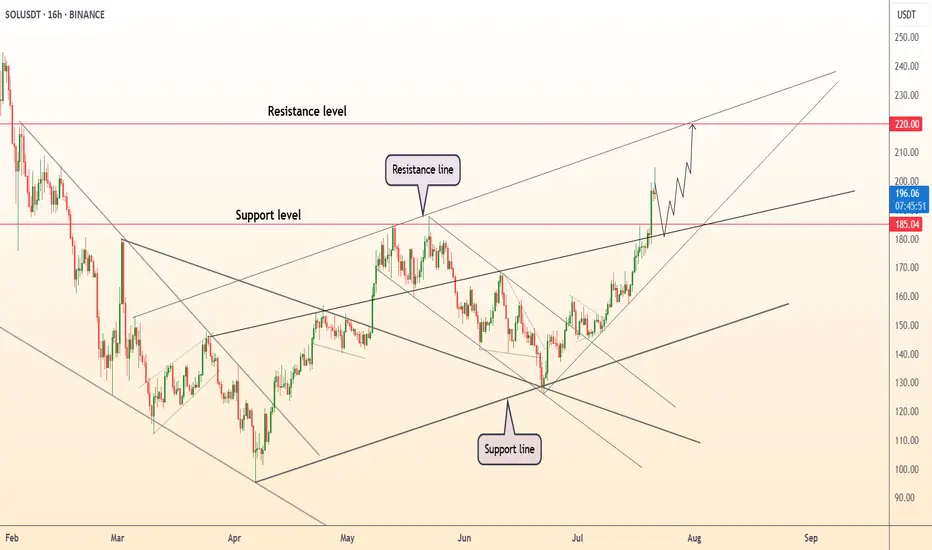
DeGRAM | SOLUSD seeks to the $220 level📊 Technical Analysis
● After reclaiming the mid-June swing cap 185 (now support) price accelerated along a steep parabolic fan; the move completed a 1:1 extension of the early-July flag yet leaves room to the channel crest near 220.
● Structure shows successive closes above the March–July internal resistance line; momentum pull-backs are respecting the fan base at 190, indicating healthy trend continuation toward the next fib / rail confluence at 219-222.
💡 Fundamental Analysis
● FXStreet notes Solana’s daily active addresses just hit a 12-month high, while CoinShares reports a fourth straight week of SOL-focused ETP inflows—evidence of strengthening network use and institutional demand.
✨ Summary
Buy 190-195; hold above 185 eyes 205 ▶ 220. Long thesis void on a 16 h close below 175.
-------------------
Share your opinion in the comments and support the idea with a like. Thanks for your support!
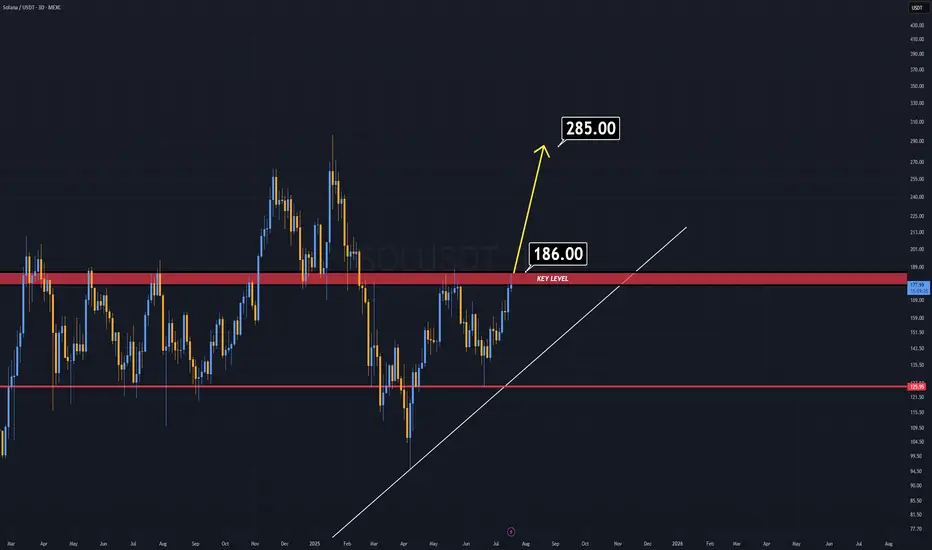
SOL Analysis (3D)There is no need to explain why if you are in this market for a while.
A weekly candle close above $186 will ignite a rally on SOL.
The important key word in here is "weekly" , not "daily" .
Good Luck.
Solana Bearish?Sol looking juicy to short from here, it already made 1 hourly big down candles and bearish market structure

Solana About To Gain Bullish Momentum Towards $420, Later $1000+It seems like Solana has been taking forever to grow, to recover; it seems like a long time. Let's do some maths. The bottom was in 7-April and we are now on July 21. 98 days. A little over three months. That is how long it has taken Solana to move back above $200. Seeing that the all-time high is $295, this isn't a long time, we are getting close to resistance and this resistance will break easily just as it happened with Bitcoin. Solana is set to grow to $420 mid-term and this bull market is likely to give us a target of $620 and potentially $1,000. $1,000 is the bright spot we want to hit on the bull run phase.
Why aim so high? Because the correction was really small in comparison to Solana's major bullish cycle since 2022. Solana crashed and crashed really hard but this hard-crash led to the strongest bullish cycle ever. Only in January 2025 did Solana stop too breathe and it did so by doing a 60% drop-market flush. With this drop over, Solana can produce the continuation of its long-term, eternal bullish cycle. Higher and higher, week after week, month after month.
If you are a Solana holder I just want to tell you to be patient on this pair. All the gains that have not been done in the past will be fulfilled in a matter of days. Solana will catch up with the rest of the giants and grow strong. Once Solana is up there at a new all-time high, the rest of the market will continue to grow.
Think of Solana behaving just like Bitcoin; when it reaches high up, instead of crashing we can experience some consolidation followed by additional growth. When we are close to the true cycle top, money will flow out of these big projects into the smaller ones, creating a major bull run.
All is good and perfect and it is early still today. Think about it, would it be late to buy below $200 when you know the potential is 1K?
Thanks a lot for your continued support.
Namaste.

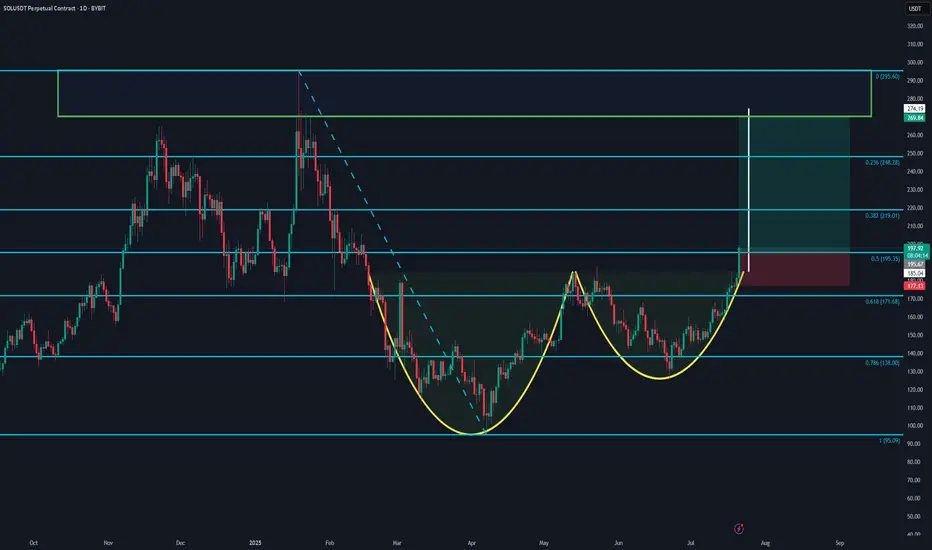
SOLUSDT - Cup and Handle Formation Targeting $295A classic Cup and Handle pattern is forming on the daily chart of SOLUSDT. The breakout above the $195 neckline signals potential continuation toward the $295 target, based on the depth of the cup.
🔹 Key levels:
Entry: $196
Stop Loss: $177
TP1: $219 (Fib 0.382)
TP2: $248 (Fib 0.236)
TP3: $274 - $295 (full target zone)
📊 The Fibonacci retracement levels align well with potential resistance zones. A clean breakout and daily close above $200 could further validate this setup.
Not financial advice. DYOR.
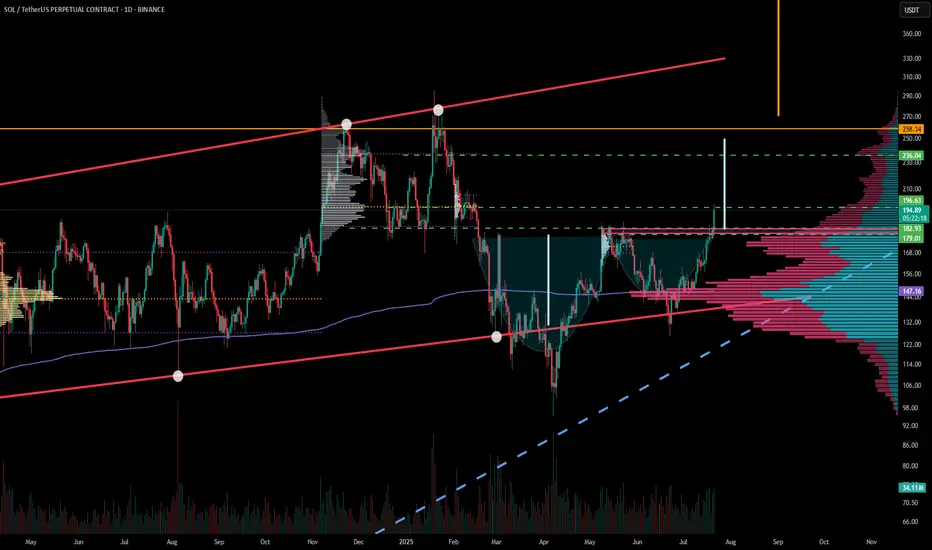
SOL / USDT - Current ThoughtsSolana’s been stealing the spotlight again and not just for the memes this time!
After months of getting smacked down at key levels, it’s finally reclaiming the lost ground with conviction. Price is grinding its way through zones that had been solid resistance for ages, flipping sentiment along the way.
The combination of structure, volume, and market psychology paints a clear story here. Let's break it down piece by piece in simple terms.
———x———x———x———
Table of Contents
⦿ Volume Profile
⦿ Key Technical Levels & Insights
⦿ Market Structure
———x———x———x———
⦿ Volume Profile
The Volume Profile offers crucial insight into where meaningful participation has taken place throughout this range and how these levels continue to influence the current structure.
Point of Control (POC) – ~145 USDT
This is the level where the highest volume changed hands during the entire consolidation. In simple terms, this is where buyers and sellers were most active in establishing positions.
The POC is like a price magnet where the market finds equilibrium when direction becomes uncertain. If bulls lose momentum, the price may gravitate back towards it.
Value Area Low – ~123.50 USDT
Below this threshold, prior market interest thinned out significantly. A breakdown here would likely accelerate downside as it signals acceptance below value, typically inviting stronger bearish flows and forcing trapped longs to capitulate.
Value Area High – ~213 USDT
This area marks a logical short-term upside target if the current rally can sustain its footing. VAH is where the prior range began to thin out and sellers historically pushed back. If buyers want to reclaim control, this is a key level to watch.
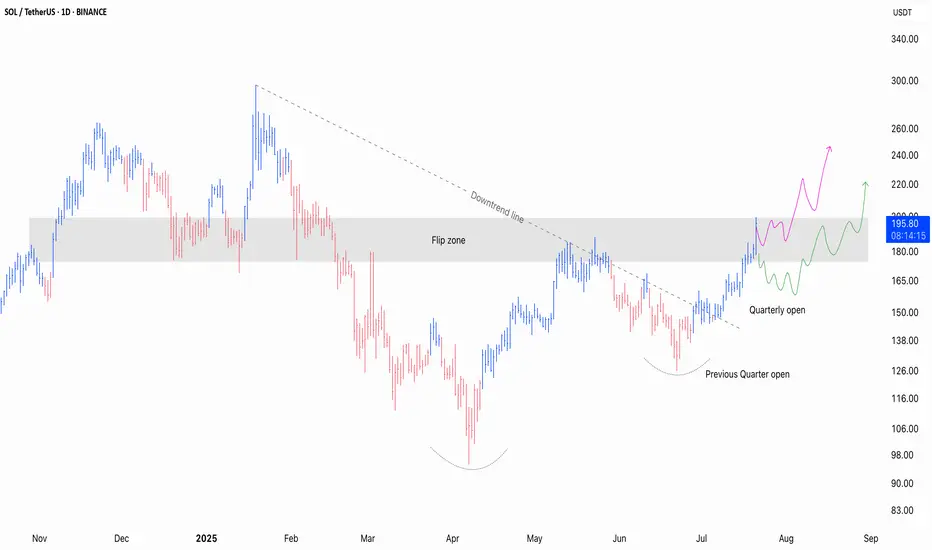
Currently, the price has cleanly reclaimed the POC and is now pressing into what I’d define as the Flip Zone (an area where former resistance is getting retested as potential support). Acceptance above the VAH will lead a rally towards the ATH.
⦿ Key Technical Levels & Insights
Several key factors are aligning here to create a compelling case and it’s about the broader narrative these levels are constructing together.
Quarterly Open – ~150 USDT
The recent breakout and push above the QO shows a clear intent buyers' intent. It’s a important reference point for ongoing structure.
Yearly Open – ~188 USDT
Reclaiming the Yearly Open is rarely a trivial event. Currently, the price is flirting with the YO. If the price manages to reclaim it with a strong push, it'll shift the broader sentiment back in favour of the bulls.
Flip Zone – 175–190 USDT
This zone has historically been a battleground, serving as both support and resistance since March 2024. A clean breakout above this zone won't just clear resistance, it'll open the door for further upside as sidelined participants as well as trapped shorts will be forced to react.
Downtrend Line – Broken
The trend line that was established earlier this year has been breached now, adding another positive factor for the bulls.
200 EMA / 200 SMA – ~163 USDT
Both KMAs are converging here, adding weight to this level as a reference for long-term trend direction. Price reclaiming and holding above these MAs often signals a meaningful shift in market sentiment.
The confluence of reclaiming major opens, breaking downtrend resistance, and positioning above critical moving averages strengthens the bullish case.
⦿ Market Structure
The current structure shows a market transitioning from bearish exhaustion, through a phase of accumulation, and now stepping confidently into breakout territory.
Double Bottom Formation (April lows ~95 USDT to recent highs):
This is a textbook accumulation. It’s not a fast V-shape reversal but a slow build. These kinds of structures often lay the groundwork for sustained trends.
Higher Lows in Place: 95 → 126 → 150 → 190 USDT
Each successive low is higher than the last, showing consistent buyer strength and deliberate positioning by participants with a longer-term view.
Breakout Above Prior Range Highs (187–190 USDT):
This area acted as clear resistance in previous attempts, capping price for months. Once this range is reclaimed with force, expect higher prices for multiple weeks/months.
TLDR
✅ Current Bias: Bullish while above 175–190 USDT.
✅ Structure: Breakout of multi-month downtrend, reclaiming key levels.
✅ Volume: Strong above POC, targeting Value Area High next.
✅ Invalidation: Failure below 150 USDT flips bias back to bearish.
I’m only focused on bullish continuation or healthy pullback scenarios for now, as I plan to keep holding my existing spot positions.
If you found this breakdown helpful, drop a like and let me know your thoughts in the comments. Always keen to hear how others are seeing the market. 👇
⚠️ Disclaimer
As always, this post is purely for educational purposes. I am not a financial advisor, and nothing here should be taken as financial advice. Always consult your financial advisor before making any investment or trading decisions. Or at the very least, consult your cat. 🐱
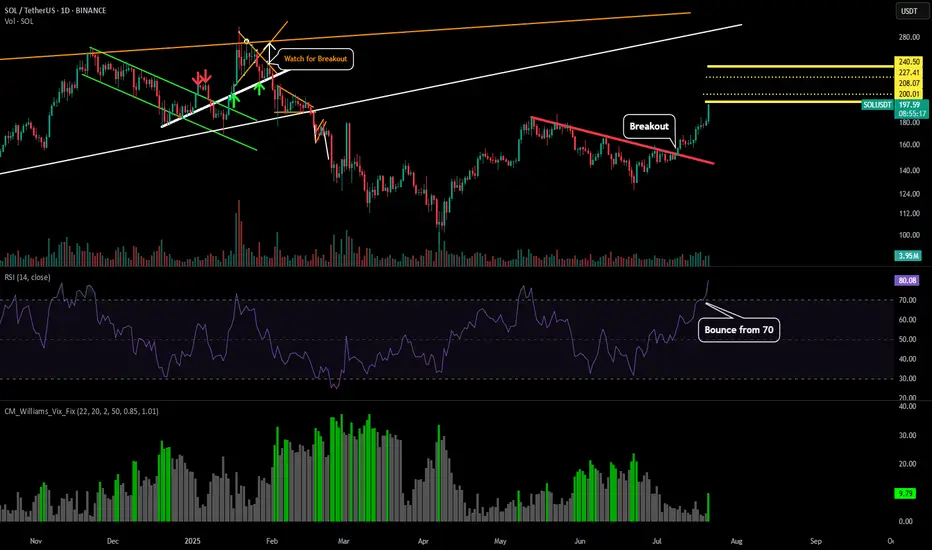
SOL - Upside TargetsAs we see Solana's breakout continue I wanted to outline the short term levels to watch for. All are outlined with yellow rays.
$200 (Psychological level)
$208 (Market structure)
$227 (Market structure)
$240 (Key liquidity level)
The the white line at the top would be the extension level that could put Sol at new all time highs.
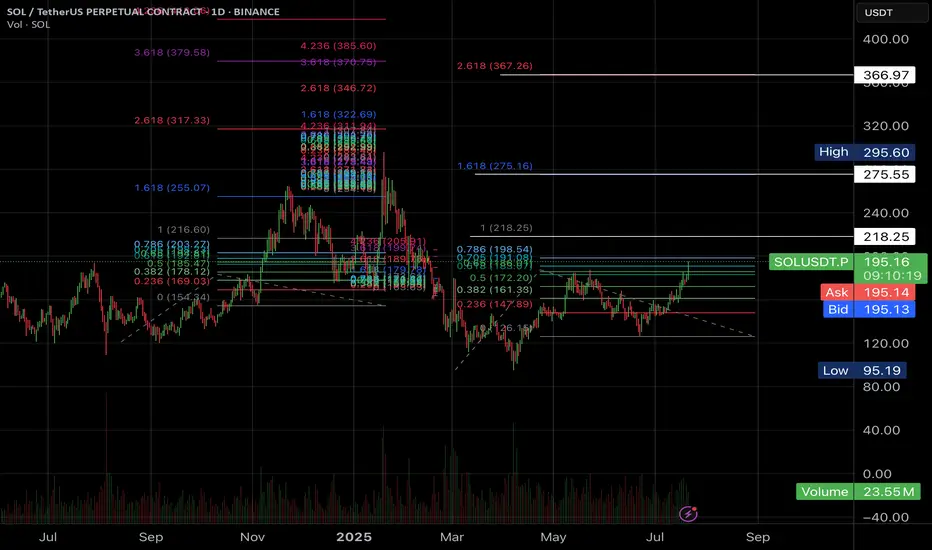
#SOL for 367$?Hi Padawans,
Hope you’re all doing well.
The charts don’t lie — but remember, this isn’t financial advice.
I’m currently eyeing long positions up to the levels highlighted in the chart.
Best regards,
CryptoObi
Keeping track of your favorite TA listsKeeping track of your favorite TA lists, with simple sub folders in your main watch list.

SOL/USDT | Next Bullish Leg Ahead if Key Support (READ)By analyzing the Solana chart on the daily timeframe, we can see that today the price climbed to $184, almost hitting the next target at $187, before facing a correction. It is currently trading around $176. If Solana manages to hold above the key support zone between $168 and $174, we can expect the next bullish leg to start, potentially extending up to $227. The previous analysis remains valid, with the next upside targets at $187, $220, and $263.
Please support me with your likes and comments to motivate me to share more analysis with you and share your opinion about the possible trend of this chart with me !
Best Regards , Arman Shaban
SOLUSDT at least is targeting 300$ this time We are looking for more pump for BINANCE:SOLUSDT on this market and at least after breaking and hitting first targets which are 200$ and 250$ then it is time for new ATH above the 300$.
Major supports and resistances are all mentioned on the chart too.
DISCLAIMER: ((trade based on your own decision))
<<press like👍 if you enjoy💚

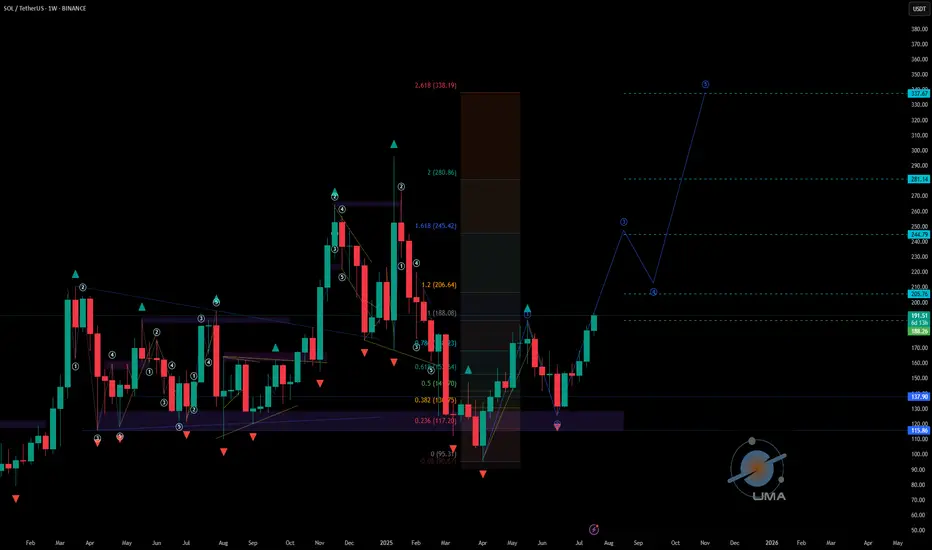
SOLUSDT - UniverseMetta - Analysis#SOLUSDT - UniverseMetta - Analysis
The price on W1 formed a double 3-wave structure. It is also worth considering the previous development for 2-3 months to reach all levels and update ATH. Against the background of the growth of all other assets, and the possibility of the beginning of the altseason, this pattern can be considered for a set of positions in the portfolio. The nearest targets will be at the level of 206 - 245. When the entire structure is realized, we can see a price of 338 per asset. Observe the risks.
Target: 206 - 338
Bullish SOL Setup: $350, $480, $600 Main Price TargetsHello✌
Let’s analyze Solana’s upcoming price potential 📈.
BINANCE:SOLUSDT , I expect a long-term upward bullish trend.
There are three main targets in this analysis: $350, $480, and a final target of $600, which could be reached within 2 to 6 years.
The price may form parallel channels at times, which are shown on the chart. I also expect the current bullish channel to remain valid and continue upward.
✨We put love into every post!
Your support inspires us 💛 Drop a comment we’d love to hear from you! Thanks , Mad Whale🐋
🐋Many of the points and levels shown on the chart are based on personal experience, feeling, and over 7 years of research and daily study of crypto charts.
Some of the lines, channels, and price zones are drawn to make the chart easier to understand and to help imagine possible future price movements.
I’ve also included one very big drop in price even bigger than the others because in the crypto market, it’s common for prices to suddenly fall hard and push out small investors and traders with positions.
The targets on the chart are not guaranteed; they might be reached, or they might not.📚
📜Please make sure to do your own research before investing, and review the disclaimer provided at the end of each post.

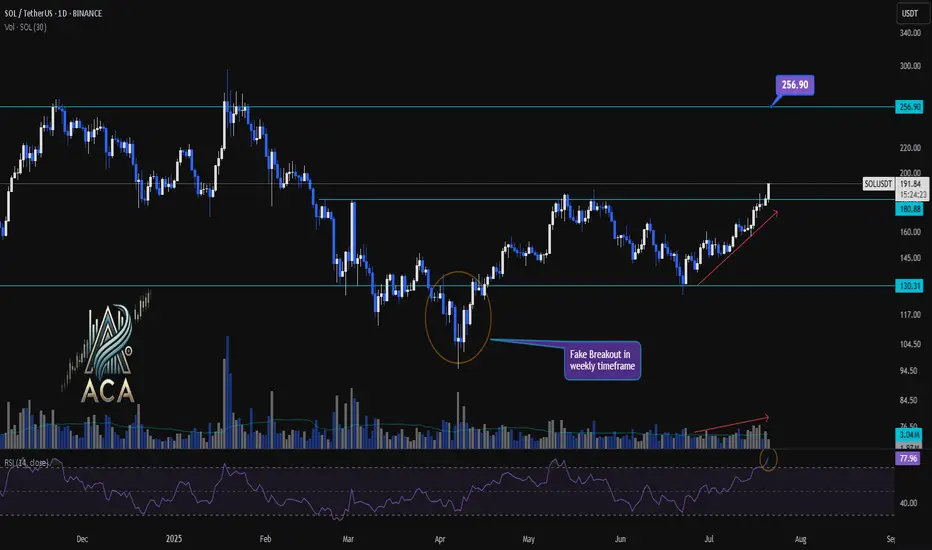
SOLUSDT 1D Chart Analysis | Accumulation Breakout Signals....SOLUSDT 1D Chart Analysis | Accumulation Breakout Signals Fresh Momentum
🔍 Let’s drill into the SOL/USDT daily chart, focusing on the recent breakout above the accumulation range, key support and resistance levels, RSI momentum, and volume confirmation for a robust bullish scenario.
⏳ Daily Overview
SOLUSDT has decisively broken out above a prolonged accumulation box, marking a significant shift in market structure. A daily close beyond this range now serves as a strong indicator for renewed bullish momentum. RSI is currently above 77, signaling that buyers are commanding momentum. Notably, volume has surged in tandem with price, confirming trader participation behind this breakout move.
📈 Technical Convergence and Trend Structure
- Accumulation Zone Break: After consolidating within a clear box for weeks, SOLUSDT closed above the upper boundary (around $180.88–$191.05), signaling a possible trend reversal or continuation.
- Daily Close Signal: A daily close outside the accumulation box offers high conviction for bullish continuation. This close acts as a potential entry signal for trend-followers.
- RSI Momentum: The RSI sits above 77—deep in the overbought territory. A close here not only confirms buyer strength but often precedes sustained uptrends when accompanied by price breakouts.
- Volume Surge: Volume has increased with the breakout, providing confirmation the move isn’t a false start, but likely fueled by real demand.
- Weekly Fake Breakout: There was a notable false breakout in the weekly timeframe, quickly reclaimed by bulls. This flip suggests buyers fended off downside attempts and now drive higher prices.
🔺 Bullish Setup & Targets
- First Target: $256.90 — marking the next major resistance on the chart and a logical upside objective for traders.
- Key Trigger: A confirmed daily (or weekly) close above the accumulation range with strong volume is essential for validating the upward trajectory.
📊 Key Highlights
- The breakdown of the accumulation box—now turned support—marks a pivotal structural change.
- RSI and price are making new local highs, solidifying the case for continued bullish momentum.
- Volume is climbing in sync with the move, offering real confirmation versus a potential fakeout.
- Recent fake breakout on the weekly chart, immediately negated, emphasizes that buyers are regaining—and likely maintaining—control.
🚨 Conclusion
SOLUSDT appears set for higher prices following the confirmed breakout above the accumulation range. Signs of trend health include an overbought RSI, volume confirmation, and the swift invalidation of a recent weekly fake breakout. As long as daily closes stay above the breakout level, the path remains clear for a rally toward $256.90. A strong daily close and continued volume will be your best signals for bullish continuation.
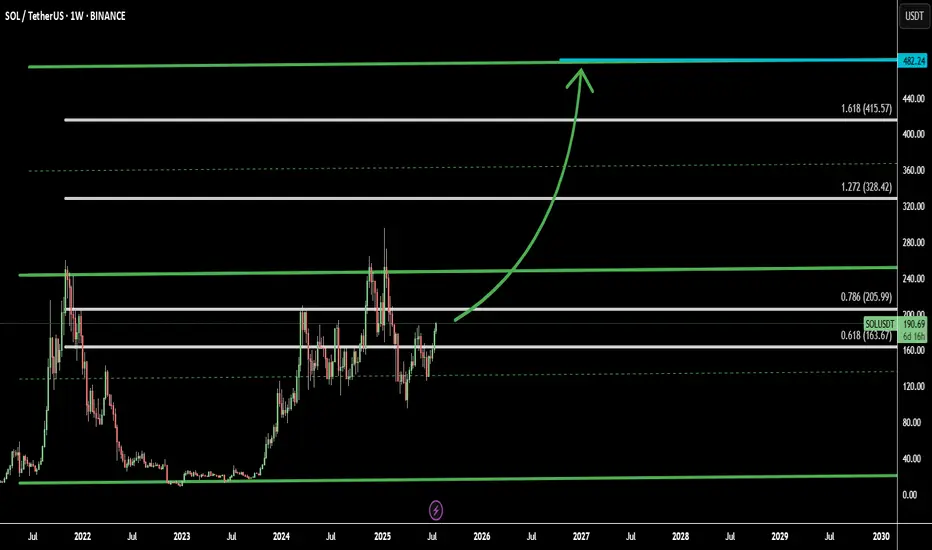
SOL Aiming to Double: Channel & Fibonacci Targets Signal $380Solana (SOLUSD) is currently trading around $190, and technical analysis suggests it may be on the path to doubling in price toward $380. This projection is supported by both a bullish ascending channel and Fibonacci extension levels, providing confluence for an extended rally.
Using this combined strategy, I’ve identified 4 key targets:
Target 1: 0.786 Fib – 205.99 - mid-range target within the upper half of the channel
Target 2: 1.272 Fib – 328.42 - aligns with historical breakout levels
Target 3: 1.618 Fib – 415.57 - Last Fibonacci Targets
Target 4: projected top of the current channel near 482.24
Beyond the technicals, Solana’s ecosystem continues to outperform many other Layer 1 chains, offering faster transaction speeds, lower fees, and robust DeFi and NFT activity. This fundamental strength supports the technical bullish thesis.
As always, breakout confirmation and volume are key. Manage risk accordingly.
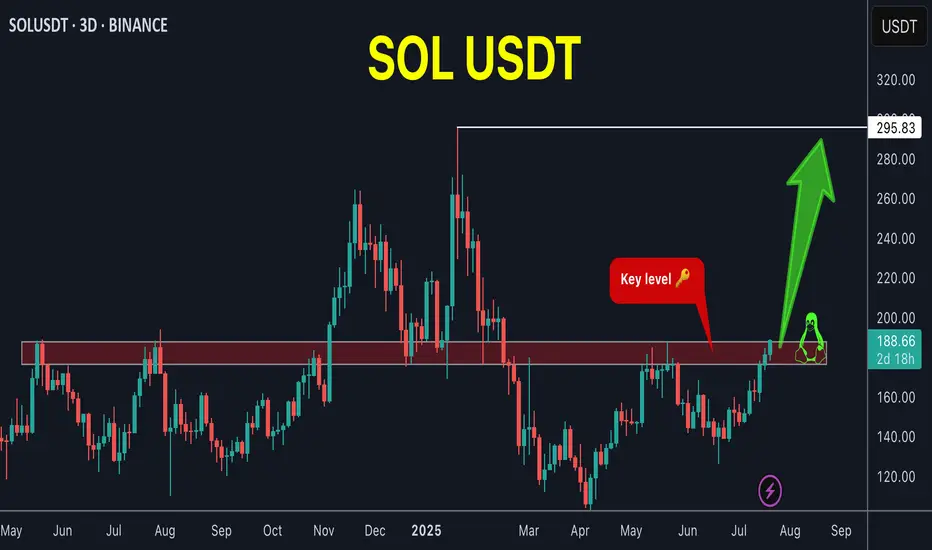
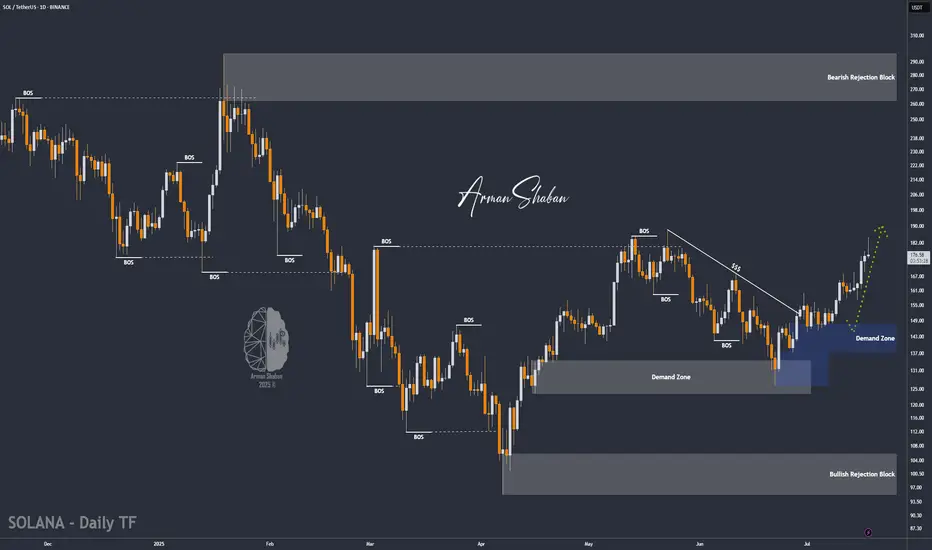
Solana at $189 Now… $295 Might Just Be Days AwaySolana (SOL) on the 3-day chart is showing strong bullish structure after bottoming out near the $95–$110 demand zone. The price has formed a series of higher lows following a prolonged downtrend from the $295 top earlier this year. After reclaiming support levels and confirming demand zones twice (marked with blue "B" signals), SOL is now heading toward key resistance with bullish momentum.
The price also broke above the short-term lower high structure and is consolidating above $189, hinting that bulls are preparing for a leg higher. The red "S" markers at ~$210 indicate past sell zones — and reclaiming this level will likely open the path for a much larger bullish continuation. This move is technically supported by multiple rejections of the $140–150 zone in the past, which now acts as a solid base.
With momentum shifting in favor of buyers and a clean structure in place, here's the bullish trade setup:
________________________________________
📊 Trading Setup (Bullish)
• 📥 Entry: Around $189.45 (current breakout zone)
• 🛡️ Stop-Loss: $140.05 (below last bullish pivot)
• 🎯 Take-Profit (Target): $295.83 (major historical resistance)
• ⚖️ Risk-to-Reward: ~2.16 (healthy R:R with 56% upside potential)
________________________________________
The target of $295.83 is justified not only by price history but also by the structure of the current recovery phase — a move from $95 to $210 followed by a minor retracement, forming a potential rounded reversal pattern. If price breaks above $210 cleanly, momentum traders are likely to enter aggressively, pushing toward $250–295 range.
The stop-loss at $140 is strategically placed just below the last accumulation zone, and protecting against deep pullbacks that would invalidate the bullish sequence.
📈 As long as SOL holds above $180 and continues forming higher lows, the chart remains bullish with $295 as a technically valid target over the next several weeks.

SOLUSDT SELLConsidering the divergence and price patterns and price support, expect a drop to the price of the opinion model.
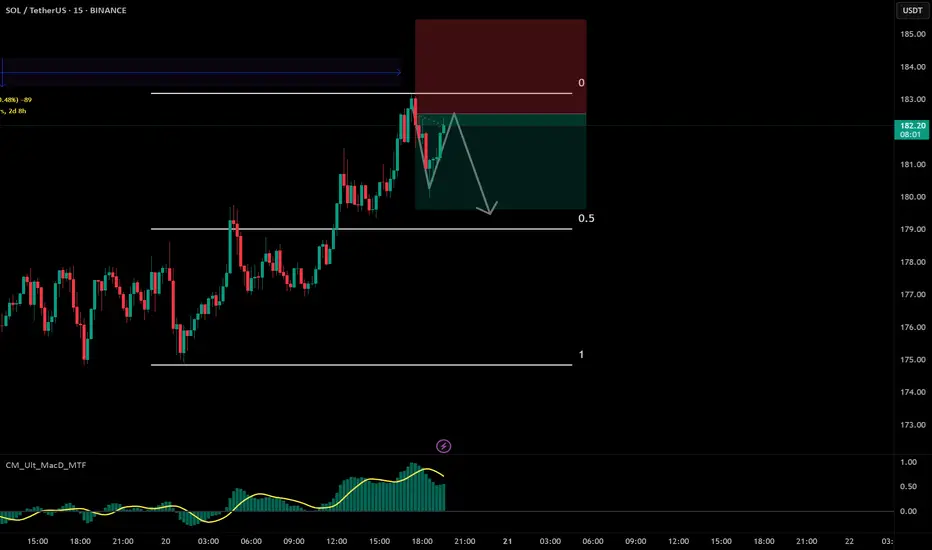
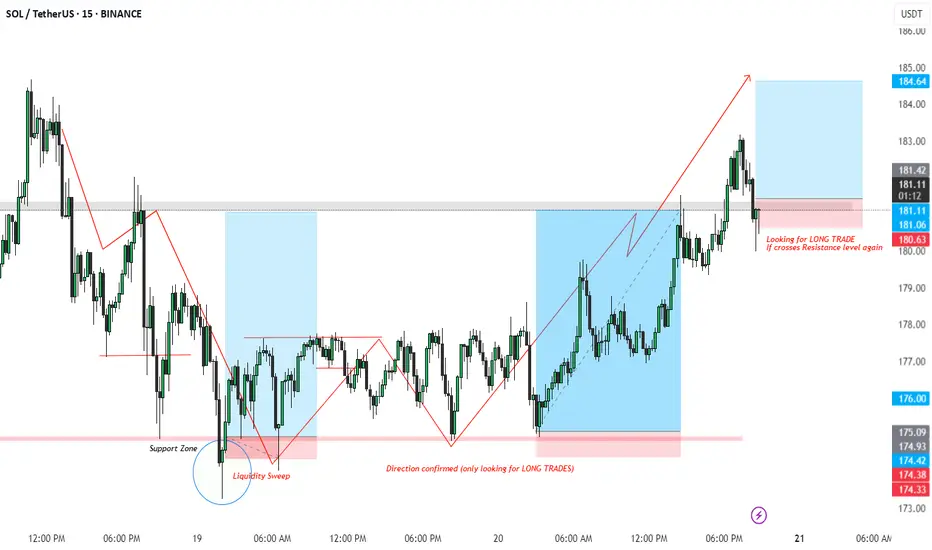
SOL/USDT LONG Setup – Liquidity Sweep + Break of Structure
Timeframe: 15m
Market Bias: Bullish (Long only)
Setup Type: Liquidity Sweep + BOS + Retest
📌 Breakdown:
Liquidity Sweep Identified:
Price dipped below the previous support zone, triggering stop hunts and grabbing liquidity.
Marked as a clear sweep of lows, signaling possible reversal.
Shift in Structure:
Following the sweep, price printed a Higher High and Higher Low, confirming change in structure.
At this point, we shift bias to Long Only trades.
Retest & Entry Zone:
After bullish momentum, price has pulled back to a key resistance-turned-support zone (highlighted in pink).
Looking for long entry on confirmation if price reclaims the resistance again (~181 zone).
📈 Trade Plan:
Entry: On reclaim and candle close above 181.00
SL: Below the recent structure low (~180.00 or dynamic based on confirmation)
TP: Previous high at 184.60 zone (approx 1:3 RR)
🧠 Trading Psychology:
Patience is key — wait for structure confirmation and avoid pre-emptive entries. The liquidity sweep setup gives us a solid probability edge when combined with market structure shift.
#SOLUSDT #CryptoTrading #SmartMoneyConcepts #LiquiditySweep #TradingSetup #BOS #MarketStructure #ReversalPattern #CryptoAnalysis #LongTradeOpportunity #PriceActionTrading #15MinSetup
Solana (SOL/USDT) Technical Analysis – 4H🚀 Solana (SOL/USDT) Technical Analysis – 4H Timeframe | July 20, 2025
Solana is currently testing the major resistance at 181.57, riding a strong bullish trend across all timeframes. Price action, moving averages, and volume all point to a continuation — provided key confirmations hold.
🔍 Chart Structure & Key Levels
- 🔺 Resistance: 181.57
- 🟩 Supports: 168.21 | 158.39 | 145.58 (key support on deep correction)
📈 Indicators Snapshot
- ✅ Moving Averages: 14 of 15 flashing Buy — strong uptrend in play
- 🟡 Oscillators: RSI at 70.19 — near overbought, but no clear sell signal
- 🔁 MACD: Weak Sell — possible divergence or slowdown
- ❗️ AO & ADX: Neutral — waiting for confirmation
🧠 Fundamentals via Bitcoin
- BTC is ranging 🔄
- BTC Dominance is declining 🔻 → Good for alts like Solana
📊 Scenarios
🟢 Breakout Above 181.57
- Next targets: 188 → 195 → 199.74
- Valid if confirmed with volume + stable BTC
🟡 Rejected at Resistance – Pullback to Support
- Watch EMA20 (~176) & 168.21 for re-entry with better risk
🔴 Deeper Correction
- Losing 168.21 → Possible drop to 158.39 or 145.58
---
✅ Trade Idea: Entry above 181.57 only with confirmation — volume, breakout candle, or lower timeframe trigger
⚠️ Watch BTC — any sharp move could affect SOL
📉 Avoid jumping in before a confirmed breakout or clean pullback
---
🧲 Like what you see?
🔔 Follow for more pro-level setups
🚀 Smash the rocket if you're flying with Solana

SOL LONG POSITIONLooking for a long position off the bottom of this upward trendline, Trend continuation trade.
