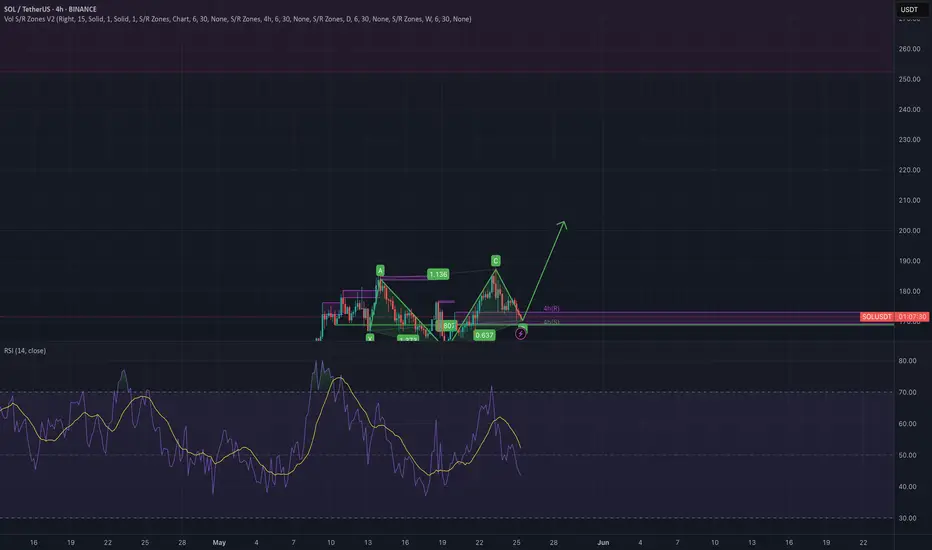
Solana has broken out!The neckline was broken with a strong bullish candle.
After the breakout, price is currently retesting the neckline.
This area also aligns with previous structure and trendline breakout, strengthening the case for a bullish continuation.
Two possible bullish scenarios are outlined:
🔸 A direct continuation from current levels
🔹A deeper retest of the FVG zone before resuming the uptrend
📈 Target projection: Based on the height of the inverse H&S pattern, the potential upside targets the $260–$270 area.
📉 Invalidation: A clean break below the FVG zone (~$162) would invalidate the setup and suggest a deeper retracement.
Overall, the structure remains bullish until proven otherwise. Watching the next daily closes for confirmation.
SOLUST trade ideas
SOLANASOLANA,on strong ecosystem application has shown a strong resilience and return to the demand floor after the price adopted a descending trendline as support floor.a break of the current daily roof will be buy confirmation

SOL Crypto Futures Trade Plan 2025-05-26SOL Crypto Analysis Summary (2025-05-26)
Model Summaries
Grok/xAI Report
Technical: Price $176.77 above 20/50-day MAs but below 200-day SMA. RSI 60.6 (neutral-bullish). MACD shows slight bearish divergence. Bollinger bands suggest price near upper band. Sentiment: Limited positive news impact from luxury watch integration. Neutral funding rate. View: Moderately Bullish (75% confidence). Trade: Long at $177.50, SL $171.00, TP $183.00, 50× leverage, 1% equity position.
Claude/Anthropic Report
Technical: Similar MA and RSI readings; below 200-day SMA. Bollinger bands point to moderate volatility. Sentiment: Balanced funding rate; positive branding news but limited price impact. View: Moderately Bullish. Confidence 72%, below threshold—no trade recommended.
Llama/Meta Report
Technical & Sentiment: Aligns with Grok on MAs, RSI, Bollinger. Neutral overall market backdrop. View: Moderately Bullish (80% confidence). Trade: Long at $176.77, SL $171.74, TP $186.48, 75× leverage, 0.5% equity.
Gemini/Google Report
Technical: Bullish on short-term MAs and RSI but MACD bearish crossover and resistance at 200-day SMA. Sentiment: Neutral funding, niche positive news. View: Moderately Bearish short term (75% confidence). Trade: Short at $176.77, SL $179.50, TP $169.00, high leverage, size 1.
DeepSeek Report
Technical & Sentiment: Highlights 200-day SMA resistance and MACD divergence after 18.5% monthly rally. View: Bearish (75% confidence). Trade: Short at $176.77, SL $181.00, TP $171.74, size 1. Areas of Agreement and Disagreement
Agreement
Price is above the 20/50-day moving averages. RSI (~60) indicates healthy, not overbought conditions. Key resistance near the 200-day SMA (~$181) and upper Bollinger Band (~$186.5). Funding rates are neutral; no extreme positioning. Luxury watch news is a mild positive but not a strong market mover.
Disagreement
Directional bias: Three models lean moderately bullish (Grok, Claude, Llama), two bearish (Gemini, DeepSeek). Trade triggers: Bullish models target breakouts above current price; bearish models emphasize MACD crossover and 200-day SMA rejection. Position sizing and risk thresholds vary widely (1% equity vs. 0.5% vs. full contract). Conclusion
Overall Market Direction Consensus: Moderately Bullish Recommended Trade: Long SOL futures
Entry Range: 177.50 (to confirm continued upside momentum) Stop Loss: 171.00 (just below 20-day SMA) Take Profit: 183.00 (near upper Bollinger Band resistance) Position Size: 1 contract (≈1% of equity at 50× leverage) Confidence Level: 73% Key Risks and Considerations: MACD bearish divergence could trigger a short-term pullback. Strong resistance at the 200-day SMA (~$181) and upper Bollinger band. Correlation with BTC/ETH and broader crypto market swings. Volatility spikes can induce slippage—strict risk management required. TRADE_DETAILS (JSON Format)
{ "instrument": "SOL", "direction": "long", "entry_price": 177.50, "stop_loss": 171.00, "take_profit": 183.00, "size": 1, "confidence": 0.73, "entry_timing": "market_open" }
📊 TRADE DETAILS 📊 🎯 Instrument: SOL 📈 Direction: LONG 💰 Entry Price: 177.5 🛑 Stop Loss: 171.0 🎯 Take Profit: 183.0 📊 Size: 1 💪 Confidence: 73% ⏰ Entry Timing: market_open
Disclaimer: This newsletter is not trading or investment advice but for general informational purposes only. This newsletter represents my personal opinions based on proprietary research which I am sharing publicly as my personal blog. Futures, stocks, and options trading of any kind involves a lot of risk. No guarantee of any profit whatsoever is made. In fact, you may lose everything you have. So be very careful. I guarantee no profit whatsoever, You assume the entire cost and risk of any trading or investing activities you choose to undertake. You are solely responsible for making your own investment decisions. Owners/authors of this newsletter, its representatives, its principals, its moderators, and its members, are NOT registered as securities broker-dealers or investment advisors either with the U.S. Securities and Exchange Commission, CFTC, or with any other securities/regulatory authority. Consult with a registered investment advisor, broker-dealer, and/or financial advisor. By reading and using this newsletter or any of my publications, you are agreeing to these terms. Any screenshots used here are courtesy of TradingView. I am just an end user with no affiliations with them. Information and quotes shared in this blog can be 100% wrong. Markets are risky and can go to 0 at any time. Furthermore, you will not share or copy any content in this blog as it is the authors' IP. By reading this blog, you accept these terms of conditions and acknowledge I am sharing this blog as my personal trading journal, nothing more.

SOL to $200+ over the next daysSOL moving sideways at resistance area which higher lows and higher highs, means some big breakout about to happen

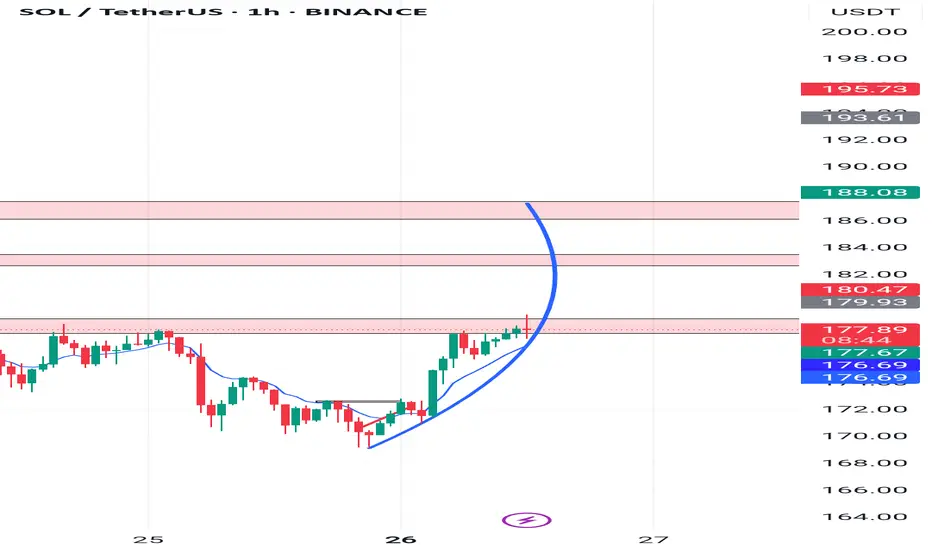
SOL/USDT Analysis (1H Timeframe)
Solana has shown a strong bullish reversal from the support zone around $170, forming a parabolic curve pattern, which often indicates strong bullish momentum.
Trend: Bullish, with steep upward movement and consistent higher highs and higher lows.
Support: The breakout level near $176.65 can act as a new support if price pulls back.
Immediate Resistance: Price is currently testing the $177.67 – $179.93 supply zone. A breakout above this could push SOL towards the next resistance at $180.47, and eventually towards the $186 – $188 zone.
Bias: Bullish continuation is likely if the current resistance is broken with volume. However, temporary rejection or consolidation is also possible here.
$SOL Breakout Watch📈 CRYPTOCAP:SOL Breakout Watch 📈
#SOL is breaking the 1H diagonal trendline — eyes on PDL at $172.6 🚨
Want to see it reclaimed + retested as support for a long entry 🎯
Local resistance = PWH at $184.84
Let it reclaim, then ride the wave 🌊

Solana's fate: pump or dump ?Hello friends
You see that Solana, after its good growth, got stuck in a range and is gathering strength. Now, considering the strong upward trend of this currency, it can be said that this force can push the price upwards, but everything is possible in the market, so observe capital management and trade with your will and wisdom.
*Trade safely with us*

Alert!! Very very strong bearish trend is coming!!If macd in daily timeframe crosses and confirm bearish trend it it may goes down below 96$!! I will let you know the confirmation in ideas. So please follow me to get notified when its happen!

Solana Potential UpsidesHey Traders, in today's trading session we are monitoring SOL/USDT for a buying opportunity around 166 zone, SOL/USDT is trading in an uptrend and currently is in a correction phase in which it is approaching the trend at 166 support and resistance area.
Trade safe, Joe.


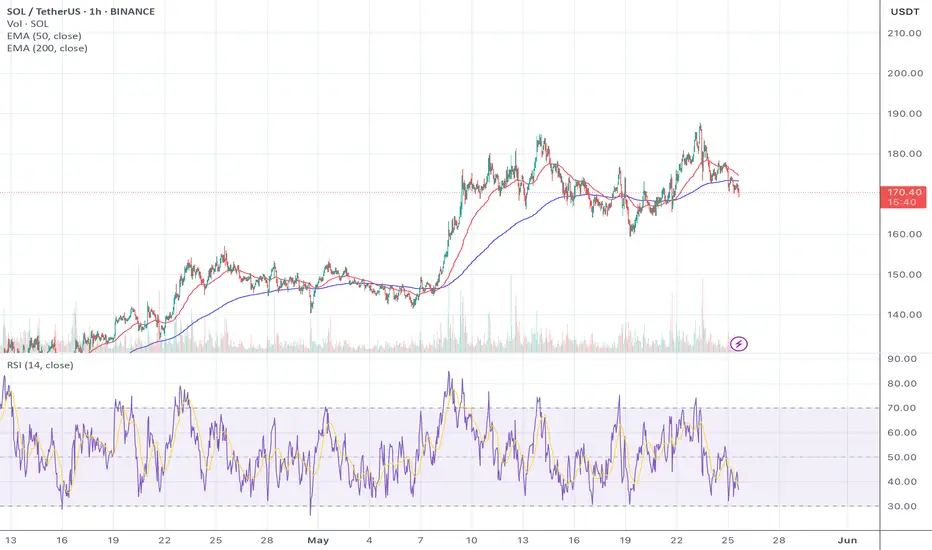
Solana updateSolana (SOL) is testing key support levels after a strong rally earlier in May. Price has dipped below the 50 EMA while staying just above the 200 EMA, signaling potential consolidation or reversal territory. RSI is showing early signs of bullish divergence, hovering near the 40 level. This setup could indicate either an upcoming bounce or deeper correction, depending on volume and trend confirmation.
Indicators:
EMA 50 / EMA 200 crossover watched closely
RSI 14 showing volatility near oversold
1H timeframe (Binance spot chart)
Solana | SOL spot TRADE SETUP +65%Firstly, let's look at the SOL chart from a larger view to confirm the agreement for a bullish setup.
What we see above is a clear bullish bottom, followed by a sharp V-Shaped recovery in the daily timeframe.
From here, the ideal entry could be within this zone, either dollar-cost average or just one spot buy:
With the STOP-LOSS around here:
And THREE TP (take profit) points:
1️⃣
2️⃣
3️⃣
Naturally with the timeframe of your HOLD increasing as your target moves higher.
_________________________
BINANCE:SOLUSDT

SOLANAKey Drivers of Solana (SOL) Price Action in 2025
Network Usage and Adoption
Growing adoption in DeFi (Decentralized Finance) and NFT (Non-Fungible Token) sectors is a major price driver. Increased transaction volume and new dApps boost demand for SOL tokens.
Institutional interest and partnerships, such as Visa’s integration of Solana for USD Coin (USDC) payments, enhance credibility and usage.
Technological Progress
Solana’s high transaction speed and low fees remain competitive advantages over Ethereum and other blockchains.
Ongoing improvements in scalability, security, and infrastructure (e.g., Solana-based smartphones, integration with financial systems) support long-term growth.
Upgrades that improve network reliability and reduce outages are crucial, as past network insability has posed risks.
Market Sentiment and Investor Confidence
Positive news, such as new partnerships, product launches, or regulatory clarity, can boost investor confidence and drive price rallies.
Conversely, regulatory pressures, macroeconomic uncertainties, or network security concerns can trigger sell-offs or price stagnation.
Competition and Macro Risks
Competition from Ethereum, Layer 2 solutions, and other fast blockchains poses a challenge to Solana’s market share and price appreciation.
Broader crypto market trends and macroeconomic factors (interest rates, inflation, USD strength) influence overall sentiment and liquidity.
Longer-term bullish forecasts see Solana reaching $270–$280 by September 2025 and possibly exceeding $350–$370 by year-end, driven by ecosystem growth and institutional adoption.
Technical indicators suggest potential consolidation phases with possible breakouts if momentum builds.
Summary Table
Driver Impact on Solana Price
Network adoption (DeFi, NFTs) Increases demand and price
Technological upgrades Enhances scalability and reliability
Institutional interest Boosts liquidity and investor confidence
Market sentiment & news Drives short-term volatility
Competition & macro risks Can limit upside or cause corrections
Technical support/resistance Guides price action and breakout points
Conclusion
Solana’s price action in 2025 is primarily driven by network usage growth, technological improvements, and institutional adoption, balanced against competition and macroeconomic uncertainties. Positive developments in DeFi, NFTs, and partnerships support bullish scenarios, while regulatory and security risks pose downside challenges. Technical analysis suggests key price levels to watch for potential breakouts or corrections throughout the year.


SOL - SOLANA Daily Chart🧠 Chart Summary (SOL on 1D / Binance / Heikin Ashi):
🔍 1. Recent Price Action:
- Price has been rallying from the $115-$120 support zone since early April.
- A Break of Structure (BOS) occurred around late April — a bullish sign.
- After the BOS, SOL pushed up into the $170–$180 zone, which is acting as short-term resistance now.
- Price is consolidating around $172, forming a range.
🔴 2. Key Zones:
- Resistance (Red Zone): $190 – $200 → Last strong supply zone; price rejected from here in February.
- Support (Blue Zone): $150 – $160 → Previous breakout area and recent BOS level.
- Major Support (Deep Blue Zone): $95 → Labeled as "Weak Low" – if SOL crashes below this, trend shifts bearish.
📉 3. Indicators:
Stochastic RSI: Overbought and curling down → momentum could slow.
Volume: Decreasing as price consolidates → possible upcoming volatility.
⚠️ 4. What to Watch Next:
A break and close above $180–$185 could send SOL toward the $200–$220 zone.
If it drops below $160, expect a possible retest of the $140–$150 support.
Stochastic cooling may lead to short-term retracement before another leg up.
🧾 TL;DR:
SOL is consolidating near resistance after a strong rally. Bulls need a breakout above $185 to stay in control. A dip toward $150 wouldn’t break the trend but could be a better re-entry point.
------------------
------------------
Other Low Market Cap #RWA #RealEstate #Tokenization Platforms by FDV
SQRB $100K on PROBIT
$RNB $310K
$HTS $1.9M
$STBU $3.5M
LAND $3.6M
-----
Not for recommendations to BUY SELL any stocks, cryptos, FX or securities
Not for Financial Advise
DYOR

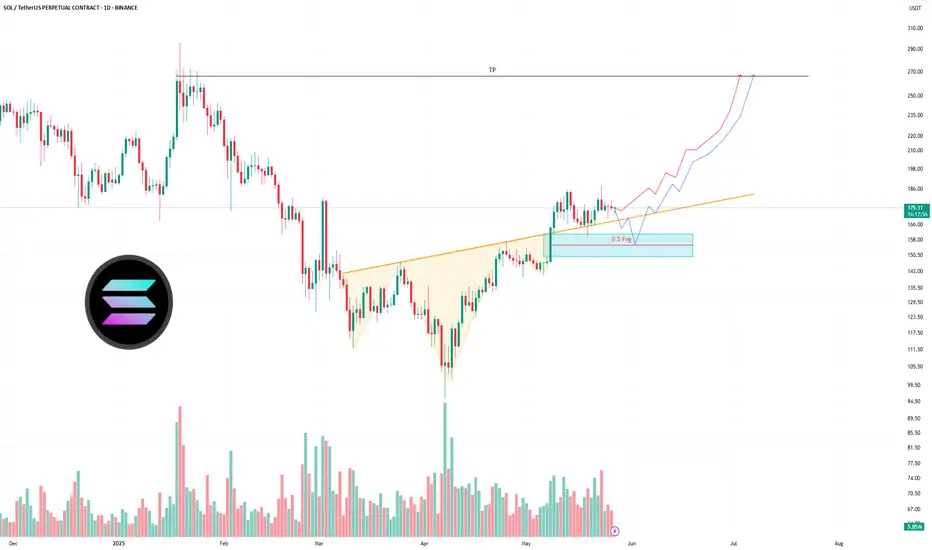
Solana, Consider The Bigger Picture —$420 Isn't The Final TargetThe day before yesterday, based on session close, 23-May, marks a strong rejection from resistance, a mild resistance I should say but, this doesn't change much or anything when it comes to the bigger picture and what we expect in the coming weeks and months.
Good evening my fellow Cryptocurrency trader, I know it is Saturday night but still, it is fun to work.
When in doubt, zoom out... What happens if there is no doubt?
Well, when there is no doubt, rest easy and buy more. Hold easy and profits will come.
Notice the blue line on the chart. This line marks the low from 19-May. While we had a rejection 23-May there is absolutely no bearish action on this chart. The following day, yesterday, was neutral and we will see what the market does today.
The action is happening pretty high compared to the 19-May low. This low is the main support zone and also the baseline of our rounded bottom. $160. You can say that Solana is truly bullish above this level. If it moves below, nothing happens because this isn't likely to happen but if it happens it simply means a market shakeout or bear-trap is taking place. Why? Because we are bullish now, the bullish bias has been confirmed and we will see growth long-term.
Are you aware that interest rates, by the FED (USA), will be lowered next month? This will be used as the catalyst for the Cryptocurrency market to produce astounding growth. When this event happens, you should be fully invested, "buy like is the end of the world" remember?
That's the situation in which we are now. Prices are still low.
Prices are not low as in trading at $100 or $110. But you will consider them super low when Solana starts trading at $300 or higher.
Here is the thing, when the rise happens it will be so sudden and so strong, that you will be wondering, "why didn't I buy when prices were low?" "Master Ananda told me so many times, so many charts..."
It is not too late. Cryptocurrency is set to grow. Long-term.
Thanks a lot for your continued support.
Namaste.

sol/usdtconsistently weakening with lower highs and failed recoveries for months. Structure still leaning bearish until a decisive reclaim of key levels. Waiting in shorts

SOL macro plan3D chart looks very simple here. Simply act on the break on the current zone and take the position to target opposite liquidity area.

solusdt will go to towards 320$solusdt BINANCE:SOLUSDT will go towards $320
In the current area, a downward correction to $150.5 is possible, but ultimately the final destination is $320,
Market geometry doesn't lie.
$320 is an index for this symbol.

Just a Thought: What If the Big Bull Run Starts Next February?Chart: SOLUSDT Perpetual (1W)
Let’s play devil’s advocate for a second…
📉 What if:
The most recent pullback from Solana’s all-time high wasn’t just a dip to find support, but a high timeframe market structure break (MSS)?
We wicked right into the Point of Control (POC) at $126, a critical level going back to Solana’s inception. Many saw that as a liquidity sweep, which it is, but what if that break was confirmation of a shift in the macro structure?
Since then, we’ve seen a corrective rally, and as of now, price is approaching the golden pocket (0.618–0.65) around the $200 region coupled with time Fib confluence around June 25.
⚪ The ABC Hypothesis:
There’s a clean potential for an (A)-(B)-(C) correction. If the market can’t push through the $200 resistance in June, we could see a dragged out move down into the 1:1 extension, which interestingly aligns with key monthly naked POCs (MNPOCs) at $73 and $41, and specifically the 1:1 at $49 (highlighted on the chart for September 25).
That would create a textbook ABC correction, where:
• A = drop from ATH to MSS
• B = golden pocket retracement
• C = 1:1 extension, sweeping long-term liquidity
📅 What if the real bull run doesn’t start until Feb 2026?
Everyone’s calling for the big breakout this year… but what if we need one last washout to fully reset? That timing aligns eerily well with early Q1 2026, after a final leg down.
Chart Legend:
• ✅ Green line = current price
• 🔴 POC = Point of Control (macro volume node)
• ⚪ White lines = ABC structure
• 🔵 Blue verticals = time-based Fibonacci
• 🟡 Golden Pocket = 0.618–0.65 retracement
• 🟣 MNPOC Levels = untested monthly points of control
Just a theory. Not advice. DYOR.
What do you think? Could the real reset be coming?

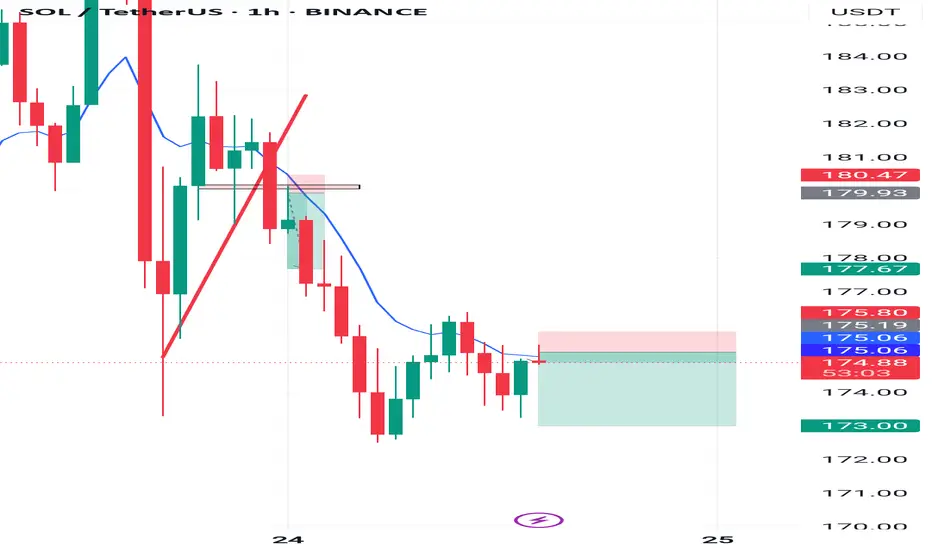
Solana Analysis 1HTMThis is a 1-hour chart of SOL/USDT (Solana vs Tether) on TradingView. Here's a breakdown of the technical analysis visible:
Trade Setup Overview:
Current Price: ~$175.05
Entry Point: Around 175.09 (marked by blue horizontal line and entry candle)
Stop Loss (SL): Around 175.80 (red zone above the entry)
Take Profit (TP): Around 173.00 (green zone below the entry)
Chart Analysis:
1. Trend:
Recent price action shows a strong downward trend, with consecutive bearish candles.
Price tried to break above the 9-period EMA (blue line), but it's acting as dynamic resistance.
2. Entry Logic:
The trade is a short/sell position.
Entry was likely made after a bearish rejection from the EMA or minor structure resistance.
Trader expects price to drop further towards the 173.00 level.
3. Risk-to-Reward Ratio (RRR):
SL is small (~0.7 points above), TP is large (~2 points below), suggesting a good RRR (approx. 1:3).
That’s a positive sign for proper risk management.
4. Bearish Confirmation:
The green candle that hit the EMA and then showed weakness might be a signal of rejection, confirming bearish sentiment continuation.
5. Key Levels:
Resistance: 175.80 – 177.67 zone
Support: 173.00 zone (target)