Solana (SOL): Aiming For $200 | June 2025Solana coin is still showing some kind of buyside dominance, where we are keeping close attention at 100 and 200 EMA on a 4-hour timeframe.
More in-depth info is in the video—enjoy!
Swallow Academy
SOLUST trade ideas

The price can reach $160-170 and then drop to $80-90.The price can reach $160-170 and then drop to $80-90.
If you want to invest, this is not a good place to enter.
It is a downtrend.
Please do not buy on the downtrend.
you must think to Short in downtrends.
Let it go lower and buy when change to bullish.

SOL - He sees everything!Ironically - It took my local SL and went up, but now it have two moves - two moves means either on the down bottom to top or moves directly on the top as said!

Solana starting to look bullish again | Target $180 - $260In my previous idea, I anticipated a liquidity hunt below the $140 level, and price action played out exactly as expected. SOL wicked below this key support zone, triggering stop-losses and inducing panic selling — classic behavior before a major reversal. Following this sweep, price quickly reclaimed the range, breaking out of the downward channel, and is now retesting a bullish break of a textbook cup-and-handle pattern, signaling a potential trend continuation to the upside.
📊 Technical Setup
Cup and Handle formation is evident, with the "handle" forming as a downward-sloping channel now being challenged.
Price reclaimed the $140 demand zone post-sweep and is now retesting.
Target zones: $180 → $220 → $260 based on historical resistance levels and measured move projections.
📉 Invalidation Level
A daily close below $120 (marked as the Invalidation Zone) would invalidate this setup and suggest bulls have lost control.
🌐 Macro Perspective
Fed Rate Cut anticipation and cooling inflation data are helping risk-on assets like crypto regain momentum.
SOL staking ETF launching this week, while SOL spot ETF approval imminent.
Solana's growing DeFi ecosystem, along with high TPS performance and low fees, continues to attract developer and user activity. SOL remains a top candidate for sector outperformance in a bullish H2 crypto cycle.
📌 Conclusion
With market structure turning favorable and strong macro tailwinds, SOL may be gearing up for a major breakout rally. Watch the $160 level closely — a decisive break and hold above could confirm the next leg higher.

SOL/USDT 15-minute high win scalping signals are as follows:- Signal: LONG
- Entry: 147.800 ~ 148.400
- Take Profit: 149.800, 151.300

Solana Will Grow Despite "3,200% Rally"Oh my god! Folks, this friend of ours is saying Solana is going down because of a "3,200% rally." Crazy stuff. Can it continue growing after a 3,200% rally? But he is ignoring a massive correction between January and April. How big is the correction you ask? 67%. Meaning, there is no need to mention the previous rally because it has been corrected already.
Ok, hold on... Let's breatheeeeee deeply first.
Solana ETFs. Growing Cryptocurrency market. Global adoption. Old finance finally waking up to the new financial system. Even banks are starting to buy Crypto and opening up a ramp for their customers to buy Crypto, Solana, using their savings and other funds. This is why it will grow.
Think of this. Think of Apple, Inc. when it was young. Think of Tesla and Google and Microsoft. Would you quit after a 3,000% rally? Well, these companies are still growing today. Crypto is no different, it will grow for decades to come. Solana is going up. 100% certainty, you can see it on the chart; the fundamentals as well.
Get on board the bullish train, it is not too late.
Everything money goes into Crypto. You will be happy with the results.
If you stay out, your loss.
Namaste.

SOL/USD🔹 Trend direction
Current short-term trend: down
Price below key moving averages:
SMA50 (green) ≈ 154.84
SMA200 (blue) ≈ 168.79
Price ≈ 142.49 – below both, confirming weakness.
🔹 Supports and resistances (key levels)
✅ Supports:
142.00–143.50 – current level where price is struggling (multiple price reactions).
131.00 – strong support, last low (June 18).
119.00 / 116.00 / 113.00 – next supports from previous consolidations.
95.61 – deep support if market breaks down.
❌ Resistances:
148.00–150.00 – local resistance, coinciding with the red SMA (short-term resistance).
154.84 – resistance (SMA50).
162.00 – resistance (SMA200).
183.00 – main resistance from the May peak.
218.55 – very strong resistance from March.
🔹 Technical indicators
📉 MACD:
MACD line < signal, negative histogram → bearish signal.
No signs of bullish strength.
📉 RSI:
RSI ≈ 41.31 – close to the oversold zone, but not there yet (below 30).
RSI trend also downward.
🔹 Formations and trend lines
Broken support line after the April-May bullish structure (white trend line).
The previous bearish trend line (yellow) was broken in April, but the momentum did not hold.
A lower high and lower low may be forming now – a classic bearish structure.
🔹 Potential scenarios
🔻 Bearish:
Breakout of 142 → test of 131 → possible drop to 119/116.
Staying below SMA50 and MACD still negative = high chance of continuing declines.
🔼 Bullish:
Recovery of 148–150 needed → only then a chance to test 154 and SMA50.
RSI close to oversold = possible local technical bounce, but not reversing the trend.
📌 Conclusions / Summary
General trend: Bearish (down).
Sentiment: Negative, no confirmed signals of strength.
If level 142 breaks - next test will be at 131.
A strong breakout above 150-154 is needed to talk about a change in structure.

DeGRAM | SOLUSD seeks to confirm the breakout📊 Technical Analysis
● Bulls pushed back inside the broad rising channel and pierced the five-week gray trend-cap; the breakout has been retested at the 147-150 pivot (green strip), now acting as support.
● Price is carving a tight bull-flag on diminishing volume; its 1.618 swing and the channel median intersect with the May swing high near 173, while the upper rail aligns with 187-190.
💡 Fundamental Analysis
● VanEck’s late-June 19b-4 filing for a US spot Solana ETF trimmed perceived regulatory risk, and Firedancer’s public test-net timeline lifted developer sentiment, both fuelling fresh inflows.
✨ Summary
Long 147-150; flag break above 155 targets 173 → 187. Invalidate on a 16 h close below 140.
-------------------
Share your opinion in the comments and support the idea with a like. Thanks for your support!

HolderStat┆SOLUSD confirmed the breachBINANCE:SOLUSDT rebounded sharply from the 145 region and broke above descending trendline resistance. Now holding the retest zone, it’s coiling for a move toward 164 in a classic breakout continuation setup.

Weekly trading plan for Solana Last week, BINANCE:SOLUSDT price followed our bullish (green) scenario perfectly and hit the first target. At this point, the upward corrective phase may be complete, so we could reasonably expect a pullback to either the weekly pivot point or support zone
Write a comment with your coins & hit the like button and I will make an analysis for you
The author's opinion may differ from yours,
Consider your risks.
Wish you successful trades ! mura

Is SOLANA SOL Ready for a Breakout? Bounce from Falling Channel?
🔍 Chart Pattern and Price Structure Analysis
This chart illustrates a well-formed descending channel (parallel falling channel) that has been developing since mid-January 2025. Currently, the price is approaching the upper boundary of this channel — a key decision area.
🟡 Technical Pattern
Descending Channel: This pattern is characterized by a series of lower highs and lower lows, representing a medium-term bearish trend.
The price is now testing the upper resistance of this channel, a crucial point that could either trigger a breakout or result in another rejection.
📈 Bullish Scenario
If the price successfully breaks out above the upper trendline (around $152–$154), several resistance targets come into play:
1. $164.5 — A minor horizontal resistance and key psychological level.
2. $182.2 — A strong historical resistance zone.
3. $210–$217.8 — A previous consolidation/resistance zone.
4. $237.7, then $261–$280 — Key bullish targets if momentum sustains.
5. Ultimate target near $295.1–$295.7 if broader market sentiment remains strong.
📌 Bullish Confirmation:
Valid daily candle breakout above the channel.
Strong breakout volume.
Successful retest of the breakout area as new support.
📉 Bearish Scenario
If the price fails to break above the channel and gets rejected, we may see a continuation of the downtrend with potential moves to these support levels:
1. $140–$138 — Current minor support zone.
2. $128 — Recent consolidation support.
3. $115.5 — Major support from April.
4. $95.2 — The lowest support zone on the chart.
📌 Bearish Confirmation:
Strong rejection candle (e.g., bearish engulfing) from upper channel.
Weak breakout attempt with declining volume.
Break below the lower channel support or creation of a new lower low.
📊 Conclusion
The current setup is a classic descending channel, indicating a strong mid-term bearish structure.
Price is now at a make-or-break zone — a breakout could signal a trend reversal, while a rejection could extend the current downtrend.
Traders should wait for a confirmed breakout or clear rejection before entering a position.
#SOLUSDT #Solana #CryptoAnalysis #TechnicalAnalysis #DescendingChannel #BreakoutAlert #CryptoTrading #BullishScenario #BearishScenario #Altcoins #CryptoTA

Your SOUL is for SOLSO SOL looks very nice to cruise up as stated earlier, targets for 161 can be seen!

SOL Long Idea Going Pretty WellTime Frame - D
Confluences
Turtle Soup
EOB
Breaker Block Confirmation
Retest of EOB
I am targetting atleast 158. Ideal entry was around 142.
#NFA, #DYOR

SOL TECHNICAL ANALYSIS !!CRYPTOCAP:SOL is testing the upper boundary of its falling channel.
No breakout yet, just a clean retest of trendline resistance + 0.5 Fib zone around $144–$146.
A breakout above $152 (Fib 0.382) with volume could shift the structure bullish. Until then, it’s still inside the downtrend.
This is where patience pays, wait for confirmation, not hope.
What’s your play here?
If you find my updates helpful, don’t forget to like and follow for more!
DYOR, NFA
#Solana #SOL

HolderStat┆SOLUSD aims for the $170 levelBINANCE:SOLUSDT has broken above triangle resistance, retesting the $146.60 level as new support. The breakout echoes earlier consolidation-based rallies, opening the path toward $170. As long as the structure remains intact, bulls could extend the climb over the next few sessions.

SOL/USDT Scalping Setup – 1H Reversal from Demand with FibonacciMarket Context:
Solana has pulled back into a key short-term demand zone after a sharp rejection from recent highs. Price action is now showing signs of local exhaustion, with confluence from lower timeframe support and bullish structure attempting to form. The setup anticipates a bounce targeting the mid-Fibonacci zone.
Setup Idea:
Price tapped into a local support shelf around 148.80, where previous demand initiated the last impulsive leg up. With momentum indicators stretched and RSI divergence building, this offers a high-probability scalp opportunity.
Targeting the 0.5–0.618 Fibonacci retracement zone as first resistance, with confirmation needed for further continuation.
Trade Plan:
Entry: Around 148.80–149.00
Stop Loss: Below 148.30 (beneath local swing low and structure break)
Target: 154.50–155.90 (Fibonacci 0.5 to 0.618 zone)
Risk/Reward: Approx. 2.5R
Notes:
This is a reactive setup — price must hold the current level or print a higher low. If sellers regain control below 148.30, the trade is invalidated. Watch closely for volume shift and 1H candle confirmation before adding size.
Mid-Fibonacci level (154.57) is a logical area to de-risk or take partial profits.

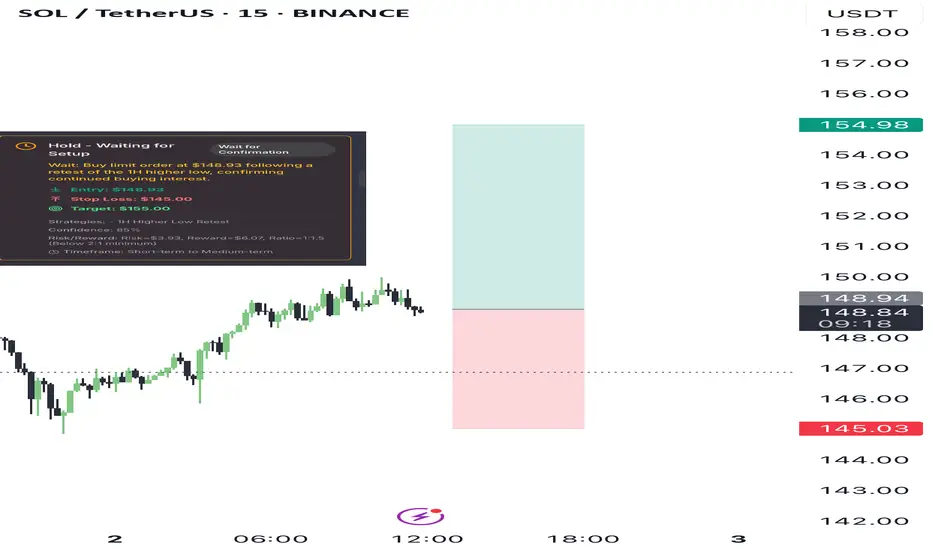
Long setup TiqGPT analysisAnalyzing the SOL/USDT across multiple timeframes, we observe a complex interplay of institutional activities. Starting from the 1D chart, the price action shows a recent recovery from a significant drop, suggesting a potential phase of accumulation or re-accumulation by institutions. The 4H and 1H charts display a series of higher lows, indicating a short-term bullish sentiment and possible preparation for an upward move.
The 15M, 5M, and 1M charts reveal more granular details of this bullish sentiment, with price action forming higher lows and testing previous highs, which could be indicative of a buildup of buying pressure. The presence of wicks on the lower side of candles in these lower timeframes suggests rejection of lower prices, a typical sign of institutional buying interest at those levels.
INSTITUTIONAL THESIS:
Institutions appear to be in a phase of accumulation, particularly noticeable on the 1D and 4H charts where the price has stabilized and started to curve upwards. The higher lows across the 1H, 15M, and 5M charts support this thesis, indicating an ongoing demand at higher price levels. This setup suggests a preparation for a potential upward breakout.
LEARNING POINT:
"1H and 4H higher lows formation amidst a broader 1D accumulation phase."
SIGNAL: WAIT
SYMBOL: SOL/USDT
ENTRY PRICE: $148.93
STOP LOSS: $145.00
TARGET PRICE: $155.00
CONDITION: Buy limit order at $148.93 following a retest of the 1H higher low, confirming continued buying interest.
RATIONALE: Calculated risk/reward ratio of 1:1.5 (Risk=$3.93, Reward=$6.07) does not meet minimum 2:1 requirement. Waiting for better institutional setup with improved risk parameters.
Momentum & Exhaustion: Rejection of lower prices on lower timeframes, indicating exhaustion of selling pressure.
Liquidity Behavior: Potential liquidity above recent highs around $150.00, likely target for institutional profit-taking.
Pressure Analysis: Institutional buying evident from wick rejections on lower timeframes.
Context Awareness: Price action moving from a discount (recent lows) towards a premium zone (above $150.00).
STRATEGIES USED:
1H Higher Low Retest
4H Accumulation Phase Buying
Targeting Liquidity above $150.00
SOLUSDT Bullish Flag Pattern!Price has formed a Bullish Flag pattern on the daily timeframe. After multiple touches of both support and resistance, the price has now broken out above the falg resistance, signaling a potential trend reversal. and price trading above 50 and 100 EMA
Currently, SOL is bouncing from the channel breakout level, indicating strong bullish momentum. A clean breakout candle confirms buying interest, and the setup favors a strong bullish continuation if the breakout sustains.
Entry: Above $150
Stop-loss: Below $135
CRYPTOCAP:SOL TRADENATION:SOLANA

SOL NEXT MOVES 🧠 Scenarios:
1️⃣ Break above $149.50 → Possible push to $154–161
2️⃣ Rejection from red zone → Drop toward $132
3️⃣ Dip to $126–132 → Bullish recovery expected
📊 Plan your entries with structure & confirmation. No chasing.

Solana Price Poised to Explode — But Only If This Level BreaksThe chart shows Solana trading around $153.85 USDT after a corrective rally from the June lows. Overall market structure has shifted in recent sessions, highlighted by a clear Break of Structure (BOS) on June 29, which signaled the first real attempt to reclaim higher ground after persistent weakness. However, the price has now approached a cluster of supply zones, which could either trigger a further rally if absorbed or mark a fresh rejection.
Above the current level, you can see strong red zones between 160–180 USDT, representing prior swing high supply and institutional sell interest. These are areas where large sellers previously stepped in to push price lower, so if Solana fails to break above this region with convincing volume, sellers may become more active again. In contrast, the nearest major demand zone sits around 137–140 USDT, highlighted in blue. This zone has acted as a key support and liquidity pocket where price has rebounded multiple times.
The Smart Money Concepts on the chart, including frequent CHoCH (Change of Character) and EQ/CHoCH labels, indicate that liquidity sweeps and engineered reversals have been common. This suggests the market may be preparing to hunt stops above recent highs or below recent lows before committing to a longer-term move.
At this point, the trend bias is cautiously neutral to bullish in the short term because the BOS suggests an attempt to reclaim higher levels. However, this bullish bias remains unconfirmed until Solana cleanly breaks and holds above 160–170 USDT. If sellers defend that area, the market could revert to the 137–140 zone.
Below is a clear trade scenario based on what the chart is showing:
Potential Trade Setup (Not Financial Advice)
Scenario: Short from Supply Resistance
o Entry: 153.85–154.35 USDT (currently being tested)
o Stop Loss: Above 160 USDT (invalidates bearish rejection)
o Take Profit Target: 137–140 USDT demand zone
Alternatively, if Solana rejects and returns to retest demand, this would offer a possible buy scenario for traders looking to play the rebound:
Scenario: Long from Demand
o Entry: 137–140 USDT demand zone
o Stop Loss: Below 135 USDT (confirms demand failure)
o Take Profit Target 1: 153.85 USDT resistance retest
o Take Profit Target 2: 170 USDT upper supply
At the moment, the price is balanced between these zones, so a wait-and-see approach can help confirm whether supply breaks or holds. A clean break above 160 USDT with strong momentum could invalidate the short idea and favor continuation higher toward the upper supply region around 170–180 USDT.
In summary, the chart structure is showing early signs of potential accumulation but still faces significant overhead resistance. Careful confirmation around the 154–160 level is critical before committing to either direction. If you’d like, I can help you refine these plans further or overlay additional indicators like volume or moving averages for extra confirmation.

$SOL Bullish Breakout from Falling Channel | Eyeing $180 NextSolana (SOL) has broken out of its falling channel on the daily timeframe, indicating a potential trend reversal. After the initial breakout, SOL made a successful retest of the channel. However, it faced rejection at the 200 EMA, which is now acting as a critical resistance level.
Currently, SOL is attempting a second retest of the 200 EMA. If it breaks and holds above this dynamic resistance, we could see a swift move toward the next major target at $180, with potential to eventually revisit the previous all-time high near $260.
Supporting the bullish outlook:
📈 RSI is showing bullish divergence, confirming upward momentum.
📊 Price action is forming higher lows, establishing a clean uptrend structure.
🔍 Key level to watch: $156 resistance. A daily close above this could confirm the next leg up.
📌 Key Levels:
Resistance to break: $156
Short-term target: $180
Extended target: $260
EMA to watch: 200 EMA (Daily)

Solana (SOL): Gameplan Remains The Same | Aiming at $100 Solana's game gameplan has not changed for us, where we are still looking for that downward movement to form a proper support zone near the psychological area at $100.
More in-depth info is in the video—enjoy!
Swallow Academy

SOL LONGSolana price flipped bullish as bears fail to push price below $140
Next target areas for resistance are $160 and $170
