Solona Trader StrategyConsolidation Phase: Price is trapped in a tight range (142.26–142.39), signaling a pause in trend.
Breakout Watch: A move above 143.85 or below 141.80 could signal directional momentum.
Trader Strategy:
Short-term: Range-bound trading (buy near 141.80, sell near 143.85).
Long-term: Wait for breakout confirmation.
SOLUST trade ideas

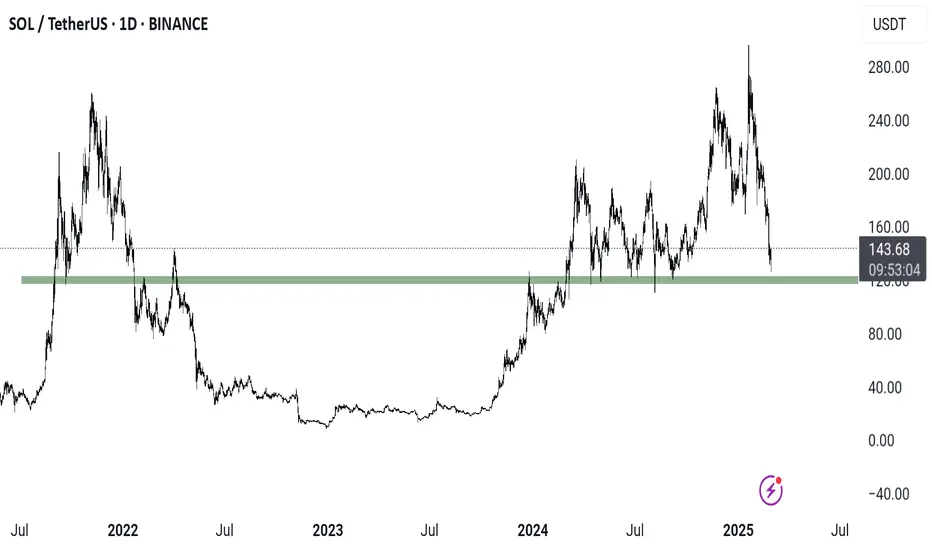
Solana’s 60% Correction: Time to Buy the Dip?After reaching an all-time high around the $300 zone, Solana experienced a sharp decline of approximately 60%, dropping to a key support level above $120.
This pullback could present a strong buying opportunity for speculators anticipating a reversal toward $200.
Conclusion:
✅ Dips below $140 should be considered potential entry points.
✅ The setup becomes invalid if the price closes below $120 on a daily basis.
✅ A move toward $200 remains a reasonable and achievable target.

Solana (SOL) Holding Strong – Can It Reclaim $200?Solana (SOL/USDT) is currently testing a critical support zone around $140, aligning with a long-term ascending trendline that has provided strong support in previous market cycles. The 50-week EMA ($168.03) is also acting as dynamic resistance, making this an important decision point for the market.
The recent pullback from resistance at the previous ATH zone suggests some profit-taking, but if SOL can hold this key support level, a bullish reversal could follow, pushing prices back toward $200+ in the coming weeks.
However, a break below $140 could lead to a deeper retracement toward the trendline support around $100-$120.

SOLUSDTThere is already a break of structure. We wait for a retest and confirmation for entry to go LONG.

SOL recovery incoming?SOL is testing horizontal support again. The good thing is that invalidation is clear. There is a class A bullish divergence on the 4h while the daily time frame is still not showing much.

SOLUSDT NEXT MOVESell after bearish candle stick pattern, buy after bullish candle stick pattern....
Best bullish pattern , engulfing candle or green hammer
Best bearish pattern , engulfing candle or red shooting star
NOTE: IF YOU CAN'T SEE ANY OF TOP PATTERN IN THE ZONE DO NOT ENTER
Stop lost before pattern
R/R %1/%3
Trade in 5 Min Timeframe, use signals for scalping

Solana Continues Bullish, Why? Bitcoin & The Altcoins MarketSeeing Solana bullish and ready to grow, what does it mean?
Will Solana decouple from the rest of the Cryptocurrency market and grow all on its own?
Or can we say that we have a clear signal that the bottom is in; what one does, the rest follows.
Good afternoon my fellow Cryptocurrency trader, wonderful news coming from the Altcoins again.
Solana is good. Solana is bullish. Solana already bottomed. Solana looks very strong.
The fact that Solana hit bottom and is ready to grow, reveals what is coming to Bitcoin and the rest of the Altcoins. We are witnessing a long-term higher low and classic final flush before the major 2025 bull-market bull-run. Long-term growth in short.
The support level mapped on the chart has been pierced. Trading volume is very low on the drop. The current session is a very strong hammer, bullish signal, trading on the positive side. It has a long lower shadow and a big green real body. Everything points up.
The fact that Solana is bullish being such a strong and big project, confirms that Bitcoin hit bottom and also the rest of the Altcoins.
I am looking at many of the smaller Altcoins and their behavior is extremely clear to me, it shows that lower is no longer possible nor needed. I will be sharing some of these charts with you.
The thing is that in the last 5 days Bitcoin has been red but some Altcoins instead of crashing are going sideways. This can only happen preceding a major bullish phase. Since everything will grow, the Altcoins already bottomed, they are waiting for Bitcoin to end its flush before taking off. The Altcoins will move before Bitcoin and they will grow strong. The Altcoins never grow if Bitcoin is going down. The fact that many Altcoins are bullish —trading at support and reversing— means that Bitcoin will grow.
The time to buy is now.
Thanks a lot for your continued support.
Buy and hold. Easy hold.
Regardless of the short-term shaking and noise, we are going up. Crypto is going up.
Solana is going up. Bitcoin is going up... In a matter of days.
Namaste.

Solana projectionI think solana will head down to weekly lows because we are seeing a rejection out of this daily FVG

SOL ANALYSISThe analysis you see is on the weekly time frame.
If you need reviews on lower time frames to be posted on the TradingView site.... Leave a comment in the comments so that this can be done.
If you liked this analysis, share it with your friends.

Crypto Bounce - Solona 150 dollarsI believe that the first real bounce will be here. CME target of 77K almost got reached, and micro pattern played out. Solona back in her pattern, with a end target of 150 for me.

Solana (SOLUSDT) is Not Dead! A Major Move is Coming! Solana (SOL) is holding strong at its major support level of $110, making this an ideal accumulation zone between $110 and $140. With CME Group launching SOL Futures on March 18th, institutional interest could surge, potentially triggering a massive rally. As Solana gears up for a recovery to previous highs, this could be a prime opportunity to buy and hold for the long term. Don’t miss out—accumulate
BINANCE:SOLUSDT Currently trading at $144
Buy level: $110 - $140.
Stop loss: Below $90
Target : $500
Max Leverage : 1x /Spot trade
Always keep Stop loss
Follow Our Tradingview Account for More Technical Analysis Updates, | Like, Share and Comment Your thoughts

SOL | Solana Drops 54% | WHERE TO NEXT?The recent ByBit hack seems to have sent the market into a downward spiral. But, if you look at it from a few weeks back, prices were already beginning to drop even before the news of the hack.
Solana follows Ethereum pretty closely, and considering the hard sell-off on ETH, SOL followed suit with a -26% drop over the past week.
This is quite a substantial correction, and considering the past 6 candles were red - it's likely that we can expect a bounce from next week, or at least a green candle. If we fail to bounce here, the short term is looking bleak for SOL:
____________________
KUCOIN:SOLUSDT


SOL LONG SETUPALL trading ideas have entry point + stop loss + take profit + Risk level.
hello Traders, here is the full analysis for this pair, let me know in the comment section below if you have any questions, the entry will be taken only if all rules of the strategies will be satisfied. I suggest you keep this pair on your watchlist and see if the rules of your strategy are satisfied. Please also refer to the Important Risk Notice linked below.
Disclaimer
SOL LONG SETUP
ENTRY : 113.63
PROFIT : 165.26
STOP : 96.57

SOLUSDT 6DSOL ~ 6D Analysis
#SOL Buy gradually from here with a short -term target of at least 15%+ from here.


Solana Faces Heavy Selling—Is Capitulation Over?Solana has been on a wild ride since hitting its all-time high of $295.83 in January. The once high-flying altcoin has now fallen to levels not seen since October, triggering panic among traders. But here’s the twist—on-chain signals suggest a recovery could be closer than many think.
RSI Signals an Oversold Market—Time for a Rebound?
📉 Solana’s RSI just dropped below 30 for the first time since June 2023—a strong signal that the asset is oversold. Historically, when RSI enters this zone, a price reversal often follows as traders scoop up discounted tokens.
📌 Why It Matters – When an asset reaches oversold territory, it means selling pressure may be running out. If buyers step in, SOL could stage a strong recovery.
Market Sentiment at a Low—A Buying Opportunity?
🔹 Crypto analyst Miles Deutscher calls this Solana’s “capitulation moment”—a period when panic-driven selling could mark the bottom.
🔹 When weak hands sell off, stronger buyers often step in, driving a price recovery.
Key Price Levels to Watch
📌 Support: $136.62 – Holding this could trigger a rebound.
📈 Resistance: $182.31 – A breakout here could push SOL above $200 to $222.14.
📉 Bearish Scenario: If selling continues, SOL may fall to $120.72.
The next few days are crucial—will buyers take control, or is more downside ahead?

SOL/USDT – Double Zigzag Completed! Is a Bullish Reversal Next?Solana (SOL) has likely completed a Double Zigzag (WXY) correction, with Wave C of Y bottoming at $130.60 (1.0 Fibonacci extension). This suggests a potential trend reversal, but SOL must first break key resistance at $146-$150 to confirm a bullish move.
🔹 Elliott Wave Analysis & Bullish Scenario
If the Double Zigzag correction is complete, SOL could begin a new impulse wave, targeting:
✅ $169-$173 (0.5 Fibonacci retracement, previous Wave B resistance)
✅ $180-$195 (0.382 Fib & major supply zone)
✅ $220+ (Wave 3 extension target)
🔻 Bearish Scenario – Extended Correction?
If SOL fails to break $150, it could indicate that the correction is not yet over, leading to:
❌ Retesting $130 support
❌ Possible extended correction towards $113-$100 (1.272 Fib extension)
📌 Key Level to Watch:
🔹 A break & close above $150 signals bullish continuation.
🔹 A rejection could mean further downside.
📊 Is SOL ready for a breakout, or will we see another leg down? Share your thoughts below! 👇🔥

Solana Bullish Setup I created a Entery and sl point according to 4 hr if you guys have knowlegde about technical you can easily get more rr in smallar Timeframe

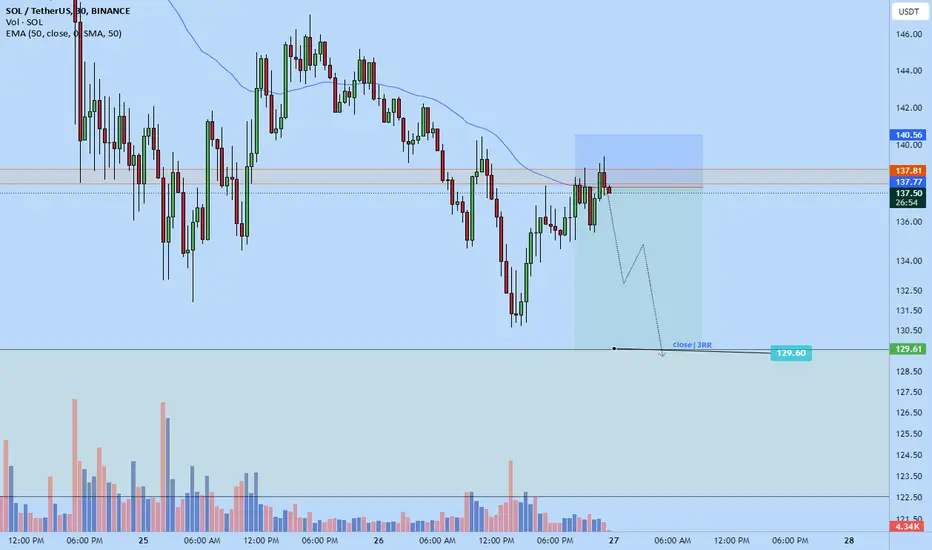
Solana short to $129.6I just opened a solana short position if anyone wants to follow along.
Roughly 3RR
Based on my analysis I think the market is gonna push to make a lower low soon and will likely fall to the $129.6 area and maybe lower but i might be a sleep so setting a hard target at that area so that Its likely to get hit.
I did not wait for any special type of entry confirmation here I think its high enough and my stop is at good invalidation point in a relatively safe area and good level. I don't expect much upside movement from here. This should be an attract area for other sellers to get in.

#SOL/USDT Analysis📉 CRYPTOCAP:SOL is testing the Daily +OB**—a crucial level to hold!
⚠️ If this +OB fails, SOL could drop below $100.
🔹 Major Resistance: PMH $168.33
Watching for a reaction here! 👀
