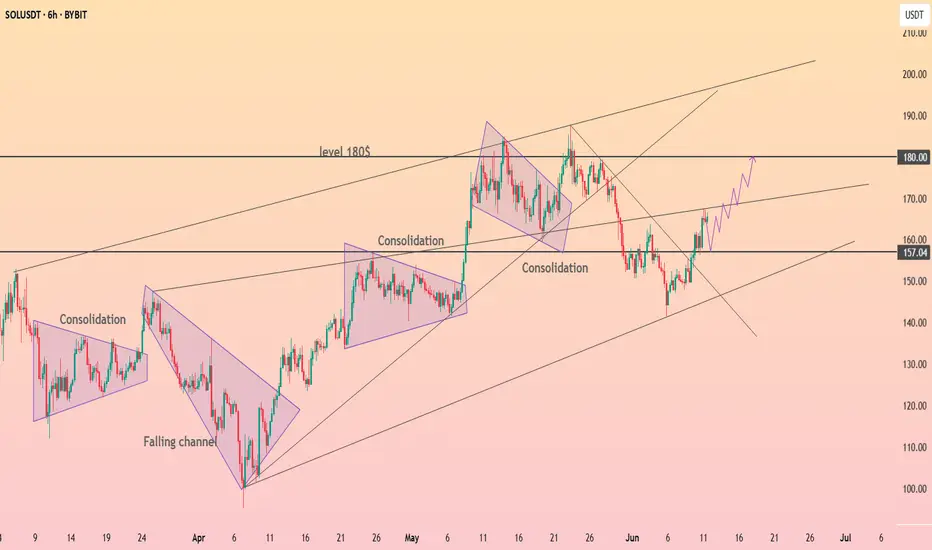
HolderStat┆SOLUSD reached resistance lineCRYPTOCAP:SOL just flipped the 157 pivot into support after escaping a falling channel and retesting the up-trend. Holding here fuels a run toward the 170 trend-cap and 180 supply shelf; failure invites 150 again. Growing channel, consolidation clusters, breakout watch.
SOLUST trade ideas
sol updateentry price 169.14
stop loss update 169.14
take profit 160.1
145.1
131.5
result for now we hit 2 target and risk free

BUY OPPORTUNITYTrade Setup: SOL/USDT
Entry: $161.13
Stop Loss: $156.57
Take Profit: $176.53
Time Frame:4H
Technical Analysis:
SOL price has decisively broken out above a strong resistance zone between $160.48 and $162, confirming bullish price action. This breakout is likely to trigger a retest of the broken range to confirm support before continuation higher.
Key resistance to target is at $177.20, which aligns with a significant supply zone. Traders should consider scaling out or taking profits near this level due to potential selling pressure.
Risk-Reward: Approximately 1.3 favoring the trade.
RSI: Currently at 63, showing sustained bullish momentum without being overbought.
MACD: Bullish crossover present, indicating upward momentum is intact.
Fundamental Update:
The U.S. Securities and Exchange Commission (SEC) has requested prospective Solana ETF issuers submit amended S-1 forms within the next week. The SEC will review and comment within 30 days of submission. Importantly, the SEC appears open to including staking within Solana ETFs, having asked issuers to clarify language on in-kind redemptions and staking mechanisms. This regulatory openness could add significant bullish catalyst for SOL, supporting increased institutional interest and demand.

SOLANA Short Position Update – June 11, 2025We are the SeoVereign Trading Team.
With sharp insight and precise analysis, we regularly share trading ideas on Bitcoin and other major assets—always guided by structure, sentiment, and momentum.
🔔 Follow us to never miss a market update.
🚀 Boosts provide strong motivation and drive to the SeoVereign team.
--------------------------------------------------------------------------------------------------------
Solana downside perspective shared.
The first target is set at 162.94.
The bearish outlook is based on the Elliott Wave structure and volume flow.
Currently, upward momentum appears to be exhausted, and decreasing volume is increasing the possibility of a trend reversal.
Additional analysis will be shared through an idea update once the first target is reached.

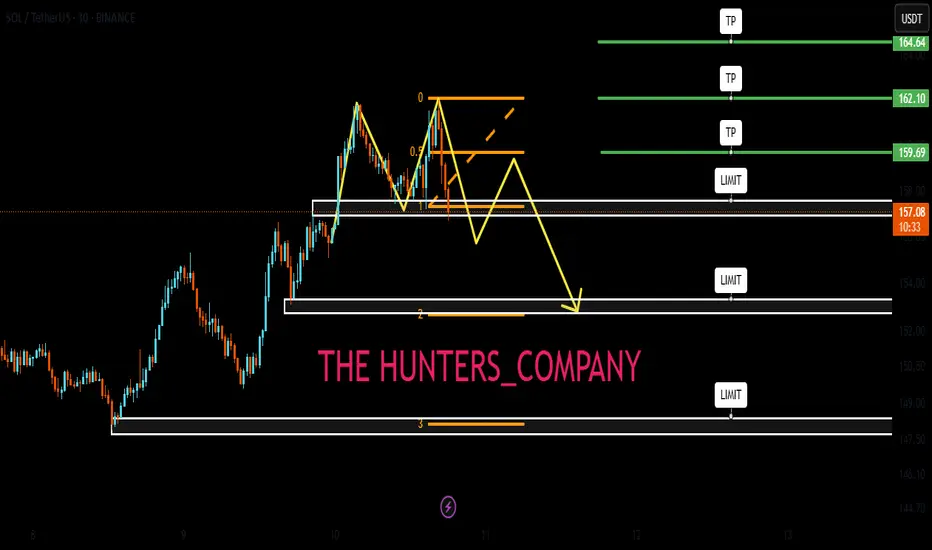
SOLUSDT UPDATEBUY 165
SECOND BUY 158
1.TP 173
2.TP 178
Normally, if it drops 5% after the second purchase, I stop. Read BIO for more.


Solana UpdateHello friends🙌
After the price growth we had, the price hit the resistance level of $160 twice and failed to break it, which caused a double top pattern to form, which if confirmed, there is a possibility of falling to the specified areas.😉
The specified areas are good prices for buying in steps, of course, with capital and risk management.✔
🔥Join us for more signals🔥
*Trade safely with us*
Red Lights for SOLANASolana has recently completed its 5-wave impulsive rise, and now a correction phase appears to be underway. Notably, a diamond top formation has formed and already broken to the downside, further supporting the short-term bearish outlook.
As long as SOL trades below the $180 resistance, this corrective scenario remains valid.
I currently do not expect a drop below the $146 support zone, making this a structured micro pullback within a larger bullish macro trend.
This setup offers opportunities for both short-term short and long entries, depending on how the price reacts near key levels. While the macro structure and fundamentals remain highly bullish for Solana, this correction could provide an ideal re-entry point before the next major leg up.
— Thanks for reading.

Sol will it drop again?Shorting sol with the Profit we made from last trades.
Having tight sl
Book profit wisely. Im going to sleep now

SOL UPDATE - BOXES STILL VALID (ANALYST CRYPTO TANTRIK)boxes provided in the group earlier , had 2 good trades , still looking for a move
boxes are still valid , look for opportunities

Bearish flag on the 4H timeframe for SOL/USDT.Key Characteristics of a Bearish Flag:
1. Sharp downtrend before the flagpole – You can see a strong downward move leading into the pattern, forming the “flagpole”.
2. Consolidation in an upward-sloping channel – The price then moves upward within parallel trendlines, which is the “flag”.
3. Volume often decreases during the flag – While not shown in your chart, volume typically drops during the flag consolidation.
4. Bearish continuation expected – A break below the lower trendline often signals continuation of the previous downtrend.
Additional Notes:
• RSI is rising but still below overbought territory, suggesting there’s room for price action in either direction. However, if a breakdown occurs from this channel with an uptick in volume, it would strengthen the bearish thesis.
• The target for a bearish flag breakdown is typically the length of the flagpole, projected downward from the breakdown point.
Watch for:
• A confirmed break below the lower channel.
• Increased bearish volume during the breakdown.
• Potential support levels around $150 and $145.

SOL next target is 216, after filling this GAP⚡️ Hello everyone! I decided to update my thoughts on SOL. Everything is happening exactly as I wrote last time.
We went down and gathered some liquidity, and also closed the GAP. And now we are near strong resistance at 160-161.
Whether we can consolidate above this level is what will determine the direction of the next price movement.
⚙️ Let's take a look at the most likely direction going forward:
Money Flow - there was an outflow of liquidity at levels above 160, as profit-taking began after a strong rally from the April correction.
However, the inflow ratio is still neutral.
Liquidity Depth - a large accumulation of liquidity has gathered directly above us, at levels 187-200. And as we know, the price moves from one liquidity zone to another.
Overall, liquidity at the top is only increasing, with the difference now almost 5 times greater in favor of short positions.
DSRZ - strong resistance at levels 156-164. This must be overcome and turned into support in order to continue the momentum. As long as we are below it, this is a more bearish signal.
The next nearest liquidity zone is at 130 and below.
📌 Conclusion:
The next move now largely depends on the market as a whole. Historically, markets have frozen in the summer due to a lack of liquidity. However, this cycle has already shown many deviations, and another one would not be a surprise.
I am keeping my position open and continuing to monitor the situation. So far, the overall mood is bullish, and I continue to stick to my thesis that a move to at least 187 is likely, gathering liquidity from shorts in such an obvious place.
Have a great start to the work week, everyone! ☀️

SOL - TradeOur CRYPTOCAP:SOL setup was triggered perfectly.
Now I’ll let it play out and stick to my trading system.
A short-term drop is always possible —
but from here, we should be heading higher in the near future.

soluusd for short *The content on this analysis is subject to change at any time without notice, and is provided for the sole purpose of assisting traders to make independent investment decisions.

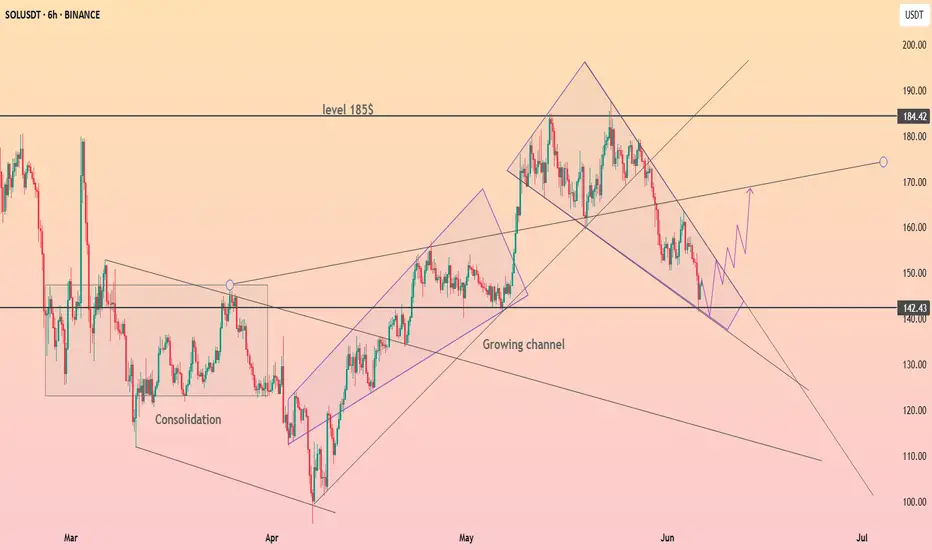
HolderStat┆SOLUSD rebound from 142CRYPTOCAP:SOL just kissed 142 support at the base of its growing channel. Solana price slips from a descending wedge, and holding above trend could propel bids toward 155, then the 170-184 supply band; lose the line and 125 beckons.
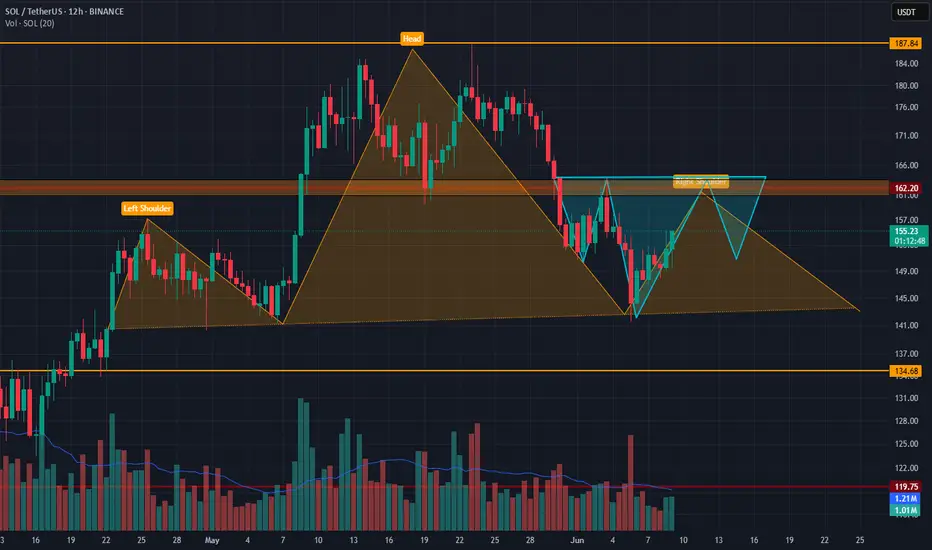
On Solana, 162$ is criticalBINANCE:SOLUSDT
On Solana we are see 2 possible head ans shoulders pattern. İf we cant go past 162$ and the bigger pattern works, things for solana is not so good.
But if we can past beyond 162$ dollars with or without a reverse head and shoulders pattern, the bigger patterns is breaks and we can look for a further bullish movement.
İf you look to my analysis from past, you see a falling wedge on solana too.
I think if Btc dont give any harm, solana wants to go up but one piece of news can change everything.
They took the low — now let’s see if they deliver the high.BINANCE:SOLUSDT just tapped into the BTS 15M zone sitting right above the 0.786 retracement — this isn’t your typical dip, it’s a stop-run with intent.
Here’s the setup:
Sweep of liquidity below 149.47 (key 0.786 fib)
Immediate rejection candle and reclaim of the OB 15M zone
Volume surge near the bottom = likely Smart Money entry
Price is following a textbook schematic. Manipulate, mitigate, and then distribute or expand.
Targets:
TP1: 151.59 (0.5 level — OB 15M reclaim test)
TP2: 153.55 (0.236 + inefficiency fill)
TP3: 155.35 (full expansion to STB 15M zone)
Invalidation: close below 147.88 (sweep without follow-through)
The move has already begun — this isn’t about predicting, it’s about recognizing.
For full market narratives and more setups like this, check the profile. No fluff — just smart structure.

Solana Short Position Update – June 9, 2025We are the SeoVereign Trading Team.
With sharp insight and precise analysis, we regularly share trading ideas on Bitcoin and other major assets—always guided by structure, sentiment, and momentum.
🔔 Follow us to never miss a market update.
--------------------------------------------------------------------------------------------------------
Solana (SOL) Short Position Strategy
DEPP CRAB Short
1st Target: 150
Analysis Summary:
Recently, SOL's price movement faced downward pressure after a short-term rebound and resistance in the overbought zone. From a technical perspective, a short position was taken near the Fibonacci retracement zone and previous resistance level, with targets set based on a gradual decline.
Each target is considered a zone with a high probability of support testing, and a partial take-profit strategy may be effective depending on market conditions. Risk management is essential, and a stop-loss should be set in case of an unexpected rebound.

SOL - Whats next?Planning the move as drawn, just moving it up and then down as depicted - Its a small short scalp

$SOL Tight Range. Big Move Loading? Full Multi-TF Breakdown📊 CRYPTOCAP:SOL Daily Chart
Price bounced from confluence support around $126 (0.236 fib + local structure), but remains below all key retracements from the $184 high.
– RSI hovering around 39 → oversold but no bullish divergence
– MACD still below signal line, weak momentum
– Structure remains inside a descending channel
BTC is testing $106K into weekly close.
If Bitcoin confirms a breakout, SOL could follow with a push above $160.3 (0.236 fib).
Reclaim of $160 → $184 next
Failure → $126 retest, with risk of break toward $118
Trend bias: bearish → neutral
Watching BTC for confirmation.

SOLANA SHORT SETUP The price has induced the pml and did not sweep it, by that it acumullated large ammount of liquidity at the relative equal lows.
I think we are going to retest the orderblock that I marked by the green box which essentialy is the wick on previous monthly candlle, after that the price should break to the downside taking out the acumulated liquidity.
Entry at 173.41
TP 141.33
SL 189.48

SOL/USDT Technical Analyse📉 Downtrend Line: SOL has been following a strong downtrend line, but now the price is consolidating near it and looks close to a potential breakout.
🔁 Fibonacci Support: According to the Fibonacci retracement tool, SOL is currently sitting on a key support zone (you can mention the exact level if you want), which could act as a potential reversal point.
🕯️ Candle Pattern: Today's candle is neutral — neither bullish nor bearish — but the overall structure suggests a possible breakout. Waiting for a confirmation candle would be wise.
📌 Next Move: If the price breaks above the trendline with good volume, a bullish momentum might follow.
⛔ This is not financial advice. Always DYOR (Do Your Own Research).
