Nothing !!!The SOL will increase $150 and reach to the top of the wedge in the coming weeks .
Give me some energy !!
✨We spend hours finding potential opportunities and writing useful ideas, we would be happy if you support us.
Best regards CobraVanguard.💚
SOLUST trade ideas

SOL / USDT - Perhaps First SHORT and then LONG opportunityLooking at the 1D chart, we see that a flag pattern has formed, but it looks like there could be another correction before the 3 upper limit tests and a breakout.
Short now, Long later when it bounces. We'll see..

HolderStat┆SOLUSD 180 $ flip, 200 $ nextSolana price escaped April’s consolidation box, flipped the old down‑sloping resistance into a rising support line, and is now pressing the 180 $ ceiling inside a well‑defined growing channel. A decisive daily close above 180 transforms that barrier into a launch pad, opening the measured channel extension toward 200‑205 $. Channel lows near 150 remain key invalidation for the bullish momentum.

Could SOL Break $200 and Fly 15% Higher Soon?Hello and greetings to all the crypto enthusiasts, ✌
All previous targets were nailed ✅! Now, let’s dive into a full analysis of the upcoming price potential for Solana 🔍📈.
Solana has finally broken out 🚀 — signaling the potential start of a strong bullish leg. With solid confluence between the daily support, Fibonacci retracement, and a well-respected monthly trendline, I’m eyeing a move toward the $210 leve l. A clean break above the key psychological resistance at $200 could confirm this setup. Stay alert — SOL is showing real strength 🔍.
🧨 Our team's main opinion is: 🧨
Solana has kicked off a strong move, and I’m targeting a 15% upside with a main target at $210, once the key $200 psychological level breaks with momentum 🚀.
Give me some energy !!
✨We invest hours crafting valuable ideas, and your support means everything—feel free to ask questions in the comments! 😊💬
Cheers, Mad Whale. 🐋

Solana start a bearish trend in 1h tf!According to macd in 1h and 4h tf we expect a strong bearish trend.

SOL SCALP SetupSOl can retrace to 175$ on ltf, must use sl before taking any trade. Market is too volatile now

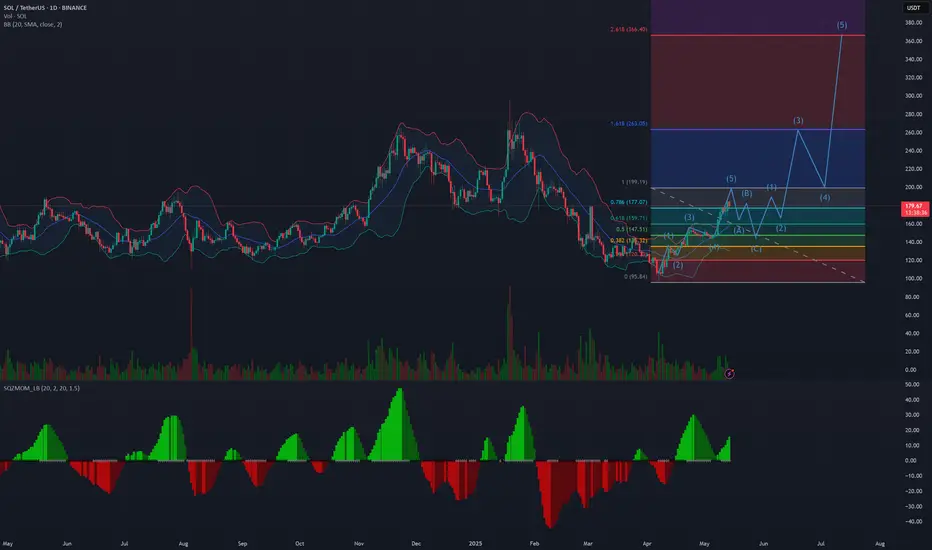
Full elliot count 360$ next targetHello traders! I Think something like this can play. The wave 5 is not finished by maybe we are close to make it, like 190-200$ sounds right. I spect a correction for summer and a big rally until december.
SOLUSDT may rise to 200.0 after long-squeezeMarket maker collected liquidity from 168.5 (liquidation of buyers, entry of sellers and subsequent liquidation of sellers)
After a false breakdown the price went up on a light wave
After the long squeeze, the price is already going to continue the trend with peace of mind.
Ahead is a strong resistance from D1 180 - 180.3.
A break of the level will attract buyers. The target may be 200 - 205
Scenario: a retest of the resistance may end in a small correction. If there is no reversal and the price continues to test 180-180.3, we can expect a breakout, which may attract buyers and further growth to 200 - 205.

Solana Builds Bullish Case – Targeting $170 With 17% UpsideHello and greetings to all the crypto enthusiasts, ✌
All previous targets were nailed ✅! Now, let’s dive into a full analysis of the upcoming price potential for Solana 🔍📈.
Solana is showing strong accumulation within a tight range, with increasing volume suggesting strategic positioning by larger players. Price action is approaching a critical support zone, adding confluence to the bullish bias. A potential upside of at least 17% is in play, with the primary target set at $170. 📈
🧨 Our team's main opinion is: 🧨
Solana is consolidating near key support with strong whale activity—looking for at least **17% upside** toward the **\$170** target. 🚀
Give me some energy !!
✨We invest hours crafting valuable ideas, and your support means everything—feel free to ask questions in the comments! 😊💬
Cheers, Mad Whale. 🐋

SOLANA (SOL/USDT) – Bullish Flag Forming on 4H!Hey traders!
#SOLANA is currently consolidating sideways and printing a bullish flag pattern on the 4-hour timeframe – a classic continuation signal after a strong upward move! 🚀
Here's the plan:
Wait for a clean breakout above the flag's resistance
Enter on the retest of the breakout level to confirm support
Apply strict risk management and target the next major resistance zone
Watch for increasing volume to validate the move
Why this matters?
The bullish flag often leads to explosive moves when confirmed properly. Don’t chase the breakout — let price come to you. Patience = profits. 🧘♂️
Key Levels & Entry Plan marked on chart
Drop your thoughts below – do you agree with this setup or see it differently?
Like & Follow for more clean, no-hype trade ideas!
#Solana #SOL #CryptoTrading #BullishFlag #TradingView #TechnicalAnalysis #Altcoins #CryptoSetup #BreakoutTrade


Is Solana's Price Action Already Priced In?We are the SeoVereign Trading Team.
With sharp insight and precise analysis, we regularly share trading ideas on Bitcoin and other major assets—always guided by structure, sentiment, and momentum.
🔔 Follow us to never miss a market update.
🌟 Solana: One of the Highest Potential Assets in the Market Right Now
Riding the wave of Bitcoin’s bull market, Solana is showing remarkable potential, moving in sync with the broader market trend.
🎯 Price Targets:
1st Target: 179.5 — Breaking the initial resistance
2nd Target: 181.3 — Mid-term upward objective
3rd Target: 182.9 — Strong trend formation zone
We are positioning to buy Solana in bulk, capitalizing on its high potential during Bitcoin’s bull run.
However, whether Solana will continue its upward trajectory or if it has already been priced in and is due for a pullback is something only time will tell.
🚀 Is now the perfect moment to enter Solana, or should we wait? The market will reveal the answer.

HolderStat┆SOLUSD fixed above the trend lineSOL spent March in a messy consolidation box before rotating into a disciplined rising channel that has marched price from 110 to the doorstep of 180. Bulls are now wrestling with that major horizontal barrier; acceptance above it would turn the former ceiling into fresh support and open the calculated channel extension toward 205. Until channel lows around 150 give way, trend traders may lean on pullbacks inside the lane to stay positioned with momentum. 🔥

Solana 1-Day Chart – Are We on the Brink of a $1,000 MOONSHOT?!Solana is absolutely on fire! On this 1-day chart, we’re witnessing a massive rising channel that’s been building since 2023. After a solid rebound from the $93 support, Solana has smashed through a fractal resistance line (check that arched arrow from mid-2023 to early 2024 top) . Now, it’s breaking out at a parallel resistance, hanging around $174 — and this could be the setup for a MASSIVE move upward!
I’m calling a potential target of $1,000 if SOLUSDT can muscle through the big resistances ahead: $200, the ATH at $270, and everything beyond. This breakout screams opportunity — Solana might just catch another wave of demand and go parabolic! The $93 support (marked "Back to Nothing Below This Line") looks rock-solid, giving us a strong foundation for this rally.
Key Levels to Watch:
Support: $93 (channel base)
Current Price: $174 (breakout zone)
Resistances: $200, $270 (ATH)
Target: $1,000 (if momentum holds)
Are you ready for this? I’m buzzing — I can’t believe this might actually happen!
Let’s hear your thoughts, traders! Are we heading to $1,000, or will resistance hold us back?

SOL Inverted Head and Shoulders – Breakout Potential!🚀 SOL Inverted Head and Shoulders – Breakout Potential! 📈
SOL has formed an inverted head and shoulders pattern and is now testing the red resistance zone. If the price breaks through this resistance, the first target could be the green line level! 📊
Let’s watch this breakout unfold! 💼💸

SOLUSDT UPDATE
Pattern: Falling Wedge Breakout
Current Price: \$173.38
Target Price: \$300
Target % Gain: 105.90%
Technical Analysis: SOL has broken out of a falling wedge pattern on the daily chart, indicating a bullish reversal. Strong momentum and breakout confirmation suggest a potential move towards the \$300 level.
Time Frame: 1D
Risk Management Tip: Always use proper risk management.

SOLUSDT | ANALYSIS
BRAEKDOWN
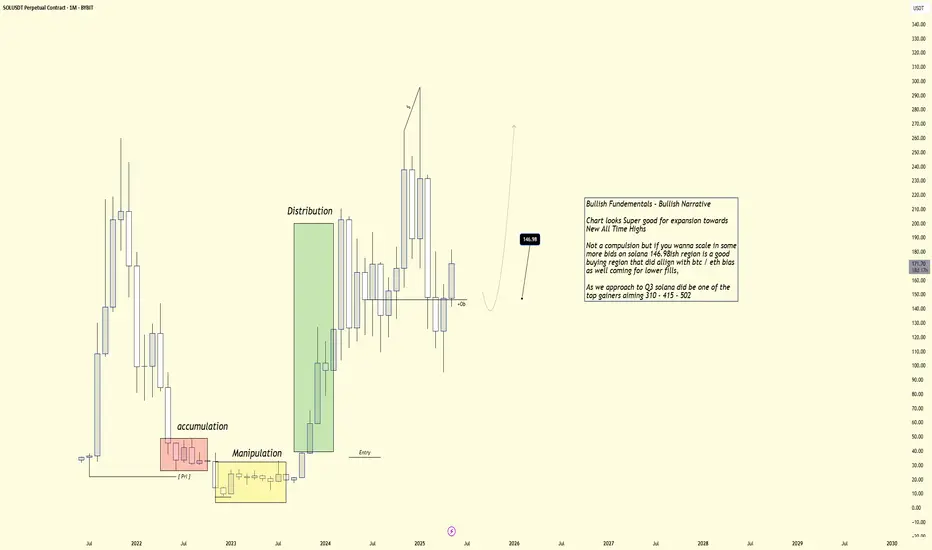
Bullish Fundementals - Bullish Narrative
Chart looks Super good for expansion towards New All Time Highs,
Not a compulsion but if you wanna scale in some
more bids on solana 146.98ish region is a good
buying region that did allign with btc / eth bias
as well coming for lower fills,
DCA ENTRY
146.98
TRIM REGION
As we approach to Q3 solana did be one of the
top gainers aiming 310 - 415 - 502
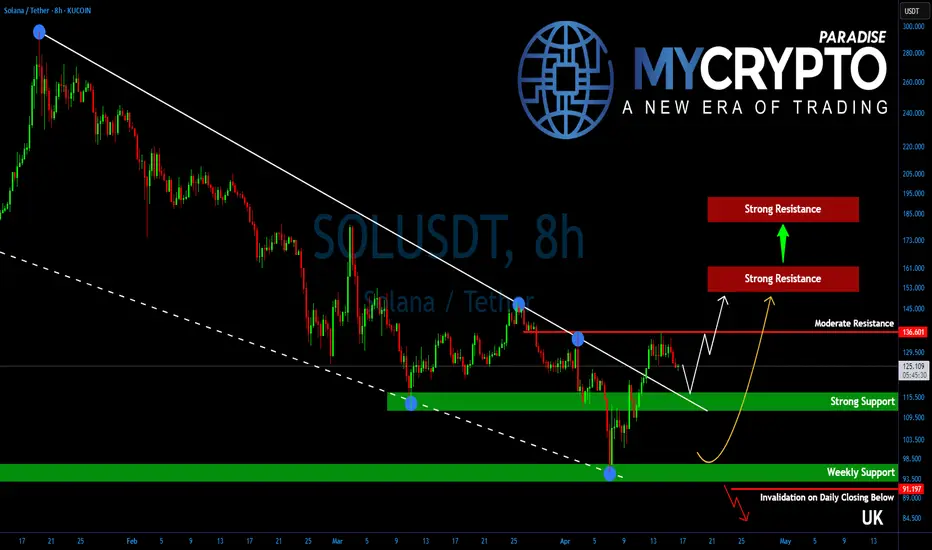
Solana Is One Breakout Away From a Bullish Explosion!Yello, Paradisers! Did you notice how #SOLUSD has been quietly positioning itself while the rest of the market remains uncertain? If you're not paying attention right now, you could be missing one of the cleanest setups on the charts.
💎After several weeks of downside grind and tight consolidation, Solana has just broken out of a falling wedge—a powerful bullish pattern that typically signals trend reversals or the start of a strong upside leg. This breakout wasn’t random either. It occurred after SOL successfully defended a key higher time frame support zone, signaling strength behind the move.
💎For #SOLUSDT, all eyes are on the $136.50 resistance level. This is a critical structural pivot. A clean break and close above this level would confirm a shift in higher time frame momentum from neutral to bullish. Until that happens, bulls still need to proceed with caution—but the setup is clearly developing in their favor.
💎Adding conviction to the idea of a bullish breakout are several supporting factors. Oscillators are showing bullish divergences, a classic sign that seller momentum is fading. At the same time, a golden cross formation on the 12-hour chart is getting closer which typically precedes sustained trend reversals and stronger moves to the upside.
💎If bulls succeed in reclaiming $136.50, the next price targets are $155–$160 as the initial strong resistance zone where some profit-taking could occur. If bulls hold strength, SOL is likely to head further higher and aim for $180–$190, which lines up with the target of the wedge pattern. This is a strong resistance zone and a level which could mark end of the corrective phase for Solana.
💎On the downside, immediate support lies between $110–$115. This is a well-defined range of demand and should offer strong buying interest if any short-term pullbacks occur.
Paradisers, strive for consistency, not quick profits. Treat the market as a businessman, not as a gambler.
MyCryptoParadise
iFeel the success🌴
SOLUSDT | Long Bias | Healthy OI | (May 12, 2025)SOLUSDT | Long Bias | Healthy OI + Spot Demand Rising | (May 12, 2025)
1️⃣ Short Insight Summary:
Solana is showing strength with open interest rising alongside spot price—a sign of real buyer demand, not just leverage-driven moves. The setup leans bullish, and shorting here would be risky.
2️⃣ Trade Parameters:
Bias: Long
Entry Zone: Around $144
Stop Loss: $116 (wider SL for structure protection—not for scalping)
TP1: $155
TP2: $178
TP3: $207
Final TP: $288
Partial Exits: Strongly recommended at each target to lock in gains and reduce risk
3️⃣ Key Notes:
✅ Open interest and spot price are both increasing—a sign of healthy demand.
✅ This isn't a time to fight the trend. Probability favors longs here.
❌ Shorting would feel like handing free money to the market—smart risk management is key.
✅ We're not looking to overtrade this—treating it like a swing setup with structure-based levels.
✅ Keep an eye on correlated plays—like the equity Hotel, which is to Solana what MicroStrategy is to Bitcoin. If Solana rallies to $500 (which is optimistic, but possible), names like Hotel could benefit heavily.
4️⃣ Optional Follow-up Note:
I’ll be tracking this trade zone closely and will update if anything major changes in price structure or momentum.
Please LIKE 👍, FOLLOW ✅, SHARE 🙌 and COMMENT ✍ if you enjoy this idea! Also share your ideas and charts in the comments section below! This is best way to keep it relevant, support us, keep the content here free and allow the idea to reach as many people as possible.
Disclaimer: This is not financial advice. Always conduct your own research. This content may include enhancements made using AI.

SOL Hits Major Resistance — Patience Over FOMOOne of the most common mistakes traders make—especially in fast-moving markets—is jumping into trades impulsively at major resistance. It feels exciting when price is surging, but ironically, this is often where risk is highest and reward is most limited.
Why? Because historical resistance zones—like the $175–$183 region on SOL—tend to attract heavy sell pressure. These are levels where many past buyers look to exit, where smart money hunts liquidity, and where false breakouts are most common. Without volume confirmation and a proper retest, breakouts through such zones often fail.
That’s why experienced traders wait. The smarter approach is to let the market come to you, and only act when one of two things happens:
A pullback into a well-defined, confluence-rich support zone
A clean breakout above resistance, followed by a retest and confirmation
SOL has respected structure beautifully, but now is not the time to chase. Either wait for a healthy correction into support, or let price prove its strength through a confirmed breakout. No trade is also a trade — and capital preservation is the foundation of long-term success.
Patience isn’t passive — it’s a strategy. Let the market come to your desired levels. You don't need to catch every move, only the high-probability trades and there aren’t born from impulse — they’re built on patience, structure, and right timing. 💎
Technical Breakdown
SOL has entered a major resistance zone between $175 and $183 — a historically significant level respected for over a year.
Within this zone lie two key highs:
$179.85: Recently swept with a clean Swing Failure Pattern (SFP)
$180.52: Still untested — if broken, it would confirm a strong bullish continuation
Breaking through such a well-established resistance on the first attempt is uncommon — it typically requires momentum and structure. A rejection here would suggest that SOL needs a healthy correction before mustering the strength for a true breakout.
📉 Elliott Wave Count
Looking at the structure, we’ve completed a 5-wave sequence — signaling the potential end of this impulse leg. According to Elliott Wave Theory, a corrective phase is now expected before continuation.
📐 Additional Confluence: Fib Speed Fan
The 0.618 Fib Speed Fan — drawn from the all-time high at $295.83 to the swing low at $95.26 — aligns perfectly with this resistance zone, adding more weight to the idea of a potential rejection or pause.
🟢 Long Setup: The Next High-Probability Entry Zone
We now shift our focus to where the next long opportunity could arise. Here’s the technical confluence:
Anchored VWAP from the recent low at $141.41 sits at $164.70
4H bullish order block around $164.46
0.382 Fib retracement of the full 5-wave impulse: $165.42
0.412 Fib retracement: $164.25
All these levels converge in a tight band, providing a solid long entry zone between:
Long Entry Zone: $165.50 to $164.25
Stop-Loss: Below $160 (to protect against any deep wick)
Targets:
TP1: $171.75 (Point of Control from the range)
TP2: $180.00 (resistance retest)
TP3: $200.00 (psychological level)
Estimated R:R: ~6:1 — High-conviction setup
Bonus: If price returns to this $165 zone within 24 hours, it will also be supported by the 0.618 Speed Fan — adding one more layer of support.
🔴 Short Setup: Reversal Play at $200
For those watching from the sidelines or looking to fade the rally, the psychological level at $200 presents a strong short opportunity — but only on confirmation (e.g., SFP or bearish engulfing).
Short Entry: On rejection at $200
Stop-Loss: $206.10
Target: $187.00
Estimated R:R: ~2:1
🧠 Summary:
Completed 5-wave structure → potential correction phase underway
Strong resistance at $175–$183 with SFP and speed fan alignment
High-probability long setup at $165.5–$164.25 with multi-layered confluence
Potential short at $200 on confirmation
⚠️ Key Takeaway: Don’t Chase the Highs
This is where many traders slip — FOMOing into trades at major resistance. Please, don’t do it. Instead, wait for:
A pullback into well-defined support (like the $165 zone), or
A clean breakout above $180, followed by a confirmed retest
____________________________________
If you found this helpful, leave a like and comment below! Got requests for the next technical analysis? Let me know.

SOLANAMy Trade Plan: Waiting for the $165 Liquidity Tap
I’m locked in on the 2-hour chart, hunting for a high-probability long setup at $165, where a key demand zone aligns with recent liquidity pools. This level has acted as support in April and May 2025, soaking up buy orders before reversals. I’m waiting for SOL to tap $165 (ideally with a bullish candle like a hammer or engulfing pattern) and then confirm a break of structure (BOS) by taking out the recent 2H higher high at $182. This would signal a new bullish impulse wave.
For risk management , I’m placing my stop loss just below the closest liquidity level at $161, a zone where stop hunts often occur before reversals, as seen in CoinGlass liquidation data. My target? The next resistance at $195 (a 17.6% move) or even $220 (33.3% upside) if SOL breaks out of its current bull flag pattern, as noted by analysts on TradingView. I’ll trail my stop using a 1.5x ATR (currently ~$3.50) to lock in profits if the move runs.
Why the Hype?
Solana’s fundamentals are screaming bullish. Over $450M in assets were bridged to Solana in April 2025, with $300M from Ethereum, boosting DeFi activity. SOL’s DEX volume hit $3.32B daily, grabbing a 28.99% market share among blockchains, per DefiLlama. Stablecoin supply on Solana exploded by 156% in 2025, surpassing GETTEX:13B , with USDC dominating. Add in projects like Sanctum (up 44% in deposits) and Jito’s liquid staking, and SOL’s ecosystem is a rocket ship. Despite past outages, upgrades like QUIC and stake-weighted QoS have kept the network humming.
Final Thoughts
Solana’s bullish structure and ecosystem growth make it a top-tier altcoin, but I’m not chasing this pump. I’m waiting for that $165 tap and a break of structure above $182 to confirm my long entry—patience is my edge! Crypto trading is a wild west showdown—volatility can crush you. Always use tight risk management, set stop losses, and do your own analysis before pulling the trigger. Let’s catch this wave, but only when the stars align!

$SOLUSDT likely to retrace for a bigger bullish move!!!BINANCE:SOLUSDT looks like it is running out of steam as it approaches a major resistance. In the coming weeks, BINANCE:SOLUSDT is expected to retrace back to a minor support and resistance zone (marked out in the chart) where it will gain reasonable momentum for a bigger pump to at least $260 and above. Be on the lookout.
Kindly support this analysis to enable it reach to other people, and do comment your thoughts.

Long trade
🟩 Buyside Trade Log
📈 Pair: SOL/USDT
🏷️ Type: Intraday | LND → NY Session PM
🧠 Setup: Breakout
🆔 Trade ID: #SOL-0511B
📅 Date: Sunday, 11th May 2025
🕐 Time: 1:00 PM
🔹 Entry Price: 172.541
🔹 Profit Target: 178.912 (+5.02%)
🔹 Stop Loss: 172.316 (-0.31%)
🔹 Risk-Reward Ratio: 16.24
The buyside breakout was confirmed during the LND to NY session transition. Price action displayed sustained momentum through prior resistance, accompanied by strong volatility during the session overlap. Market structure and order flow favoured continuation, with a clear liquidity void overhead. The entry signal was triggered as price reached the previous and pivotal zone — the Sellside/Buyside In Balance (SIBI) area — further validating directional intent.
