Double bottom on the way up!Solana seems to still have more breath to push the price up the page from this double bottom after a strong push up with good volume! It has a good chance to push the price to 180 if you have the stomach to ride it!
SOLVVS_80FDCC.USD trade ideas
Solana Bounce Setup – Trendline + Demand Zone ConfluenceSOL is testing a confluence zone between rising trendline support and a key demand block around $161–$162. This zone has acted as a springboard for the last leg up and now overlaps with a full Stoch RSI reset on the 1H timeframe.
If price holds this structure, a continuation toward the previous supply zone at ~$166 is in play. Breakdown below $159.68 would invalidate the setup.
📉 SL: Below structural low
📈 TP: Prior high / liquidity zone
📊 Watching candle structure for entry confirmation
#SOLUSD #Solana #PriceAction #TrendlineSupport #CryptoSetup #QuantTradingPro #TradingView

Solana Wave Analysis – 11 July 2025- Solana broke resistance zone
- Likely to rise to resistance level 180.00
Solana cryptocurrency recently broke the resistance zone between the resistance level 159.80 (which has been reversing the price from the start of June) and the 61.8% Fibonacci correction of the ABC correction (2) from May.
The breakout of this resistance zone should accelerate the active impulse waves 3 and (3).
Given the strongly bullish sentiment seen across the cryptocurrency markets today, Solana can be expected to rise to the next resistance level 180.00.

LONG - I am going to add more position when this happensI currently have a small size of long position but I am planning to add more (please see my previous article for my first trade set up), but I am waiting for a certain set up to come up:
Daily:
1) all momentum indicators are entering the bull zone, so there is a plenty of room to move to the upside.
2) The candle has crossed and closed above both EMA 21 and 55, but EMA 200 is currently working as a resistance.
3) EMAs have not crossed and lined up for the bull trend - 21> 55> 200
4H:
1) EMA55 has finally crossed above EMA200!! But when they cross, the price very often has a decent pull back before taking off.
2) Stochastic and RSI are already in the overbought territory which tells me the pull back is likely to happen.
The chart is looking really good for the bull but I am going to wait for the price to retrace to Fib0.5-0.618 zone (see blue rectangular box in 4h chart).
If the price rebounces from that zone and momentum indicators reset to move to the upside, I am prepared to go big on long.
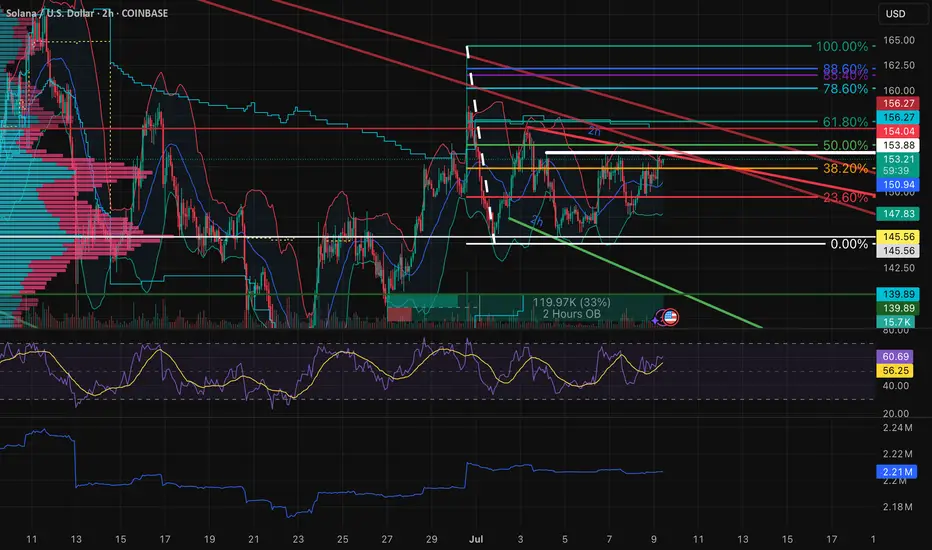
$SOL | Triple Top or Launchpad?Macro to Micro Context:
SOL is now testing a third rejection in the upper 153s, forming a textbook triple top just under a multi-month descending trendline and major Fib resistance. This ceiling has held firm since late June, despite higher lows grinding up from below. Price is now squeezed tightly between compressing demand and stacked supply, with volatility contraction apparent across the board.
The structure is coiling hard but momentum and volume must confirm resolution before positioning aggressively.
Structural & Momentum Breakdown:
Resistance Layering (Reinforced):
Triple Top: Price has repeatedly failed to break above the upper 153s.
Fib Overlap: 50%–61.8% retracement range aligns with both trendline resistance and OB stack.
Order Block Stack: Resistance from mid-153s to low-154s is now reinforced across timeframes (30M → Daily).
Momentum Shifts:
RSI Divergence: Lower highs on RSI across 2H/1H, despite flat or slightly higher price.
PVT Flattening: No fresh accumulation during recent tests.
Volume Decline: Progressive volume deterioration on each retest distributional tone building.
Demand Shelf:
Key demand and support range from low-150s to mid-151s has held through three separate dips.
This is the immediate pivot zone — lose it and vacuum effect likely down into the upper 140s.
Updated Trade Plan:
Rejection Short Setup:
Entry: Breakdown through mid-151s with confirming sell volume.
Stop: Above low-154s to account for potential deviation wicks.
TP1: Upper 148s (first OB cluster).
TP2: Mid-146s (Fib + minor support).
TP3: Low 140s (macro demand + wedge base).
Bear Confirmation: RSI breakdown + volume expansion + OB flips into resistance.
Breakout Setup (Only on Clear Validation):
Entry: Strong candle close above low-154s with breakout volume.
Stop: Below low-151s — invalidation of reclaim.
TP1: Upper 157s (Fib zone).
TP2: Low 160s (swing high area).
TP3: Upper 160s (macro breakout expansion).
Bull Confirmation: RSI > 62 on 2H, strong PVT rise, and flip of local OB into demand.
Risk Warning:
Triple tops near macro resistance are high-risk unless clearly broken. This zone is overloaded with historical rejection. Don't front-run the breakout — volume will show you who's in control.
Closing Thoughts:
With a confirmed triple top now visible, SOL is facing its most important rejection zone in weeks. Bulls must reclaim with strength or this becomes a clean setup for rotation into the mid to low 140s. Patience and confirmation are key here. Keep risk asymmetric.
What I See on SOLUSD Crypto Hi, I'm making this simple, so SOL coin had a crazy run in 2024 now it's in a dip faze and ranging era so therefore I'm buying low and dips area don't make profits complicated
not a Financial Advisor so please take at your own risk

Opened longI opened a long position.
Ideally it is safe to wait for EMAs to line up for the bull trend (EMA21 > 55> 200) in the Daily chart. However, there are many indications that the price will start to move to the upside and the upside move might be quite aggressive. So I decided to open a long position with a small position size.
The reasons for opening a long position:
Daily:
Bull candle has closed above EMA21 for a few times.
RSI lines have crossed and entered the bull zone.
MACD lines are about to enter the bull zone.
Stochastic lines are above to cross and move up.
The price has been staying above Fib 0.236 level for about 10 days.
The price has broke and closed above the descending parallel channel.
4H:
All momentum indicators are in the bull zone.
EMA21 is above EMA 55.
The price has closed above EMA200.
The price is consolidating above the top descending parallel channel.
It is not the perfect bull trend set up, however, there are enough confluences for the price to start to move to the upside.
Entry price: $142.59 (blue horizontal line in 4H chart)
Stop Loss: $130.40 (red horizontal line in 4H chart)
Target: $195 (green horizontal line: Fib 0.5 level in Daily chart and fair value gap zone)
$178 is a strong support and resistance area, so if it starts to stall, I might take a partial profit.
Fingers crossed.

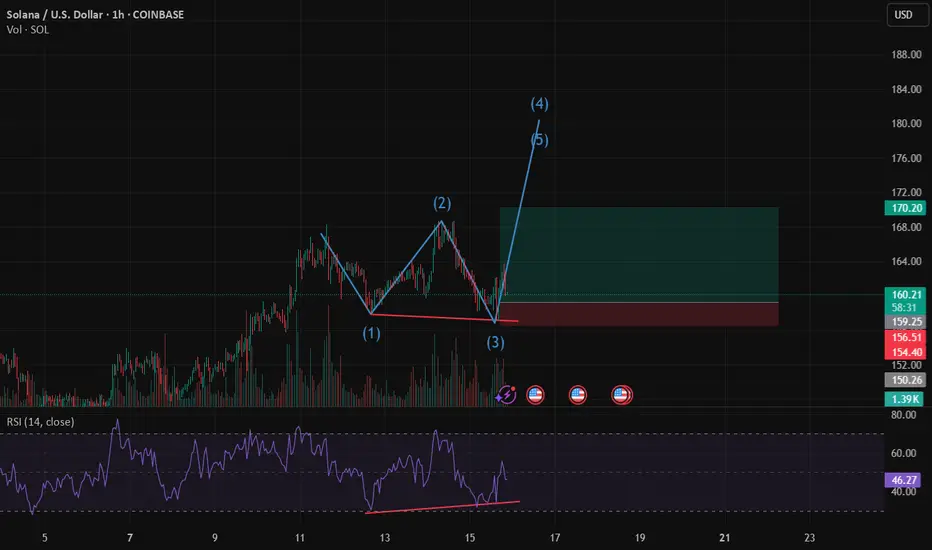
SOL Short Trading Setup: The Alligator Awakens!
Wave 4 wedge forming — watch for breakdown. Neely rules and Alligator indicator confirm setup.
SOL Trading Setup: The Alligator Awakens! 🐊
The Chart Breakdown
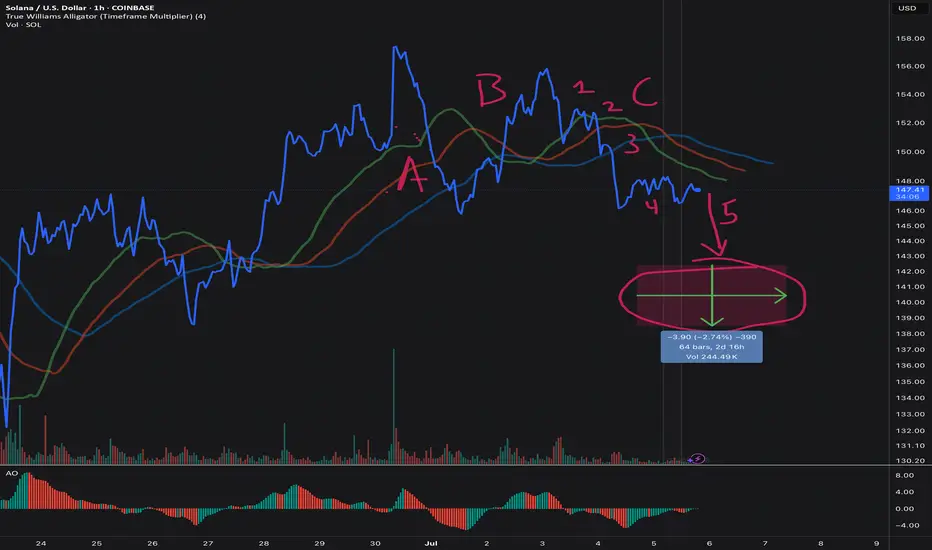
Looking at this SOL/USD hourly chart, we’ve got a textbook Elliott Wave setup using the Williams Alligator and Neely’s NeoWave rules .
The Wave Count Story
ABC : That larger three-wave rally? Done and dusted. ✅
1-2-3-4-(5) : We're now in a five-wave decline, currently sitting in wave 4.
Neely Rules Check ✔️
Price & Structure:
Wave 3 is not the shortest: travels farther than wave 1 and exceeds projected wave 5 → ✅
Alternation: Wave 2 was a sharp ABC; Wave 4 is a flattening wedge/triangle → textbook alternation ✅
No overlap: Wave 4 doesn’t enter wave 1 territory → clean as a whistle ✅
Equality guideline: The green box shows −2.74 %, mirroring wave 1 → picture-perfect ✅
Time Rules (Neely’s most overlooked):
Wave 4 has taken ~25 bars vs. wave 2’s ~15 bars → passes the time-ratio test ✅
Wave 5’s projected end falls within the vertical marker from wave 4’s high → on schedule ✅
Alligator & AO Confirmation 🐊
Alligator lines compressing during wave 4 → energy is building
AO divergence: red bars deepen in wave 3, shrink in wave 4 → classic wave 5 setup
The Trading Plan 🎯
Entry Strategy:
• Stop-limit sell just below wedge support (~$147)
Risk Management:
Stop Loss: One ATR above wave 4 high — protects against a throw-over
Time Stop: Exit at market if not in profit after 70 bars
Profit Targets:
TP-1: 100 % of wave 1 length (green arrow)
TP-2: Trail stop if AO shows bullish divergence near target zone
The Caveat ⚠️
If wave 4 drags on much longer (>2× its current length), it could evolve into a complex correction. Time is key — watch that clock.
Bottom Line
This setup checks all the NeoWave impulse boxes. The structure is clean. The Alligator is asleep. And we’re approaching a wedge break.
Short the break, target the equality zone, and respect your time stop.
Good traders follow rules. Great traders follow Neely rules. 😉
Agree or disagree? Drop a comment or share your chart!
solusdtThe breakout area has been successfully tested and we will see the next step, the drop to the shaded area.
*In principle, I am not a supporter of any direction, but I am only giving my point of view, which may be right or wrong. If the analysis helps you, then this is for you. If you do not like this analysis, there is no problem. Just ignore it. My goal is to spread the benefit. I am not one of the founders of the currency.

Sol searching, for an entry. If you find this information inspiring/helpful, please consider a boost and follow! Any questions or comments, please leave a comment!
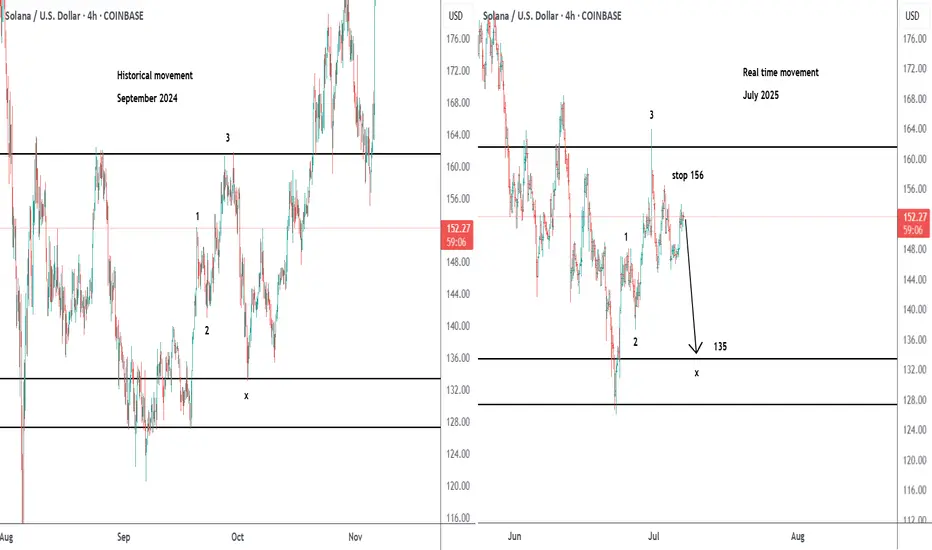
The Elliottician’s Paradox: 12-12 or Zigzag? Bias Is the Key
Ever stare at a chart and ask, “Is that a 12-12 or a classic zigzag?” Yeah… welcome to the paradox we Elliotticians live in. Pattern recognition’s a blessing and a curse because context is everything, but confidence can get you wrecked.
This one’s got me on the edge.
What’s Happening Here
We’re currently watching a move that could be either:
- A corrective zigzag (5-3-5), or
- A 1-2, 1-2 setup, gearing up for a blastoff
That’s the core dilemma — two valid options, both technically legal. So what tips the scales? Bias.
The Line in the Sand: 152
Here’s what I’m watching for:
Key Level: 152
- That’s the bull/bear line for me.
- A strong impulsive reclaim above 152 flips the script. I’d reconsider the bearish view if price surges with intent.
- But if we return to 152 in a sluggish, corrective way? I’ll be eyeing continuation lower, aligned with a more traditional zigzag structure.
Elliott View
This is where the paradox plays out:
If we’re looking at a 1-2, 1-2 setup, expect:
- A powerful Wave 3 soon (should not be shy)
If it’s a Zigzag ABC:
- Then we should expect a corrective internal retracement and continuation to the down side, at minimum past the origin of the initial move.
The chart will speak loudest. But structure and strength of this next leg will confirm the story.
Final Thoughts
Trading isn’t about being right. It’s about managing scenarios — and this one’s a classic fork-in-the-road moment. I’ve got a plan for both directions.
152 is my trigger. Stay below it and fade the rally. Break above it impulsively, and I’ll flip my bias with it.
The Elliottician’s paradox isn’t a trap — it’s an invitation to stay sharp.
Your Turn
How are you reading this structure? Do you favor the zigzag or the 1-2 setup? Drop a comment and let me know.
Trade safe, trade clarity!

Solana Bullish Outlook Above $140.0Solana's decline from 163.9 eased near the $148.4 support. However, this demand zone expands to $140.0, which is backed by the high volume node.
From a technical perspective, the outlook is bullish as long as Solana trades above $140.0. In this scenario, we expect the price to target at least 50.0% of its previous range, which is approximately $155.38.


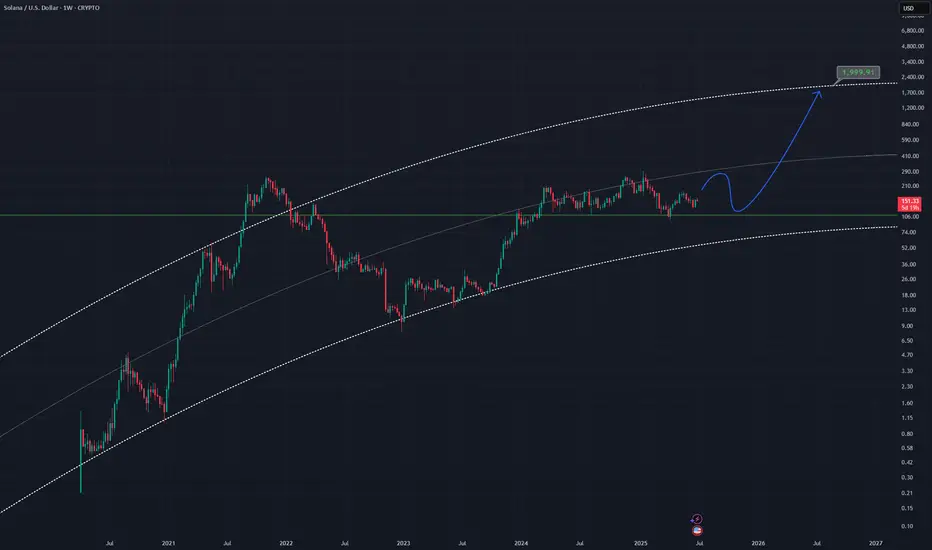
SOLUSD - Bull Ideaan idea for the bulls showing a curved channel rising
Once the bulls kick in price may push up to the top of this channel as it has before, putting price at around 2k
SOLUSD is a good altcoin pick imo
Weekly chart
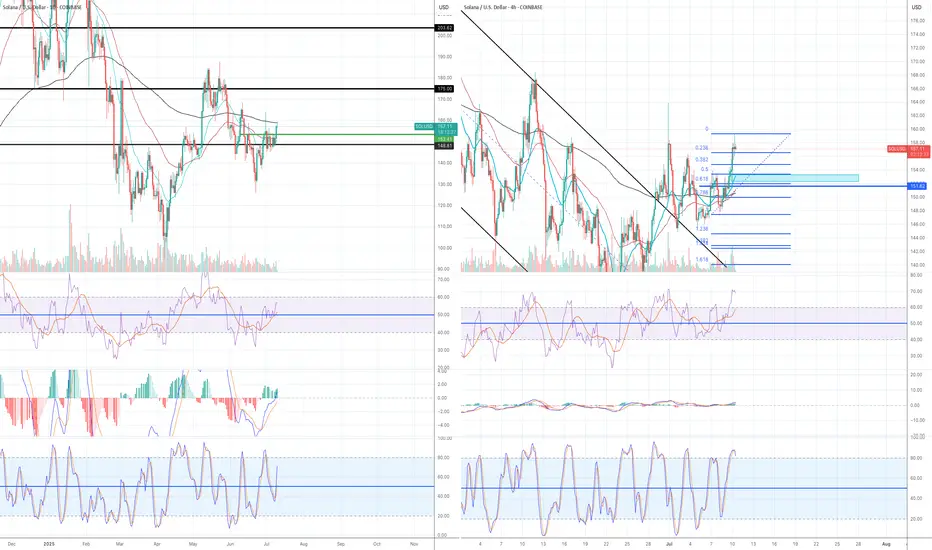
Getting close to go long!
Solana bullish momentum is building up from both technical and fundamental perspectives.
Daily chart:
1) A daily candle decisively moved and closed above EMA21 on Sat 28th June.
2) RSI and MACD are still in the bear zone but the lines are crossed and now moving upwards.
3) RSI line is now above 50. When the RSI line moves above 50 and EMA21 closes above 21 at the same time, it is often (not always) an early sign of bullish momentum (see blue vertical lines in daily chart).
4H chart:
1) EMA21>EMA55, but EMA200 is still moving horizontally.
2) All momentum indicators have entered the bull territory. However, when the candle finally broke outside the descending parallel channel and broke and closed above EMA200, momentum indicators reached the overbought territory. It means the price is likely to consolidate first before taking off.
I plan to open a long position when:
1) Wait for the momentum indicators to come down and flip to the upside in the 4H chart.
2) A candle to retest, either EMA 21, 55 and/or 200 and forms a strong green (bullish) candle in the 4H chart.
3) A candle stays above EMA 21 in the 4H chart.

SOLUSD IH&SHi Everyone. Sol USD Looks ready. IH&S Breakout in play. Not financial advice. Please do your own research.

SOL Ready To Breakout?SOL had a decent move this weekend overcoming descending resistance and now testing as support.
Price appears to have a completed a wave (2) at the .618 Fibonacci retracement and S1 daily pivot and a larger degree wave 2 at the channel bottom, High Volume Node support and .618 Fibonacci retracement.
If a wave (3) of 3 is underway then we should expect a strong move sooner rather than later with an initial target of the swing high resistance a/ R2 daily pivot $208-$216 range
Safe trading.

hellohello I think market is bullish now seeing the curve lines and specially ema plus the rsi is in oversold area

$SOL Bullish Engulfing On WeeklyCRYPTOCAP:SOL closes the week with a Bullish Engulfing candle.
50WMA at $170 next target to smash.

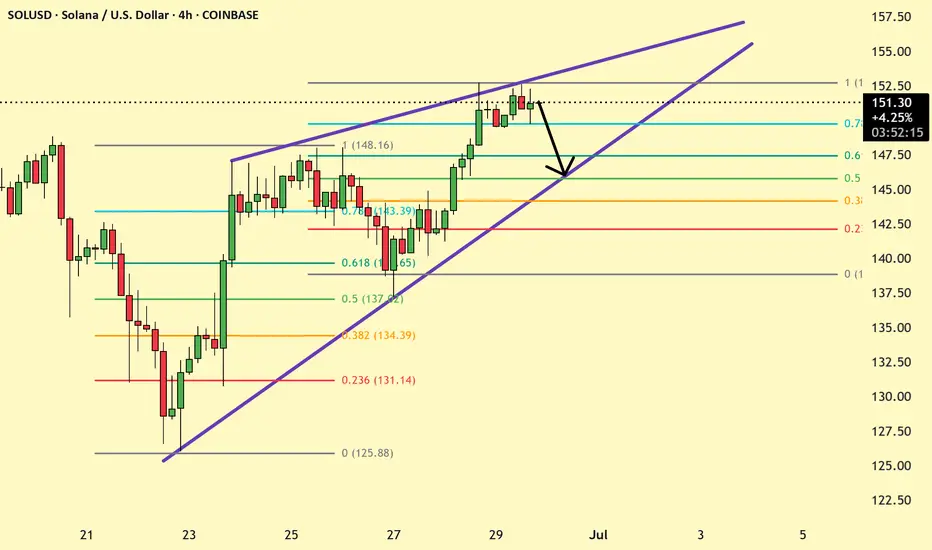
SOLANA 4 hr pullback on play SOLANA had recently high rally reached resistance around 152 , before it Resume bullish pullback to 145-147 is possible with 153 stop loss.
SOLANA Weekly Chart pull back from 0.382 Fib Bullish engulfing The Swing low and high indicate the bullish trend ahead for solana after forming a bullish engulfing candle More growth coming.

Solana coin Long setupIn this video I go through the current price action and talk about how the 126$ target level was recently reached for a clean long entry and on the daily timeframe we printed a higher low .
I expand on my thoughts for a continuation to the upside and to retest some higher levels of resistance 180$s and time will tell if we print a higher high at the 180$s before retesting the $200 zone .

Solana Heading to 112 or 330+Hey fam
So for Solana if we hold under 148 then a drive down to 112 makes sense. However if we drive above 148 then we can possibly hit weekly targets of 330
Make sure you adjust accordingly in a smaller time frame to ensure your in the right move
Happy tradings folks
Kris Mindbloome Exchange
Trade Smarter Live Better
Under 148 we go to 112 if we break 148 we can see a drive up to 338
