SPX Short Puts - An Idea to testI dont like paper trading because it doesnt seem real. Just like online poker thats not for real money, its hard to care enough. So I put this trade on this morning, SPX Sold 5735 Put and Bought 5700 Put for $5.95 credit 8 day expiration (May 30). An 8 day trade is of course exposed to overnight and over a long weekend risk but its traded around the support range of the gap fill. I built the spread at the strikes I wanted then moved it out in expiration until it had an amount of credit I felt good about it.
Theres been an upward drift on it so far today so its gone in my favor, I dont recall what the delta was at the time but its 18.51 now so it had to be in the 20's. Its up $115 right now so it could be closed as a winner and I can come back tomorrow for something else, but I'm going to leave it open. The thought here is I like the support level of 5720 if the gap fill occurs, it should have a decent bounce if it even gets there so my 5735 shouldnt get into that much more trouble anyway. The idea here is if it even gets to the range of it, I roll it because regardless of what happens, I dont think its going to stay below 5720 for too long. The other part of the idea is if the market drifts sideways or upward, I can roll it out daily to maintain about the same delta and collect some credit. I dont really want to go longer than 9 or 10 days though so I'd have to look for a different strike when it moves too high.
SP500FT trade ideas

Quick updateSP500 and Gold both consolidating, not much action but I think we may see some movement overnight

S&P 500: Consolidating & forming bull flag on support trendlineSo, we all know that the market is taking a breather, and the past week has been mostly flat (kind of). There have been plenty of headlines, some good, some bad. Most notably, the news about the Moody's US credit downgrade. I woke up one morning, took a look at LinkedIn and saw all the CFA-certified investing experts expecting a massive game-changing moment, potentially a market crash.
Except, the market hasn't responded so negatively. In fact, I'd say that while long-term yields have been rising, the market has been doing its own thing .
For instance, taking a look at the daily chart of the S&P 500 paints a different picture of the doom and gloom that I've been hearing ALL weekend and ALL week long. As you can see, the index is currently sitting on the daily support trendline which goes back to the 7th April low.
On that trendline, taking a closer look, it seems the flat price action has been forming a bull flag. It's quite narrow and tight. But it certainly is a fine-looking bull flag. And a break above that would take the S&P 500 even higher.
This would also likely have a positive effect on other indices. Furthermore, it might be worth keeping an eye on the big S&P 500 stocks that are high-beta and like to follow the market.
So, to my point about how the market has been doing its own thing...seems that the Moody's downgrade could have possibly been already priced-in. I could be wrong, of course, as markets are still quite volatile and fragile to any sort of macro and global developments about trade and conflicts around the world.
Thank you for reading.
Note: not financial advice

S&P500 Short: C WaveI believe that the correction up in 5 waves has ended as a B wave. And we should go into a C wave now.


Pimp Your Indicators – A Smoothed Take on RSIYou don’t need to reinvent the wheel to find new and effective trading tools. Often, enhancing classic indicators with a few thoughtful modifications can yield surprisingly powerful results. Here’s a simple yet effective way to upgrade the RSI and turn it into a more actionable entry signal.
The Relative Strength Index (RSI) is a widely used oscillator that ranges from 0 to 100, providing a measure of upside momentum within a given timeframe. For example, an RSI reading of 60 implies a 60% upside dominance based on recent price action. Traditionally, traders interpret levels above 70 as overbought and below 30 as oversold. However, RSI on its own isn’t reliable as a standalone entry trigger. An overbought reading doesn’t necessarily mean the market is losing strength—it simply indicates recent data reflects a strong upward move.
Smoothed RSI Approaches
To extract more useful signals, we can enhance the RSI in a couple of simple but effective ways:
1. RSI vs. RSIMA (RSI Moving Average):
One approach is to smooth the RSI itself by calculating a moving average of the RSI (call it RSIMA), and then observe the difference between the RSI and its moving average. A positive difference suggests bullish momentum; a negative one, bearish. This approach reduces some noise but can still result in a choppy indicator, as seen in the subplot of the reference chart.
2. RSI on Smoothed Price (RSI5M):
A more refined method involves smoothing the price before calculating RSI. Specifically, apply a 5-period EMA (Exponential Moving Average) to the price series, then compute the RSI on this smoothed series—let’s call it RSI5M. The key insight is to then analyze the difference between RSI5M and the standard RSI. This difference creates a smoother, more robust signal that better captures market bias.
Why It Works
In uptrends, the EMA(5) smooths out short-term fluctuations and highlights the prevailing trend more clearly than raw price data. As a result, RSI5M tends to rise faster and higher than the standard RSI. The difference between the two becomes positive in uptrends and negative in downtrends, making it a useful gauge of directional momentum. This effect is illustrated in the lower subplot of the reference chart, where the smoothed signal offers a clearer view of market regimes.
Ready-to-Use Script
If you're not into coding, you can explore the public script of the Parsifal.RSI.Trend indicator on TradingView. It implements a slightly refined version of this smoothed RSI differential and provides a clean visual cue for trend bias.

This Guy has arrows down to 4400My last market update ended up receiving a comment from a Trading View user that seemingly was mocking the fact that my shorter-term chart posted in an update to my followers had directional arrows down to the approximate area of ES 4400.
Here's my longer-term expectations. If some didn't like 4400, I suspect they will equally dislike sub-ES 1,000.
Best to all.
Chris

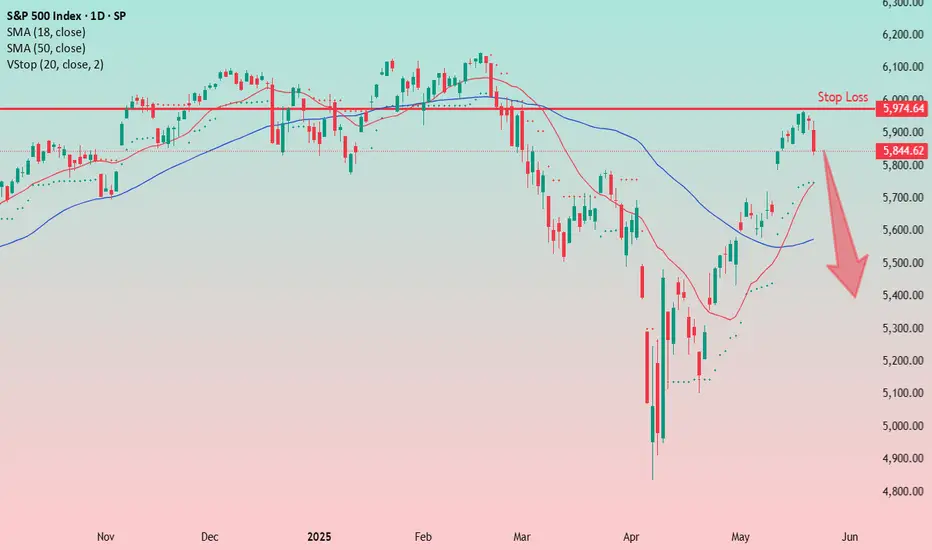
Has the S&P 500 rally ended?The US stock indices saw a noticeable drop in recent trading sessions, as markets wait for President Donald Trump’s new tax plan and its implications for US debt.
The S&P 500 had surged more than 23% since April, but the rally seems to have ended from a technical point of view, reflecting rising concerns about the US economy.
A bearish divergence appeared while prices were making higher highs, the RSI (Relative Strength Index) was making lower highs. This is a negative signal, and it played out clearly, pushing the index down to a new low. This suggests that bearish momentum is still strong.
What’s the possible next move?
Any current rise in the market may just be a temporary correction in a larger downtrend. A key resistance level for the S&P 500 is 5,937.55, which is 78% of the recent move based on Fibonacci retracement. The price could react negatively there, either with a small pullback or by continuing the downward trend toward 5,850.23.
However, if the price rises above 5,971.53 and closes above it on the daily chart, the negative outlook would be invalidated, and it could signal the beginning of a new upward trend.

$SPXSP:SPX staying strong as the One Big Beautiful Bill pushes forward 🇺🇸📊
This bill could be the fuel the market needs:
✅ Economic momentum through tax relief & job creation
🔧 High-tech equipment demand rising
🏗️ U.S. doubling down on skilled labor to rebuild smarter, stronger infrastructure
This isn’t just policy it’s a blueprint for long-term bullish energy in the markets. Eyes on SP:SPX 📈🔥

A short term buy opportunity: US500AUDHello,
We are at a great level for buy opportunities for the S&P500 quoted in AUD from a technical point of view. After the Trump tariff declaration, most countries rushed and sought exemptions. However, China chose to retaliate. The focus shifted towards China and the trade war between the US and China escalated quite fast. President Trump raised tariffs on Chinese goods to 145%. China responded with a 125% tax on US imports, bringing nearly $600 billion in trade to a halt. Trump continues to insist that the issue of trade deficits needs to be solved and he seems quite serious about it. However, we acknowledge that Tariffs will not solve the trade deficits in totality. Tariffs are still seen as a negotiation tactic to call stakeholders to the table for President Trump. The U.S. and China are economically interdependent. The U.S. is China’s largest export market, and China is the U.S.’s largest import market.
On 14th may, China and the Unites States called for a truce on the trade war and agreed to reduce tariffs on one another by 115 per cent for 90 days. The average U.S. tariff rate on Chinese exports will fall from 145 per cent to 30 per cent during that time, and the corresponding Chinese figure will fall from 125 per cent to 10 per cent. Additionally, the United States and the United Kingdom announced a trade deal for both countries. This two significant news excited the market and the S&P which is a market barometer was not left out. The S&P has since recovered and is currently trading at $5,886 (Above the April 2nd levels). While analysts may be concerned whether the underlying structure of the relationship between the United States and other economies remains fragile and subject to re-escalation. The long-term implications of this trade truce are still being assessed, with some anticipating renewed trade flows and market gains, while others caution that the underlying structural issues remain.
We believe the U.S. may shift its focus to accelerating Federal Reserve interest rate cuts in the near term. Just yesterday (13th May 2025), the inflation numbers came in lower than expected, the consumer price index rose by 2.3% in April, down from 2.4% in March – prompting President Trump to renew attack on Federal Reserve Chair Jay Powell, demanding he cut interest rates. We believe that lower rates will add onto an already rising market and now is a perfect time for us to align our portfolio by considering adding more into the S&P 500.
Adding to the above is that we are just closing on the Quarter one 2025 results and, 90% of S&P 500 companies have reported earnings, with 78% surpassing estimates, according to FactSet. This strong performance signals robust market health, particularly at current lows. Although tariffs were introduced post-Q1, the combination of solid earnings, easing inflation, and a potential Federal Reserve rate cut could drive a bullish surge toward all-time highs. We recommend a buy on the US500AUD from the current levels.
Disclosure: I am part of Trade Nation's Influencer program and receive a monthly fee for using their TradingView charts in my analysis.

SPY/QQQ Plan Your Trade For 5-22 : Inside Breakaway CountertrendToday's Inside Breakaway in Countertrend mode suggests the markets may attempt to move downward - away from the recent highs.
I believe the SPY/QQQ will move into a sideways/consolidation range over the next 3-5+ trading days before attempting to make any big moves. We have a holiday-shortened trading week next week, and I believe the markets are moving into the Summer doldrums.
Overall, I would ask traders to stay cautious of this transition in the markets over the next 5--10+ days and prepare for volatility to increase after June 1st.
You all know what I believe is the most likely outcome - a rollover topping pattern followed by a breakdown in price targeting the 525-535 level on the SPY. We'll see what happens going forward.
Gold and Silver pullback back overnight which suggests the metals markets were a bit overheated to the upside. I still believe Metals will continue to push higher.
BTCUSD is trading up above $111k. Here we go.
BTCUSD is moving up into the potential rejection level that I suggested in my 5-20 video as a MASSIVE WARNING setup.
This is where we'll see how BTCUSD plays out - if we continue to push higher or if we REJECT and move into a broad downtrend.
I didn't expect it to happen only TWO DAYS after my video - but here we are.
Time to get muddy and play what price puts in front of us.
Get some.
#trading #research #investing #tradingalgos #tradingsignals #cycles #fibonacci #elliotwave #modelingsystems #stocks #bitcoin #btcusd #cryptos #spy #gold #nq #investing #trading #spytrading #spymarket #tradingmarket #stockmarket #silver

Stocks Have Been in a Bear Market for 25 Years, By This MeasureThe S&P 500 hit a new all-time high in February. However, by one measure it’s been in a bear market all century.
Today’s monthly chart shows SP:SPX as a ratio against gold. Using this comparison, equities have underperformed since Bill Clinton was still President in August 2000.
It illustrates how stocks languished in the 1970s, before starting an 18-year run against the “barbarous relic” (to borrow from John Maynard Keynes). Then the great equity bubble broke and investors began their first migration back into gold. They subsequently diversified into emerging markets, triggering a secular bear market in U.S. stocks that ended with the subprime crisis.
The S&P 500 continued lower against bullion until 2011, when the People's Bank of China turned hawkish. A year or two later, stocks entered a new bull market by breaking above their previous high from 2007.
That uptrend continued until late 2021, when post-pandemic inflation lifted interest rates. Gold interestingly held its ground as the Federal Reserve tightened policy, an early sign of emerging strength.
The next interesting moment was early 2024, when stocks and the yellow metal both broke out to new highs. However, the S&P 500 still made a lower high when expressed as a ratio against gold.
Given worries about the U.S. fiscal deficit, inflation and de-dollarization, some investors may wonder whether the trend that began 25 years ago may remain in effect.
Check out TradingView's The Leap competition sponsored by TradeStation.
TradeStation has, for decades, advanced the trading industry, providing access to stocks, options and futures. If you're born to trade, we could be for you. See our Overview for more.
Past performance, whether actual or indicated by historical tests of strategies, is no guarantee of future performance or success. There is a possibility that you may sustain a loss equal to or greater than your entire investment regardless of which asset class you trade (equities, options or futures); therefore, you should not invest or risk money that you cannot afford to lose. Online trading is not suitable for all investors. View the document titled Characteristics and Risks of Standardized Options at www.TradeStation.com . Before trading any asset class, customers must read the relevant risk disclosure statements on www.TradeStation.com . System access and trade placement and execution may be delayed or fail due to market volatility and volume, quote delays, system and software errors, Internet traffic, outages and other factors.
Securities and futures trading is offered to self-directed customers by TradeStation Securities, Inc., a broker-dealer registered with the Securities and Exchange Commission and a futures commission merchant licensed with the Commodity Futures Trading Commission). TradeStation Securities is a member of the Financial Industry Regulatory Authority, the National Futures Association, and a number of exchanges.
TradeStation Securities, Inc. and TradeStation Technologies, Inc. are each wholly owned subsidiaries of TradeStation Group, Inc., both operating, and providing products and services, under the TradeStation brand and trademark. When applying for, or purchasing, accounts, subscriptions, products and services, it is important that you know which company you will be dealing with. Visit www.TradeStation.com for further important information explaining what this means.

Risk-Off Mode: Indices Under Pressure, VIX Breakout in Play!🌍 Indices Under Pressure as Volatility Spikes – Market Analysis (May 22, 2025) 🚨
My TradingView multi-chart workspace is tracking major global indices alongside the VIX (bottom right). The visual tells the story: broad-based selling is hitting equities, and the VIX is on the rise, signaling a clear risk-off environment.
Key Observations:
Indices in the Red:
All major indices in my workspace are under pressure, with sharp declines across the S&P 500, NASDAQ, Dow, DAX, and others. This aligns with today’s global heatmaps, which are flashing red across sectors and regions. The selling is broad, not just isolated to tech or cyclicals.
VIX Volatility Index Elevated:
The VIX (CBOE Volatility Index) is spiking, up over 15% today and holding above the 20 level (FXEmpire). This “fear gauge” confirms that traders are hedging aggressively and bracing for more turbulence. Historically, a rising VIX alongside falling indices is a classic sign of heightened uncertainty and potential for further downside.
Macro & Geopolitical Backdrop:
The selling pressure is fueled by persistent US-China trade tensions, new tariffs, and a lack of clear central bank support. The White House remains firm on its trade stance, while the Fed is not signaling imminent rate cuts (VT Markets). This policy vacuum is amplifying volatility and risk aversion.
Global Sentiment:
Asian and European markets are also deep in the red, with historic single-day losses in some indices. The “Magnificent Seven” US tech stocks have entered bear market territory, and even traditional safe havens like gold are seeing some liquidation as investors scramble for cash.
What’s Next?
Short-Term Outlook:
With the VIX elevated and indices breaking key support levels, expect continued choppiness and possible further downside. Macro data releases and any shift in trade rhetoric will be key catalysts. Defensive positioning and risk management are crucial in this environment.
Potential for Rebound:
If we see a de-escalation in trade tensions or dovish signals from central banks, a relief rally is possible. But for now, the path of least resistance appears lower, with volatility likely to remain high.
Summary:
The charts don’t lie – indices are under heavy selling pressure, and the VIX is confirming a risk-off mood. Stay nimble, watch for headline risks, and be prepared for more volatility in the days ahead. 📉🟥⚡

Index Reversal in PlayThe index has started a decent move downward. Right now, a solid short entry setup is forming. The price is near strong resistance, reversal patterns are emerging, and the overall market context supports a short position.
The first target is 5675.
In an optimistic scenario, we could reach 5400.
SP500 BEARISH TRADE IDEA Key Observations:
Imbalance Zone Identified (Supply-Demand Gap):
The pink zone is marked as an imbalance — an area where price moved too quickly upward, leaving little trading volume in between.
These imbalances often act like magnets, drawing price back to "fill" them.
Recent Price Action:
Price recently formed a peak and has since started pulling back.
The latest candlesticks show bearish momentum (a series of red Heikin Ashi candles with increasing size).
Projected Price Movement:
A blue arrow projects a further decline into the imbalance zone, suggesting price may retest this level for liquidity or to complete a retracement.
Target Area:
The imbalance zone lies approximately between 5,680 and 5,736, with a midpoint around 5,710.
This is a logical target for a pullback before potentially resuming upward.
📉 Bearish Bias Justification:
Market Structure: A new lower high is forming, possibly signaling a short-term reversal or correction.
Heikin Ashi Candles: Smooth and elongated bearish candles indicate strength in the down move.
Volume Imbalance Theory: Price may need to fill this inefficiency before finding new direction.
✅ Possible Trading Implications:
Short Setup: Traders might look for short positions with targets inside the imbalance zone.
Buy Opportunity: Once the imbalance is filled, if bullish price action confirms, it could become a strong buy zone.
⚠️ What to Watch:
Look for confirmation (e.g., candlestick reversal or support forming) in the imbalance area before assuming reversal.
News/events (such as the economic calendar icons below) might impact price direction sharply.

Puts on SPXWLooks like it will be selling, based off the EMA's.. going to wait until market opens tomorrow to see what happens.

Top 10 Rookie Trading Mistakes (And How to Laugh at Your Own)So you’ve just discovered trading. Maybe it started with a Reddit thread. Maybe someone said “trading Nvidia NASDAQ:NVDA is like printing money.” Or maybe you just liked the name “Shiba Inu” and figured memecoins was a good investment thesis.
Either way, welcome. This is where dreams are made, lost, rebought on leverage, and then tweeted about.
The markets are ruthless, but also educational — if you’re humble enough to learn and bold enough to laugh when you inevitably light your first $100 on fire by accidentally shorting Apple NASDAQ:AAPL during a breakout.
This article is for you. The new trader. The (overconfident?) beginner. Let’s talk about the top 10 rookie trading mistakes — and how to laugh at your own before the market does it for you.
1️⃣ Mistaking Luck for Skill (aka “Call Me Baby Buffett”)
Your first trade is a win. Your second is too. Maybe it’s a meme stock . Maybe it’s a hot IPO. Either way, you’re convinced you’ve cracked the matrix.
You tell your friends: “I just have a feel for this stuff.”
What actually happened: You got lucky in a trending market. And now you're about to go full Titanic on a position you didn’t research, because hey — you're "on a roll."
What you can do insead, and probably have a laugh about it years later, is screenshot your account right now in your very early steps. Frame it. Label it: Exhibit A in Emotional Risk Management.
2️⃣ The Revenge Trade: “I’ll Win It Back”
You took a loss. A big one. Your first real slap from the market. So what do you do? Walk away? Reflect? Journal it?
Nah. You go in twice as hard on the next setup. Same ticker. Same direction. More size.
Spoiler alert: It doesn’t end well.
That type of spiraling behavior usually happens when you think the market owes you something. It doesn’t. Not even an apology.
Imagine explaining your decision to a judge. “Your Honor, I lost money shorting Tesla, so naturally I doubled down five minutes later.” Case dismissed — and that’s why revenge trading is so dangerous .
3️⃣ FOMO FOMO FOMO
A green candle pops up on your watchlist. It’s moving. Fast. You missed the breakout but you still click “buy” because you’re not missing this train.
You get in. It tops. You hold. It drops. You panic. It rebounds… just after you sell.
Classic rookie cycle.
Why does this happen? The fear of missing out turns off your brain faster than a margin call. Call it what it is — chasing. Say it out loud like it’s therapy: “Hi, this is Patrick and I like to buy things 10% too late.” Maybe it helps.
4️⃣ “I’m Married to This Trade”
It started with a spark. The chart looked good. The RSI whispered sweet nothings. You thought, “This could be the one.”
So you bought. Then bought again. And when it dipped harder than your last relationship, you said, “It’s okay, we’re just going through a rough patch.”
Before you knew it, you weren’t trading — you were in a toxic relationship with a ticker.
You’ve abandoned your edge for emotion. Confirmation bias kicks in, and instead of managing risk, you’re managing denial. You stop analyzing the chart and start defending it like it’s your firstborn.
If you’re talking about a stock (or anything else on a chart) the way your friend talks about their ex — “It just needs time, I know it’ll come back” — you’re not trading. You’re coping.
5️⃣ All In, All the Time
Risk management? Never heard of that. You found a setup that “can’t fail,” so you went 100% in. On margin. On a Friday.
What could go wrong?
Answer: Everything. Especially when your trade gaps against you on Monday morning after Trump has said tariffs are changing once again.
That’s when you know you’re mistaking conviction for strategy. They’re not the same.
6️⃣ Ignoring the Bigger Picture
You nailed the 15-minute chart. Gorgeous breakout. But somehow, you forgot to check the daily — where your “breakout” is just a lower high in a brutal downtrend.
Oops.
Think about whether you've got tunnel vision. You went along with your short-term bias instead of checking the bigger picture when things are different.
What you can do instead, is make a rule: before every trade, zoom out. Literally. Leave no timeframe unexamined (at least up to the daily frame).
7️⃣ Trading Every Day Like It’s the Super Bowl
New traders think they have to trade every day. Every single session. Every little move.
And when there’s no good setup? They make one up, trying to whip up trendlines to justify their trading.
What happens next: Boredom trades. Overtrading.
Why it happens: You're addicted to the action, not the outcome.
What can you do instead? Write down the number of trades you made last week. Multiply it by the average commission you paid. Now imagine what you could’ve bought instead. And, what could be even better, consider taking a lesson in patience .
8️⃣ Blind Faith in Indicators
The RSI is at 18. The MACD just crossed. Stochastic says “maybe.”
So you buy. No price action. No trend. Just… vibes and indicators.
Result: You become a victim of the “indicator trap” — relying so heavily on these lines you forget to read the actual chart — momentum, market sentiment, broader technicals, and fundamentals.
What’s a better approach is to treat your indicators like seasoning, not the main dish. The best trades come from confluence, not wishful thinking dressed up as technical analysis.
9️⃣ The Trading Journal You Never Wrote
If you can’t remember why you entered a trade, you’re not at your best. Here’s a pro tip:
Keep a trading journal . One that records your thesis, entry, stop, target, and outcome. You know — the boring stuff that makes you better.
Why is that important? Journaling builds discipline. Patterns. Self-awareness. It’s never too late to start your journal!
🔟 Expecting to Get Rich Quick
This is the big one. The rookie mindset that kills most portfolios: I’m gonna turn $500 into $5,000 in a month.
You won’t. Sorry.
And even if you do, you won’t keep it.
Trading rewards patience, process, and preservation. Not YOLO bets and delusions of grandeur.
Try looking at your P&L like a diet. If you expect six-pack abs in a week, you’ll burn out and crash your progress. If you focus on habits? You’ll outlive the hype.
📚 Conclusion: Every Trader Starts Stupid
Let’s be clear — all of us have made these mistakes, even the big shots out there that run billion-dollar funds. The only difference between a rookie and a pro is how fast you learn from them. Or better yet — how fast you can laugh at them, document them, and evolve.
Because the truth is, the market is the most expensive comedy club on Earth. And every trade is a new punchline.
So if you're new, mess up. Take notes. Stay humble. And above all — enjoy the chaos. One day you’ll look back at your Doge CRYPTOCAP:DOGE top-buy with fondness.
After all, it’s only a mistake if you didn’t learn. Otherwise, it’s just tuition paid for by your trading account.
What’s a mistake we didn’t mention? Share your tips, tricks, mistakes, and lessons in the comment section!

Bullish continuation?S&P500 (US500) is falling towards the pivot which is a pullback support and could bounce to the 1st resistance which aligns with the 138.2% Fibonacci extension.
Pivot: 5,782.52
1st Support: 5,692.37
1st Resistance: 6,138.06
Risk Warning:
Trading Forex and CFDs carries a high level of risk to your capital and you should only trade with money you can afford to lose. Trading Forex and CFDs may not be suitable for all investors, so please ensure that you fully understand the risks involved and seek independent advice if necessary.
Disclaimer:
The above opinions given constitute general market commentary, and do not constitute the opinion or advice of IC Markets or any form of personal or investment advice.
Any opinions, news, research, analyses, prices, other information, or links to third-party sites contained on this website are provided on an "as-is" basis, are intended only to be informative, is not an advice nor a recommendation, nor research, or a record of our trading prices, or an offer of, or solicitation for a transaction in any financial instrument and thus should not be treated as such. The information provided does not involve any specific investment objectives, financial situation and needs of any specific person who may receive it. Please be aware, that past performance is not a reliable indicator of future performance and/or results. Past Performance or Forward-looking scenarios based upon the reasonable beliefs of the third-party provider are not a guarantee of future performance. Actual results may differ materially from those anticipated in forward-looking or past performance statements. IC Markets makes no representation or warranty and assumes no liability as to the accuracy or completeness of the information provided, nor any loss arising from any investment based on a recommendation, forecast or any information supplied by any third-party.

SPX The market selloff today was driven by a sharp rise in Treasury yields following weak demand at a 20-year bond auction, signaling investor concerns about U.S. debt and fiscal policy. Moody's recent downgrade of the U.S. credit rating, fears over unsustainable government spending.
If we don't hold around 5866, there's a risk of deeper selling pressure pushing us toward 5774

Super-cycle top in? I was considering that we had an extended wave 1 from march 2009 to feb 2020, the wave 2 bottom was march 2020, then wave 3 top was jan 2022, wave 4 bottom was oct 2022 and now we are on wave 5. This would be an extended wave 1 instead of wave 3 and that means wave 3 & 5 should be equal and with the current top that would put them within 1.1% of each other. This also fits with the alternating pattern with wave 2 being quick and simple and wave 4 being long and complex. Thoughts?

S&P500: Vanna Snapback is Over – Short Gamma Drift Underway Belo📝 Summary
Short gamma regime re-entered after 20Y auction shock. Below 5870, dealers face structural sell pressure from vanna + gamma + charm convergence. Wait for VIX to fall before buying any dip.
📊 Price Levels to Watch
🔺 Upside Breakout Trigger: 5885
→ Reclaiming this level flips dealers back toward neutral gamma, opening short-covering squeeze potential toward 5925–5950
🔻 Downside Acceleration Zone: 5870
→ Structural pressure zone. Vanna-driven delta hedging intensifies. Below here, the market enters a volatility expansion regime
🧱 Gamma Walls:
Call Wall: 5950
Put Walls: 5875 / 5850 / 5800
🔍 Structural Regime Analysis
Macro trigger:
Last night’s 20Y Treasury auction was weak, triggering a sharp risk-off move.
SPX broke 5935 → 5875 in 15 mins, entering short gamma zone (GEX 🔴🔴).
Volatility Regime Shift:
VIX spiked >20, breaking the downward vol trend that supported recent vanna snapback rallies.
This marks the end of volatility compression. Vol expansion regime is in effect.
Dealer Hedging Mechanics:
Below 5870, Vanna pressure increases sharply as price declines + IV rises.
Dealers short puts must delta hedge by selling ES, amplifying downside in a feedback loop.
No Dip Buy Until Vol Stabilizes:
VIX must fall or implied volatility flatten before any long bias resumes.
Until then, treat rebounds as short entries, not long setups.
⚠️ Volatility Metrics Supporting This View
GEX: 🔴🔴 (Negative Gamma on both 0DTE and aggregate expiries)
IVx 5D Change: +4.04% → Implied volatility rising into the drop
PUT$: 85.6% → Option flow heavily defensive (puts > calls)
Skew: High, supporting demand for tail risk hedging
🧭 Tactical Strategy
Short bias below 5870, scale-in entries on failed intraday bounce attempts
First targets: 5850 → 5800 (Put gamma cluster + dealer momentum zone)
Invalidate short above 5885 (where short gamma neutralizes)
📌 Final Note
We are now inside a third-order Greeks-driven sell zone:
Speed ↑, Color ↑, Ultima ↑ → this is a self-reinforcing volatility trap.
No long setups are valid until structural vol metrics cool down.

Wick Tricks at Highs Based on conventional wisdom the SPX monthly chart looks super bullish with the big wick.
I want to explain how this can be misleading. For some "Creds" on the idea, I've attached a post made at almost exactly the low where I forecast the wick and spikes while stating this could be inside of a bearish setup. In the bearish setup, we'd often get bad news around this price.
These candles can be bullish, of course - I don't think I need to insult your intelligence by explaining the bullish read on these candles. You know them.
But did you know you also see one of these in almost every major top in history?
I just posted almost every notable drop from 2008 to 1966.
Here's a recent one.
I could go and start posting examples from the 1910s, but I hope I've made my point.
If it's a wick trap at a top, we generally will see a capitulation month within 3 months.
Usually, it'd be next month with this month closing weak to make a wick on top.

Plan for Full Support Failure We did really well today with lotto puts, hitting over 2,000% on the OTMs taking near the high of the day betting on new lows - but I want to start this post by stating nothing significant happened for bears today. I've been explaining recently how this sort of reaction to the level we were at would be most common.
There are times when the low is made now. As I write this, we trade on support. In a 2021-esk move, we'd be at the low.
In the statistically most common SPX move, we'd be in the first break the 5500.
In the doom move, we'd be entering into a consistent downtrend that would have shallow bounces, a bigger trappier bounce around 5700 and then enter into a period of serious outright capitulation. The type of action almost never seen in indices. I believe contingent on the preceding action hitting this would be a highly probable event on the break.
If we're in a big bear move then it HAS TO BE the case that the first drop was a leg one of Elliot downtrend or a leg A of a correction.
This leg would have to be either the C leg or the 3 leg. Both of those would be capitulation events - and be headline making crashes. Like mainstream news sort of deals.
These moves would be characterised by consistent and strong selling. Only shallow bounces.
If these things are not happening, then it's not a good idea to be a bear.
If these things are happening, trying to buy the dip might get you nailed.
I'll tell you here and now, if the bear break thesis is correct - lots of people will end up margin called.
They will buy the dip and then think they can average out of it buying more and there will not be deep enough rallies to accommodate this.
They'll progressively pick up bigger and bigger positions. Hope and feel it's all over on the first major bounce and then the worst part of the trend will come.
If the sell off is strong, people should respect the risk of it.
To end on an optimistic note - if we make a low somewhere in the area we traded today that is almost always bullish. I'd certainly be bull bias to a new high and if we break the classic spike out risk I'd be ultra bullish.
I strongly believe the trend for the following couple years will be set in this area. I think that's been foreseeable for years. If the downside risk can be overcome - I think the easy bull markets that followed would surpass the ones we've seen.
Or this could become the worse sell off you've seen in SPX.
It's not a time to be overly cocky. Protect risk and be ready to benefit from any outcome.
Big money is likely to be available within the next 9 months. Next 3 if it's a bear thing.
