Please criticise on this strategy using SPXI have not backtested this strategy and to use the "REPLAY" button would costs me some money so you can say, it is biased since the candles were already formed ahead.
Strategy -
Time frame - 1H
Risk/Reward - Keep to 1:2 strictly
Example : Trade Setup 1
11 Apr 25 candles closed above 10 Apr 25 - LONG
SL at closing of 10 Apr
Profit target - 1 : 2
You can see that you are stopped out AFTER you set up Trade set up 2 (21 Apr red candle), ie 10 days later , you are in a LOSS position.
Trade setup 2 -
Long on 17 Apr
got stopped out on 21 Apr when it gapped down. See the power of having a SL else your losses will magnified overnight!!!!
So in this chart, there were 5 trades, 3 in profits and 2 in losses. Overall, you gained because your rewards are 2x so in this case you won 3 multiply by 2x = 6x but your losses are 1x or 3 multiply by 1x= 3x so nett off you gained 3x
I would avoid using leverage to trade and keep to the strict rules of 1- 2 trades per week and strictly 1:2 risk/reward ratio. Of course , if you manually watch the chart live (meaning you need to stay awake to glue on the computer)
you might gained more than 1:2 risk/reward but that is not the essence of this strategy.
Keeping the frequency low tame your emotions (greed) of increasing your position size and risk/reward. What you want is CONSISTENCY not huge spike up and down. Don't think you can make 5x in a day and go on holidays for the next few days. You gotta put in the work (sufficient charting skills allow you to be more nimble and confident but not to inflate your ego by excessive trading).
I suggest paper trade for a good 1-2 months and see the results yourself BEFORE you say it work or doesn't. Paper trade is good especially for beginners but once you surpassed this stage, I think using your own money to trade is the real game. Staring at 10% loss is very real and some can take it well while others can't handle it and will manually adjust the SL or PT to modify the strategy. Keep it simple until you gained consistent profits.
As usual, please DYODD
SP500FT trade ideas

SPX bullishI am now bullish in near term. For those following me, I have updated HILO EMA squeeze band with an option to plot more lines as seen this chart. I see a swing high of 5770, although a bit cautious about the month end. Market is tired of Trump tantrums and more focused on earnings which have been great so far. For near term month or two I would be looking for bye the dip

Into the Close, some thoughts about the price actionA difficult and choppy day again. We did rally from the low to 5525 as I thought, but it's possible this was a squeeze to take shorts out before the bigger move down into the rest of the week. it's difficult to say with big earnings about to hit. The daily candle is forming a hanging man, and it could be a clue. We'll see how it looks tomorrow.

SPX as an exampleCorrect me if I'm wrong, but this has got to be one of the craziest monthly candlesticks the stock markets have ever printed, and perfectly completes a potential wave 4 in a 5 wave count.

S&P500 is set to rebound to new highsDual EBP on the weekly and daily indicative of bullish price action and time frame allignment. S&P500 is set for new highs.

Another reversal 5600 now likelyWe came down to the top of the previous range and with the RSI as low as it got, the chances for reversal was high. I took profits and reversed long. I am now expecting 5600 and the 50 ma to finally get reached.

The SPX Sell Off at 5500Hi all,
It has been a while since we posted as we waited for a really good trade setup. The SPX is hovering at 5500 and we believe it is the right level to sell.
1) There is a shark pattern at this level
2) RSI is overbought on every time frame except H4 and D1
3) There are smaller patterns to sell
4) There is very strong structural resistance at 5510 to 5520
The first target will be 5306 which has a great risk to reward of 1:5.
We will wait for M15 divergence and a trend line break to enter.

What goes up must come downSPY is massively overbought since Jan 24. My new indicator WaveTrend Multi Time Frame Table illustrates this.
Trumps actions start initiated what had to happen anyway. Currently the SPY is correcting from the previous 3 weeks of bull run.
After that the 1D, 1W and hourly charts should be green again (oversold zone) and we could see another bullish sentiment.
Just my 2 cents. Do your own research.

Morning update 4-30The market looks bearish this morning, but pattern wise nothing has changed just yet. If we are truly bearish, 5550 will not be surpassed and the overall pattern will have changed.

SPY/SPX500: Bearish Setup Ahead of Key Macro Events🔍 15-Min Chart Analysis – April 30, 2025
The S&P 500 (SPX500) is currently facing resistance near the 5,560.65 zone, a confluence of a key Fibonacci level (0.382 retracement) and a rising wedge upper boundary. Price has shown signs of rejection after a recovery from the ORB low of 5,505.88, and is struggling to break above 5,557–5,560, which aligns with a prior supply zone.
🔧 Technical Breakdown:
Bearish Rising Wedge Formation: Price is respecting the wedge trendlines, suggesting a potential breakdown.
Fibonacci Confluence Zones:
Resistance: 0.382 at 5,557.18
Support: 1.382 extension aligns with 5,508.75, which is just above the ORB low and a possible target.
Short Bias Trigger: A clean break below the wedge support (~5,545) could accelerate downside.
Target Zones:
🎯 First target: 5,524.39 (ORB low)
🎯 Second target: 5,508–5,505 area (Fibo 1.382 + ORB range support)
🔮 Probability Outlook:
Bearish bias: 65%
Bullish breakout: 25%
Sideways consolidation: 10%
🧠 Macro Context:
With U.S. GDP and FOMC decisions imminent, volatility is expected to spike. A break below wedge support could trigger a retracement toward key support zones. Be cautious of false breakouts as macro catalysts come into play.
📌 Watch the 5,545 level closely. Rejection + volume drop = high-probability short setup.

S&P500 INTRADAY resistance at 5510A wave of earnings reports is due today, with Microsoft and Meta in focus. The tech sector remains under pressure, highlighted by a 15% drop in Super Micro Computer after disappointing results.
In Europe, banks are seeing strong revenue growth, benefiting from recent market volatility linked to Trump’s trade policies. However, Mercedes and Stellantis have joined the list of companies withdrawing guidance due to uncertainty.
Donald Trump has again criticized Fed Chair Jerome Powell and defended his tariff strategy during an event marking his 100th day in office. Investors are now awaiting key US data, including inflation and GDP figures.
Meanwhile, China’s factory activity has contracted to its lowest level since December 2023, signaling the early impact of US tariffs and increasing pressure for government stimulus.
US consumer companies are also sounding cautious, pointing to a weaker economic outlook ahead.
Key Support and Resistance Levels
Resistance Level 1: 5670
Resistance Level 2: 5740
Resistance Level 3: 5820
Support Level 1: 5380
Support Level 2: 5310
Support Level 3: 5236
This communication is for informational purposes only and should not be viewed as any form of recommendation as to a particular course of action or as investment advice. It is not intended as an offer or solicitation for the purchase or sale of any financial instrument or as an official confirmation of any transaction. Opinions, estimates and assumptions expressed herein are made as of the date of this communication and are subject to change without notice. This communication has been prepared based upon information, including market prices, data and other information, believed to be reliable; however, Trade Nation does not warrant its completeness or accuracy. All market prices and market data contained in or attached to this communication are indicative and subject to change without notice.

Will April Close with a Bang?You ever get that feeling the market’s just waiting for a reason to move?
That’s where we are.
It’s been a quiet start to the week – barely a pulse.
And Tuesday? One signal. Just one.
But it was a bullish pulse bar, and it paid.
Price is still coiling, compressing tighter, and Bollinger Bands are pinching harder than a crab on Red Bull.
We’re seeing the classic signs of range contraction – which usually means a range expansion is coming.
So what’s the move?
Stay bullish.
Stay patient.
And be ready to pounce the moment price breaks free.
Today’s calendar gives us a few nudges – ADP, GDP, ECI, PCE – nothing major, but enough to cause a wobble or spark.
The bias is bullish.
The system’s ready.
And if we break out of this pinch, I’m looking at 6106 on the swing.
Even a dip to 5400 wouldn’t change the structure – just another spot to reload the bulls.
Let’s finish April strong.
Let’s grab another one by the horns.
---
SPX Market View
Let’s call it like it is – the market’s been locked in a deep freeze.
Monday and Tuesday barely moved.
Why?
No real news. Month-end positioning. And a crowd of big players too busy doing their internal accounting gymnastics to push buttons.
But while it looked like nothing happened, Tuesday’s single bullish pulse bar delivered the goods.
One bar. One setup. One result: Profit.
Now as we roll into Wednesday, things get spicy – not because the economic data is explosive… but because compression like this doesn’t last.
The Bollinger Band width is pinched tighter than a tax refund cheque.
And we know what that means:
Tight range = pressure building.
Breakout = opportunity waiting.
So today’s plan?
Stay bullish until proven otherwise.
Use the pulse bar system to play range edges or trigger entries.
Look for breakout confirmation to ride it toward 6106.
Remain calm if we dip toward 5400 – structure still holds.
Economic data today (ADP Jobs, GDP, Employment Costs, and Core PCE) might trigger volatility, but it’s not about reacting to the numbers…
It’s about watching how price responds.
We’re not forecasting.
We’re not feeling.
We’re waiting for the setup – then pulling the trigger.
Price is whispering right now.
Soon, it’ll yell.
Be ready.
---
Expert Insights:
Mistake #1: Assuming news equals movement.
Just because data drops doesn’t mean price pops.
Fix: Always wait for price confirmation. Pulse bars > economic guesses.
Mistake #2: Ditching the bias at the first wobble.
A dip isn’t a collapse.
Fix: Know your structure. Dips to 5400 are still within a bullish regime.
Mistake #3: Forgetting the role of compression.
Tight ranges often precede big shifts.
Fix: Don’t ignore the squeeze. Bollinger Band pinch = breakout fuel.
---
Rumour Has It…
In a desperate bid to solve market stagnation, Wall Street has reportedly hired a motivational speaker named Terry the Turnaround Candle.
His credentials?
He once convinced a doji to become a dragonfly.
Sources say he opens every session with, “Are you going to let that Bollinger Band define you?!”
Meanwhile, the Fed is beta-testing new AI price models based on squirrel hoarding patterns in Central Park.
Traders remain cautiously optimistic.
Squirrels remain heavily long acorns.
This section is entirely made-up satire. Probably.
---
Fun Fact
Did You Know?
The term “month-end rebalancing” sounds official… but it’s really just fund managers shuffling things around so their spreadsheets look prettier.
They often trim winners, pad laggards, and balance sector weights.
But in low-volume markets like this week, even tiny shifts can cause weird little waves that trigger setups.
So when price “randomly” spikes or dips late in the session on month’s end?
It’s often not news – it’s bookkeeping chaos in disguise.
Which is why we trust setups, not headlines.

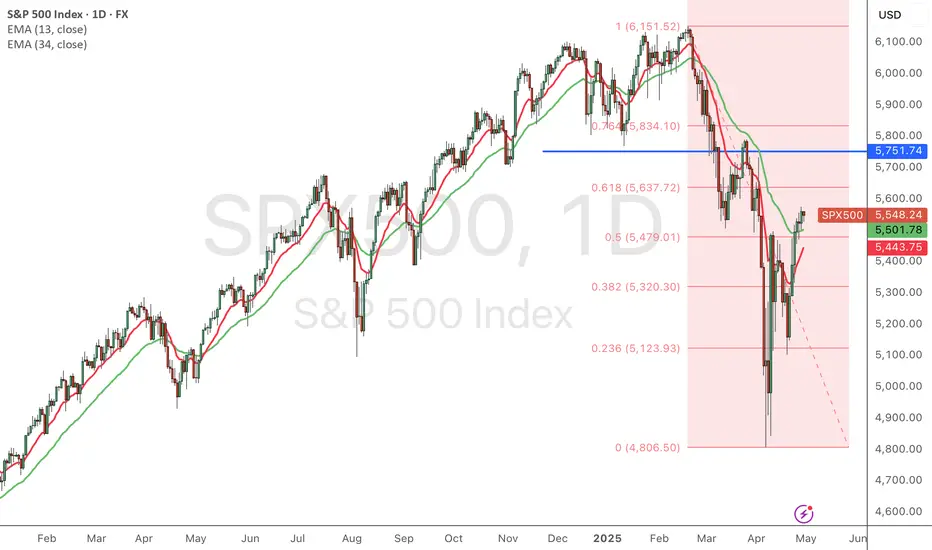
SPX500 rebound will finish in the range of 5650 to 5750.Trump’s tweet on April 9 regarding the moderation of tariff measures triggered a strong market rebound. Retail investors are buying the dip, contributing to this recovery, while institutional investors are actually net sellers. In April, capital flowed out of U.S. equities and mid- to long-term U.S. Treasury bonds.
We anticipate that both the Nasdaq and S&P 500 will rebound to the Fibonacci 0.618 level or slightly above, recovering about 62% of the entire decline since December 2024. We believe this rebound will be temporary, followed by another decline. Currently, both indices are approaching the Fibonacci 0.618 level.
While many people focus on tariffs and the trade war, the Trump administration is also facing an imminent national debt crisis. The total national debt stands at $36 trillion, with interest payments this year expected to be around $1 trillion—about one-fifth of the federal government's tax revenue. Additionally, $8 trillion will reach maturity this year, and $6 trillion will need to be rolled over in June. This is a significant amount, yet demand for mid- to long-term U.S. Treasury bonds remains weak. The Federal Funds Rate (short-term rate) is currently between 4.25% and 4.5%, while the yield on 10-year U.S. Treasuries is around 4.3%, both of which are high.
Trump wants to see these rates much lower, but Powell must first assess the inflationary impact of the tariff measures before considering any rate cuts. If inflation resurges beyond expectations, the Fed may be reluctant to cut rates. Consequently, the U.S. stock market could experience a sharp and rapid decline amid these uncertainties. A recession is likely arriving.
Buy Fear, Not Euphoria: The Trader's EdgeWhen you look back at the greatest trading opportunities in history, they all seem to share a common element: fear. Yet, when you're in the moment, it feels almost impossible to pull the trigger. Why? Because fear paralyzes, while euphoria seduces. If you want to truly evolve as a trader, you need to master this fundamental shift: buy fear, not euphoria.
Let's break it down together.
________________________________________
What Fear and Euphoria Really Mean in Markets
In simple terms, fear shows up when prices are falling sharply, when bad news dominates the headlines, and when people around you are saying "it's all over."
Euphoria, on the other hand, is everywhere when prices are skyrocketing, when everyone on social media is celebrating, and when it feels like "this can only go higher."
In those moments:
• Fear tells you to run away.
• Euphoria tells you to throw caution to the wind.
Both emotions are signals. But they are inverted signals. When fear is extreme, value appears. When euphoria is extreme, danger hides.
________________________________________
Why Buying Fear Works
Markets are pricing machines. They constantly adjust prices based on emotions, news, and expectations. When fear hits, selling pressure often goes beyond what is rational. People dump assets for emotional reasons, not fundamental ones.
Here’s why buying fear works:
• Overreaction: Bad news usually causes exaggerated moves.
• Liquidity Vacuums: Everyone sells, no one buys, creating sharp discounts.
• Reversion to Mean: Extreme moves tend to revert once emotions stabilize.
Buying into fear is not about being reckless. It’s about recognizing that the best deals are available when others are too scared to see them.
________________________________________
Why Chasing Euphoria Fails
At the peak of euphoria, risks are often invisible to the crowd. Valuations are stretched. Expectations are unrealistic. Everyone "knows" it's going higher — which ironically means there's no one left to buy.
Chasing euphoria often leads to:
• Buying high, selling low.
• Getting trapped at tops.
• Emotional regret and revenge trading.
You’re not just buying an asset — you're buying into a mass illusion.
________________________________________
How to Train Yourself to Buy Fear
It's not enough to "know" this. In the heat of the moment, you will still feel the fear. Here's how you build the right habit:
1. Pre-plan your entries: Before panic strikes, have a plan. Know where you want to buy.
2. Focus on strong assets: Not everything that falls is worth buying. Choose assets with strong fundamentals or clear technical setups.
3. Scale in: Don’t try to catch the bottom perfectly. Build positions gradually as fear peaks.
4. Use alerts, not emotions: Set price alerts. When they trigger, act mechanically.
5. Remember past patterns: Study previous fear-driven crashes. See how they recovered over time.
Trading is a game of memory. The more you internalize past patterns, the easier it is to act when everyone else panics.
________________________________________
A Recent Example: April 2025 Tariff Panic
Very recently, at the start of April, Trump’s new tariff announcements sent shockwaves through the market. Panic took over. Headlines screamed. Social media was flooded with fear.
But if you looked beyond the noise, charts like SP500 and US30 told a different story: the drops took price right into strong support zones.
At the time, I even posted this : support zones were being tested under emotional pressure.
If you had price alerts set and reacted mechanically, not emotionally , you could have bought into that fear — and potentially benefited from the rebound that followed just days later.
This is the essence of buying fear.
________________________________________
Final Thoughts
In trading, you are paid for doing the hard things. Buying when it feels terrible. Selling when it feels amazing.
Remember:
Fear offers you discounts. Euphoria offers you traps.
The next time the market feels like it's crashing, ask yourself:
• Is this fear real, or exaggerated?
• Is this an opportunity hiding under an emotional fog?
If you can answer that with clarity, you're already ahead of 90% of traders.
Stay rational. Stay prepared. And above all: buy fear, not euphoria.
Disclosure: I am part of Trade Nation's Influencer program and receive a monthly fee for using their TradingView charts in my analyses and educational articles.
US500 TRADE IDEAhi again
The US500 has shown strength by breaking the resistance at 5483.5 and is now at 5535. If the price reaches 5604.6 and a pullback occurs, targeting a temporary decline at the 50% Fibonacci retracement level is a good strategy.
Fibonacci retracement is often used to identify potential support and resistance levels where the price might pause or reverse. The 50% level is one of the commonly watched levels by traders as it often indicates a significant turning point in price movement.
good luck all
**My trading strategy is not intended to be a signal. It's a process of learning about market structure and sharpening my trading my skills also for my trade journal**
Thanks a lot for your support

SPX: Good push at EOD 4/30, but…Possible H&S? Hear me outGood push at end of day on 4/30 at close.
Zooming out, it’s starting look like it’s forming a H&S. I’m starting to see a lot of people flipping bearish as well. But, also near close today, volume was not promising, declining at the close.
I swung short-term puts on SPY, I like SPX puts for a day trade due to this formation but this H&S can possibly out within the end of week with more data and uncertainty or the following week.
I’m short at the touch of the light red line: 5655.79 to the downside.
Gaps below 5354.76, 5206.44
Would say by EOW to next week, if we pull back, may form/complete the right shoulder.
Do your DD!
Let me know your thoughts! #NFA

SPX is entering into a new phase of complex corrective waveThe SPX downside is likely to be over after the index was seen invalidating the wave-4 rule of the 5-wave impulse Elliott wave structure. Furthermore, theres a bear trap as price never closes below 6% from 5,120 major support and strong bullish pressure was seen thereafter, and returning back above the uptrend with strong bullish pressure was seen as a strong upside.
Stochastic Oscillator has confirmed the oversold signal.
Target is likely to see 5,792 as the next immediate target. But we do not foresee a new high yet. We think that the correction is likely to unfold in a three wave manner.

S&P 500 index Wave Analysis – 29 April 2025
- S&P 500 index broke key resistance level 5500.00
- Likely to rise to resistance level 5700.00
S&P 500 index recently broke the key resistance level 5500.00 (former support from March, which also stopped A-wave of the active ABC correction B from the start of April).
The breakout of the resistance level 5500.00 coincided with the breakout of the 50% Fibonacci correction of the downward impulse from February.
S&P 500 index can be expected to rise toward the next resistance level 5700.00, target price for the completion of the active impulse wave C.

SPX - LONGprice is moving well with trade talks easing and agreements potentially coming into place. I believe price will continue this bullish momentum

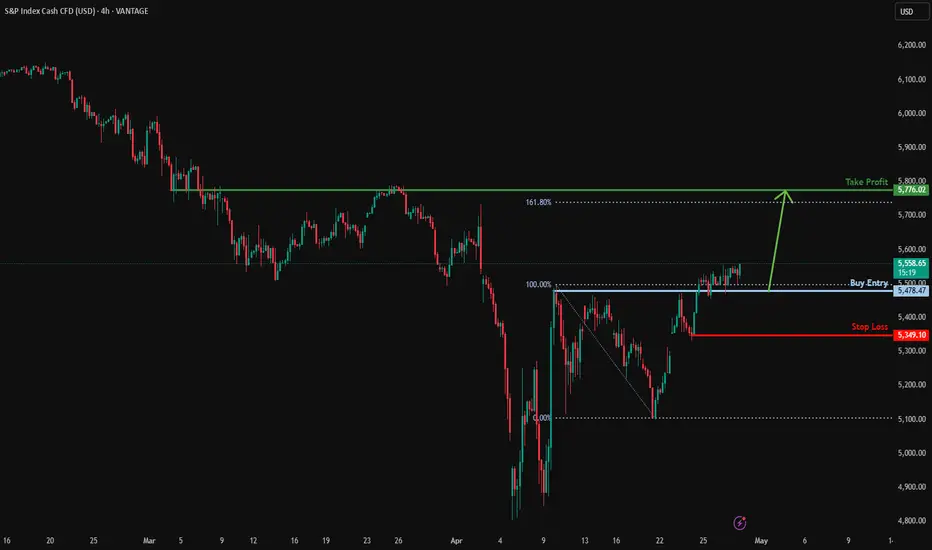
Bullish rise off pullback support?S&P500 has reacted off the support level which is a pullback support and could potentially rise from this level to our take profit.
Entry: 5,478.47
Why we like it:
There is a pullback support level.
Stop loss: 5,349.10
Why we like it:
There is a pullback support level;
Take profit: 5,776.02
Why we like it:
There is a pullback resistance level that is slightly above the 161.8% Fibonacci extension.
Enjoying your TradingView experience? Review us!
Please be advised that the information presented on TradingView is provided to Vantage (‘Vantage Global Limited’, ‘we’) by a third-party provider (‘Everest Fortune Group’). Please be reminded that you are solely responsible for the trading decisions on your account. There is a very high degree of risk involved in trading. Any information and/or content is intended entirely for research, educational and informational purposes only and does not constitute investment or consultation advice or investment strategy. The information is not tailored to the investment needs of any specific person and therefore does not involve a consideration of any of the investment objectives, financial situation or needs of any viewer that may receive it. Kindly also note that past performance is not a reliable indicator of future results. Actual results may differ materially from those anticipated in forward-looking or past performance statements. We assume no liability as to the accuracy or completeness of any of the information and/or content provided herein and the Company cannot be held responsible for any omission, mistake nor for any loss or damage including without limitation to any loss of profit which may arise from reliance on any information supplied by Everest Fortune Group.
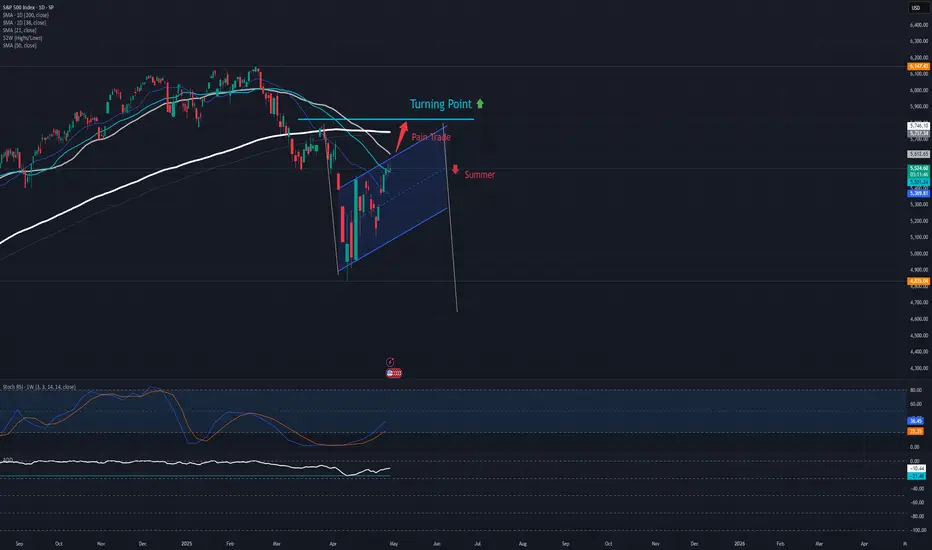
S&P 500 unlikely to return to up trendThe implemented tariff policy of the Trump Administration is expected to hit its fallout on the market by Q3 2025, consequentially the earnings of companies. If the SPX is to have a chance to return to the uptrend this year, it has to confirm two days closings above the turning point before summer.
The inverse effect of tariffs is that it soars with the price: any attempt to adapt on the net price point levers the total price; it's not a fixed number. This leverage applies also to inflation, resulting in consumer sentiment to sour. There is a natural time gap between the implementation of tariffs and the return of industry expected by the Trump Administration - the tariffs have been falling like a chainsaw on international business and supply relations, but rebuilding factories requires time and investment. In this gap the required investments will add pressure to companies' earnings...
These news and outlook brings out funds managers to sell America 'bigly' and to re-evaluate their diversification, bringing down stock prices eventually. The tariff-rebuild-gap is expected to set in by summer, but it is unclear when it would end: so far it is uncertain how much of the industry would return to America to produce and circumvent tariffs. A few big companies announced to build manufactories in the USA, but mostly they plan for only one factory and it still requires building. The Midterm Elections could set the Republican super-majority in both houses to fall and, by extension, have Congress retake the right to set and lift tariffs from the White House. However, it is unclear whether they would use their retaken privilege, as one truth about tariffs, like about all taxes: they're easily introduced, but can take generations to go away again.
All this forms a painstaking 2H scenario for 2025, its rock-bottom too early to call.
MACD says a little higher for a little longerAs per the individual stocks I cover that have not yet reached their ideal retracement areas I am looking for the SPX to get higher into my target box. In any event it's reasonable for me to say we're in a B wave and therefore our pattern can develop into something more complex. Nonetheless, I am mainly looking for MACD to reach the zero line at the very minimum.
The take-a-way from this update is I am looking slightly higher in the markets for slightly longer...before our minor C wave takes hold of the market.
Best to all.
Chris

Grab Some Points To Upside In SPX/USD $$$Hey fellow traders and followers!
How go's the profits so far? Market movin & groovin to the beat of the Orange drum.
I'm here to help if you are having any troubles or confusion with SPX. Let's have a quick look.
We have a V pattern in the 1hr chart so let's trade this baby!
Breakline is 5530.3 so we wait to see a break above before getting long. Pattern support is around 5510, a break below that price area would likely cancel out the bullishness of this pattern so keep eyes on that. Daily low support sits around 5484.9. A break below that support spells a short down for 29 points. A break above the breakline is a long good for around 29 points. RSI is 55.77 (Bulla). Easy money if the V gets flyin $$$.
Don't listen to any news or rumors, listen to your charts. Wait! Did you hear that? Your 1hr chart is whispering something about easy money if you pay close attention to the numbers and the rules laid out within.
Hey! best of luck in all your trades people ! Wishing all of you prosperous trades. $$$
