S&P 500 Analysis Ahead of the Busiest Week of Earnings SeasonS&P 500 Chart Analysis Ahead of the Busiest Week of Earnings Season
Despite the fact that President Trump’s earlier decision to impose tariffs (at higher rates than expected) shook the stock markets, the S&P 500 index (US SPX 500 mini on FXOpen) could still end April without significant losses (currently trading less than 2% below the month’s opening level) or even achieve a positive result.
According to media reports, around 180 S&P 500 companies are expected to release their quarterly earnings this week, including Apple (AAPL), Amazon (AMZN), Coca-Cola (KO), Eli Lilly (LLY), Meta (META), Microsoft (MSFT), and Chevron (CVX).
The share prices of these major companies — some of the largest by market capitalisation — could have a substantial impact on the S&P 500 index chart (US SPX 500 mini on FXOpen), given that their combined weight accounts for approximately a quarter of the index calculation.
Technical Analysis of the S&P 500 Chart
Based on the key price actions marked on the chart, we can identify a descending trend channel for the US stock market, which has been in effect since mid-February.
At the same time, the price has:
→ moved into the upper half of this channel, reaching its upper boundary;
→ found support around the median line (as evidenced by the price action on 21 April).
These are bullish signs, reinforced by the aggressive nature of the rebound from the psychological 5,000-point level, which acted as significant support in the first few days following the tariff announcement. Bears may still see an attractive opportunity to attempt to resume the downward momentum of the S&P 500 index (US SPX 500 mini on FXOpen), but will the fundamental backdrop support such a move?
From an optimistic perspective, sharp impulses driven by corporate news could lead to a breakout above the upper boundary of the red channel. This would likely be facilitated by important announcements (particularly from senior officials in the US, China, and Europe) regarding de-escalation of the tariff situation.
This article represents the opinion of the Companies operating under the FXOpen brand only. It is not to be construed as an offer, solicitation, or recommendation with respect to products and services provided by the Companies operating under the FXOpen brand, nor is it to be considered financial advice.
SP500FT trade ideas

SPX: confusion will continueFinally some positive sentiment on the US equity markets. The S&P 500 marked a weekly gain of 4,6%, while investors are waging the relaxation of the ongoing trade tariffs war. Regardless of estimates of the future impact of imposed tariffs, the US tech companies are still posting relatively good results. The S&P 500 ended the week at the level of 5.525, which was the market low in March and beginning of April this year.
Alphabet gained 1,5% during the week, on the wings of posted relatively good results above estimates. Other big tech companies were also supported, like Tesla, Nvidia and Meta. Only on Friday, Nvidia gained 4,3%, while Tesla advanced by 9,8% within one day. Regardless of positive weekly results, it is still not time to celebrate. The news regarding trade tariffs coming from the US Administration still continues to be mixed, bringing a high level of confusion among market participants. In this sense, it could be expected that volatility on the equity markets will continue also in the future period.

SPX500 I Bearish Drop Based on the H4 chart analysis, we can see that the price has just reacted off our sell entry at 5522,70, which is an overlap resistance.
Our take profit will be at 5371.29, an overlap support level.
The stop loss will be placed at 5685.38, which is an overlap resistance level.
High Risk Investment Warning
Trading Forex/CFDs on margin carries a high level of risk and may not be suitable for all investors. Leverage can work against you.
Stratos Markets Limited (tradu.com):
CFDs are complex instruments and come with a high risk of losing money rapidly due to leverage. 63% of retail investor accounts lose money when trading CFDs with this provider. You should consider whether you understand how CFDs work and whether you can afford to take the high risk of losing your money.
Stratos Europe Ltd (tradu.com):
CFDs are complex instruments and come with a high risk of losing money rapidly due to leverage. 63% of retail investor accounts lose money when trading CFDs with this provider. You should consider whether you understand how CFDs work and whether you can afford to take the high risk of losing your money.
Stratos Global LLC (tradu.com):
Losses can exceed deposits.
Please be advised that the information presented on TradingView is provided to Tradu (‘Company’, ‘we’) by a third-party provider (‘TFA Global Pte Ltd’). Please be reminded that you are solely responsible for the trading decisions on your account. There is a very high degree of risk involved in trading. Any information and/or content is intended entirely for research, educational and informational purposes only and does not constitute investment or consultation advice or investment strategy. The information is not tailored to the investment needs of any specific person and therefore does not involve a consideration of any of the investment objectives, financial situation or needs of any viewer that may receive it. Kindly also note that past performance is not a reliable indicator of future results. Actual results may differ materially from those anticipated in forward-looking or past performance statements. We assume no liability as to the accuracy or completeness of any of the information and/or content provided herein and the Company cannot be held responsible for any omission, mistake nor for any loss or damage including without limitation to any loss of profit which may arise from reliance on any information supplied by TFA Global Pte Ltd.
The speaker(s) is neither an employee, agent nor representative of Tradu and is therefore acting independently. The opinions given are their own, constitute general market commentary, and do not constitute the opinion or advice of Tradu or any form of personal or investment advice. Tradu neither endorses nor guarantees offerings of third-party speakers, nor is Tradu responsible for the content, veracity or opinions of third-party speakers, presenters or participants.

$SPX Sell in May, Go Away, $5k, Dead Cat to $5.3k, $4.8k by EOMAlrighty. My forecast is as follows. I made a video explaining just a quick thought and here's the video in a written version for the most part. Basically, I'm a pattern chart trader and I spend the majority of my days looking for specific candlestick patterns that match candle for candle. I cannot find anything remotely close to today's Price Action besides October 2001. I have been and will continue to be doubted and that's okay. I am not here for anyone except myself and anyone that wants to gain a fresh unbiased perspective. People have called me a Permabear but that only pertains to my personality, which is that of a realist. I do not believe investing for the next 20-50 Years will work for everyone. You'd have to do it well and continuously contribute even during the down days. Either way. This is the analog I will be following. Fib is Extended way beyond Blow Off Top measurements imo. The market gained 50% in One Year and Three Months. I'd like to think that the uncertainty being priced in will cause these Deeper Fib Retracements. We already crashed down to the 1.61 GOLDEN POCKET from above and now bounce back to Secon Golden Pocket at 2.61. Based on the past behavior, now we move back to 2.0 for a move to the original extension of the 1.00 Fib. If we lose this, we start moving back to the 1.27 near $4.74k on SPX where I will then be looking for one final dead cat to $5300 by mid August, Every July dip being grabbed up ... Final Sell in August for an End of Year Crash to Mark 2025 as one of the worst years ever in Life as far as the Market goes. Good Luck everyone. Tips always welcome.

S&P 500: Key Levels and Potential ScenariosThis analysis of S&P500 will explore both bullish and bearish scenarios, incorporating key levels and considering possible market and crowd psychology.
Bullish Scenario: Potential Uptrend Resumption
From a bullish perspective, if the S&P 500 maintains a position above the 5482 level, it could suggest a potential end to the current correction and a resumption of the major uptrend. A hold above 5482 might reinforce bullish sentiment, encouraging further buying activity, as traders may view this as confirmation of renewed strength. The index could then potentially retest the 5801 level, where it's possible that the index may encounter resistance on the first attempt. A successful break above 5801 would then open the path towards the 6135 zone, which represents a key upside target.
Bearish Scenario: Potential Retest of Support Zones
Conversely, if the S&P 500 fails to hold above the 5482 support level might trigger increased selling pressure, as traders liquidate positions. The index could then potentially retest the 5092 to 4833 support zone. This zone represents a critical area where buyers may step in, but a break below it would signal further weakness.
Concluding Remarks
In conclusion, the S&P 500's price action around the identified key levels will be crucial in determining its short- to medium-term direction. A sustained hold above 5482 could favor a bullish continuation towards 5801 and potentially 6135, while a break below 5482 might lead to a retest of the 5092 to 4833 support zone.

SP500 H4 IdeaPotential for a bullish pullback on the SP500 H4 which could lead to a price movement towards the resistance level at 5620. BUY levels from 5500

Was this the best buying opportunity since 2011?Sure, here's a rewritten version of your text in an engaging tone:
"Have you ever heard of the Zweig Breadth Thrust? Well, let me tell you, it’s an incredible metric that can really shed some light on the current market situation!
So, what would it take for me to believe that this bounce isn't just another bear market rally? My first step would be to dive into the breadth indicators and look for signs of that elusive breadth thrust.
Think of a breadth thrust like a rocket taking off. You need a strong initial boost to break free of gravity's grip. If the thrust is weak, the rocket can’t escape, and the same applies to stock market reversals. When we see a robust breadth thrust, that's a signal that a significant reversal is underway. Without it, we could be facing another false bounce.
Now, let’s talk numbers! As of Friday, April 25th, the SPX has surged an impressive 14.2% from its recent lows, and while that’s quite a leap, it’s essential to keep it in perspective. Just think back—this index was down 21.35% from its all-time high earlier in February during the panic sell-off. Now, with the recent strength, it’s only 10.75% off its peak.
The Zweig Breadth Thrust is calculated based on the 10-day EMA of NYSE Advances divided by the sum of Advances and Declines. A bullish signal pops up when the ZBT shifts from below 0.40 to above 0.615 within just ten days or less. Keep an eye on that—it might just help us navigate these choppy waters!"
On the monthly chart, it’s clear that what we’ve been seeing in the broader economy (you know, Main Street) is actually showing us some bearish divergence—a concept I've mentioned in my previous ideas.
Since 2009, we've had four notable instances on the Monthly chart where the ZBT dipped below 0.40, only to bounce back up past the 0.6 mark. Remember back in November 2011? That was when we got a significant signal with a low reading of 0.31, which climbed back to 0.62 by February 2013. That surge sparked a bull run that peaked in February 2020!
So, the takeaway here is that this breadth thrust is generating the positive momentum we need to reach new stock market highs this year. Exciting times ahead!

US500 Will Go Down From Resistance! Short!
Take a look at our analysis for US500.
Time Frame: 9h
Current Trend: Bearish
Sentiment: Overbought (based on 7-period RSI)
Forecast: Bearish
The market is on a crucial zone of supply 5,525.49.
The above-mentioned technicals clearly indicate the dominance of sellers on the market. I recommend shorting the instrument, aiming at 5,306.14 level.
P.S
We determine oversold/overbought condition with RSI indicator.
When it drops below 30 - the market is considered to be oversold.
When it bounces above 70 - the market is considered to be overbought.
Disclosure: I am part of Trade Nation's Influencer program and receive a monthly fee for using their TradingView charts in my analysis.
Like and subscribe and comment my ideas if you enjoy them!

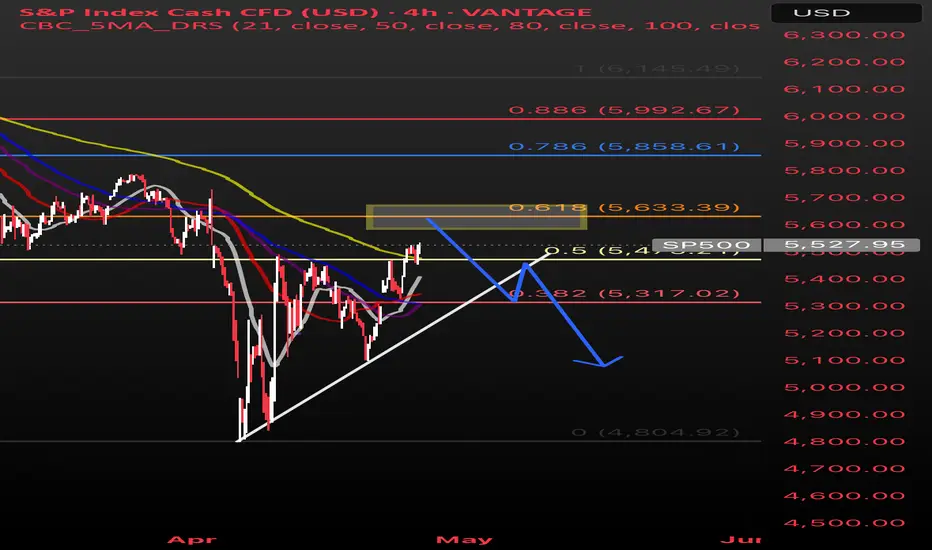
S&P 500: What’s Happening?S&P 500 Market Update
Recent changes to tariffs have made investors feel more confident, and because of that, the S&P 500 has broken out of a downward trend it had been stuck in. This breakout suggests prices could continue rising for now.
However, technical analysis shows that many investors might still be cautious. A lot of them may plan to sell if the market climbs back near $5,650 (faded yellow rectangle box on chart), trying to limit losses compared to when prices dropped to around $4,800 a few weeks ago.
If the market struggles to get past $5,650 (faded yellow rectangle box on chart), we could see prices fall again, possibly down to around $5,300, before the market settles for a bit and decides on its next big move.
• Blue line: shows the path I expect the market to take based on investor behavior and technical patterns.
• White line: shows the general trend where buyers typically step in. If the price falls through this line, it could signal more downside ahead.
SPX / SPY / ESM5 - Resistance levels aheadSPX is looking healthier above its shorter term MAs, particular with two closes above the 21 and downward trend line. There are still plenty of resistance areas ahead, including key fib levels, a gap fill, 100 and 200 down-sloping EMAs, and a swing symmetry level.

What the S&P did and what to look forward to this coming week. A walkthrough different levels on the S&P for the short term (1-2 weeks).
The S&P broke above a key weekly downtrend line this past week, shifting the structure slightly more bullish in the short term. We’re now testing an important resistance zone with multiple possible scenarios ahead.
Scenarios for the Week Ahead:
Bullish:
If the S&P holds above the breakout zone (5484) and continues climbing, we could see a move toward 5,650 (near the declining 50SMA). Some minor pauses or consolidations could occur at moving averages, but overall momentum would remain constructive if buyers stay active.
Bearish:
If the S&P fails to hold above 5,484 and breaks back below the uptrend line, we could see a pullback toward (in this order) 10 and 20 EMAs, recent uptrend line, or at most the key level around 5,264. A deeper breakdown seems less likely unless broader selling pressure returns.
Neutral: Think this would be a chop between where it is at now and 5650.

S&P 500 Daily Chart Analysis For Week of April 25, 2025Technical Analysis and Outlook:
In this week's trading session, the Index did steady to higher prices, distancing itself from the rendered obsolete Mean Resistance level of 5455 and targeting the next significant mark identified as Outer Index Rally 5550. This trend lays the groundwork for a continued upward movement; however, there is also a considerable risk of a sharp pullback to the Mean Support level of 5370 after reaching the Outer Index Rally at 5550.
Contrariwise, it is essential to acknowledge the possibility of upward momentum continuation resulting in meeting the primary target Outer Index Rally 5550 by challenging the Mean Resistance of 5672 and extending toward additional levels: Mean Resistance 5778 and Outer Index Rally 5945.

Another move down for SPX500USD?Hi traders,
SPX500USD made a bigger orange X-wave last week into the Daily FVG.
So next week we could see the start of the last impulse wave down to finish the bigger (red) WXY correction. But it first has to close below the Daily FVG.
Let's see what the market does and react.
Trade idea: Wait for a change in orderflow to bearish, a small impulse wave down and a small correction up on a lower timeframe to trade shorts.
If you want to learn more about trading FVG's & liquidity sweeps with Wave analysis, then please make sure to follow me.
This shared post is only my point of view on what could be the next move in this pair based on my technical analysis.
Don't be emotional, just trade your plan!
Eduwave

Trading Notes - April 26th
I’m struggling to stay bearish on US stocks-bearish in the short-term as the sentiment is now mainstream. The negative news dominating the headlines could create a lot of potential for a surprise upside move in the near term.
Yesterday’s steady SPX rally, despite no news, was impressive. We could easily rally another 2-4% in the short term. The sharp downside move over the last couple months does leave potential for a local lower high which would be concerning.
If there are trades to be made, intraday ranges is where I’d put my focus on stocks (and not be tooo greedy). Bitcoin has the potential the put in a macro reversal if it closes the week strong. A swing trade entry at the 200 daily MA on BTC is still in play.
SPX Technicals
Volume profile:
POC: $5609
Upside interest: $5750
Downside interest: $5303
The line in the sand over the next 2 months is the 5120 level - the August 2024 low. If we close June there, 6M bearish divergence on the RSI leaves potential for a prolonged bear market. But that’s enough long-term analysis at a news-driven time when technicals have little bearing on price action.
What I’m focusing on this week:
- Sizing down
- Taking quick profits
- Watching trump’s tweets

S&P 500 Rockets Past Resistance-Is 5,728 Next?The S&P 500 (SPX) formed a double bottom pattern on Monday, April 7, and Wednesday, April 9, on the 4-hour timeframe, signaling a potential reversal from recent lows. Later on April 9, the index broke above resistance, confirming short-term bullish momentum. On April 24, the 20-period moving average crossed above the 50-period moving average, reinforcing the strength of the emerging uptrend. By April 25, a 4-hour candle closed above the 200-period moving average, providing further confirmation of a strong bullish trend. That same day, the SPX broke through the significant resistance level at 5,501, with a candle closing above this level, which supports the view of continued upward movement. Based on my technical setup, the next potential target is projected at 5,728.

S&P 500 - Key Levels and Measurements (Bonds vs Yields vs Homes)Happy Friday!!!
Starting with a BLANK chart, here are my key levels and measurements for the S&P 500
Earnings season is stable, more MAG 7 next week with AAPL, AMZN, META, MSFT
Trump and Company are softening the trade war narrative quickly and the market
is taking notice. Prices recovered nicely this week
5500 SPX is a key level for the bulls to push above - if done look for open space
melt-up into 5700-5800 resistance
If SPX rejects 5500 early next week we will be dealing with some more noise
and intermediate levels
4830 lows will be absolutely critical to maintaining a long-term bull market. You will
see why with this analysis.
Last piece is talking about bonds vs yields and the current housing market in the US
My belief is that yields stay sticky and home prices MUST drop to see any improvements
in affordability
Thanks for watching - have a great weekend!!!


Spy putsHello friends.
We just bought some 5/16 $550 SPY puts. It's looking like the low for this crash is not anywhere near being in. Retail is still in a buying frenzy because they expect that this will be another V shaped recovery like we're used to. Meanwhile the smart money is selling everything they have and expecting more blood. The fed hasn't come in to save this market, and they aren't going to be able to. Their hands will be tied by artifical inflation caused by tariffs and there won't be an intervention until it's already too late.

Could The Stock Market Crash? - WARNING 🚨MartyBoots here , I have been trading for 17 years and sharing my thoughts on SPX .🚨
🚨 SP:SPX Could It Crash?🚨
Lets look into it deeper, very interesting chart but also a dangerous one. Need to see buyers soon or this is could be worse than people expect. 5-10% drop minimum and extreme bear could drop 40% total🚨
Watch video for more details

Bearish WXY Model Forming at Key Resistance – Caution at the TopSP:SPX just crossed the Monthly High, but the structure resembles a bearish WXY correction, and we’re now approaching critical levels.
🔍 Key Levels to Watch:
5481–5572: Weekly FVG resistance + 61.8% Fib Extension – potential top of the rally.
5293: The 50% retracement from the Apr 20 low – a break below confirms the bearish WXY and opens the door to new lows.
📌 Scenario Outlook:
✅ Bullish case: Room for upside toward 5685–5750, but only if we close above 5572 Weekly to invalidate the FVG.
⚠️ Bearish case: Current price action aligns with divergence (as seen with DJI) + WXY model. Caution advised — rallies may be fading.
💬 Chart attached shows the WXY structure forming with key divergences.

the 2 gapsOverview of the market and it's possible direction. We are over the 18ma so the bias is up, but we haven't broken the range yet.

S&P 500 tests key resistance as trade uncertainty continuesTrump continues to say positive things - just now suggesting that they are very close to a deal with Japan on tariffs. But it is China where the bulk of uncertainty lies. He has been quite upbeat this week, but China continues to push back against the optimism.
European indices extended their gains, buoyed by the previous day’s upbeat mood, while US futures have given up their earlier gains. The shift likely linked to an interesting interview US President Donald Trump gave to Time Magazine.
While Trump claimed Chinese President Xi had personally rung him — and insisted that negotiations with Beijing were progressing — it was his remark that he’d consider “50% tariffs a year from now” to be a success that seemed to spook investors. Unsurprisingly, that struck a more hawkish tone, nudging some traders to lock in profits.
Earlier in the session, risk appetite had been given a lift after reports surfaced that China was weighing tariff exemptions for select US imports. This, combined with upbeat comments from Trump the day before and a solid set of earnings from Alphabet, helped extend the rally in equities.
Gold, meanwhile, gave back some ground — dipping below the $3,300 mark — as safe haven demand cooled in response to the renewed optimism. Yet, beneath the surface, caution remains palpable. Trump’s off-the-cuff comment about 50% tariffs a year from now served as a stark reminder that nothing is set in stone, and that the trade saga is far from over.
As such, while some of the worst risk-off flows may be behind us, it’s far too soon to declare an end to the market turmoil. A period of consolidation — both in equities and gold — may now be on the cards.
Meanwhile the S&P 500 has entered a key area of resistance between 5490 to 5550 area. A bearish trend line also comes into play. A clean break should be positive from a short-term point of view, while a sharp rejection is what the bears would be looking for.
By Fawad Razaqzada, market analyst with FOREX.com

Bitcoin is correlated to the stock market.Bitcoin is correlated to the stock market.
What do you think is most likely gonna happen once we get a Dotcom or GFC type of bust?
Narratives and storylines change, the chart analysis remains the same.
