5 Proven Tricks to Trade Without FOMO After Missing Your TriggerYo traders! In this video, I’m breaking down what to do if you miss a trading trigger , so you can stay calm , avoid FOMO , and still catch the next move. We’re diving into five solid strategies to re-enter the market without losing your cool:
Buy on the pullback zone.
Buy with an engulfing candle after a pullback.
Buy after breaking the resistance formed by the pullback.
Buy after the second wave with an indecision candle.
Buy after breaking a major resistance post-second wave, confirmed by RSI or momentum oscillators.
These tips are all about keeping your trades smart and your head in the game. For more on indecision candles, check out this lesson . Wanna master breakout trading? Here’s the breakout trading guide . Drop your thoughts in the comments, boost if you vibe with it, and let’s grow together! 😎
SP500FT trade ideas

SPX to 6600+ by Aug 5This leg up in SPX is not over yet. Target at upper bound of the channel around 6.6K+ by Aug 5.

SPX500 Update: Monster Trigger Ready to Launch!Welcome back, traders, it’s Skeptic from Skeptic Lab! 😎 With news of the unemployment rate rising, stock and crypto markets have been surging hard, and right now, we’ve got a killer trigger on SPX500 you don’t want to miss. Its breakout could spark the next major bullish leg. Let’s dive into the Daily and 4-hour timeframes to unpack this setup. here’s the play:
✔️ Daily Timeframe:
After a strong rally, SPX500 hit an all-time high (ATH) at 5,249.14 before entering a deep correction. Here’s what many traders miss: support/resistance levels aren’t static—they shift over time. The resistance that was at 6,146.89 has now climbed to 6,290. Breaking 6,290 signals the start of a major bullish trend after 146 days of correction. This is our primary long trigger.
📊 4-Hour Timeframe (Futures Triggers):
Long Trigger: After a solid uptrend with strong momentum, we entered a time-based correction within a box pattern. Breaking the box ceiling at 6,290 is the long trigger, aligning with the Daily breakout.
Short Trigger: Breaking the box floor would trigger a short, but this goes against the trend, so stop-loss risk is higher, and your win rate could take a hit—stay cautious.
📉 Key Insight: The 6,290 breakout is the big move to watch, fueled by market momentum from the unemployment news. Shorts are riskier due to the bullish trend, so prioritize longs with volume confirmation.
🔔 Confirmation: For longs, confirm the 6,290 break with RSI entering overbought.Risk management is critical—cap risk at 1%–2% per trade to survive the market’s swings.
🔼 I’ll update if the structure shifts! Thanks for vibing with this analysis! <3
💬 Let’s Talk!
Which SPX500 trigger are you locked on? Hit the comments, and let’s crush it together! 😊 If this update lit your fire, smash that boost—it fuels my mission! ✌️

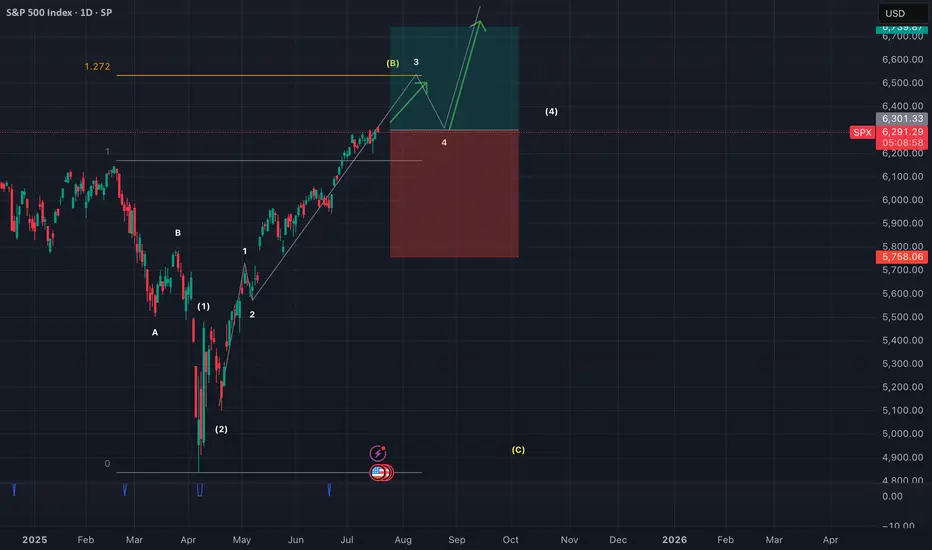
SPX500 in bullish impulseSPX500 currently at 3rd wave of wave (3) (both 2.618% extended). Expecting a retrace at 6517 region for wave 4.
S&P 500 Daily Chart Analysis For Week of July 18, 2025Technical Analysis and Outlook:
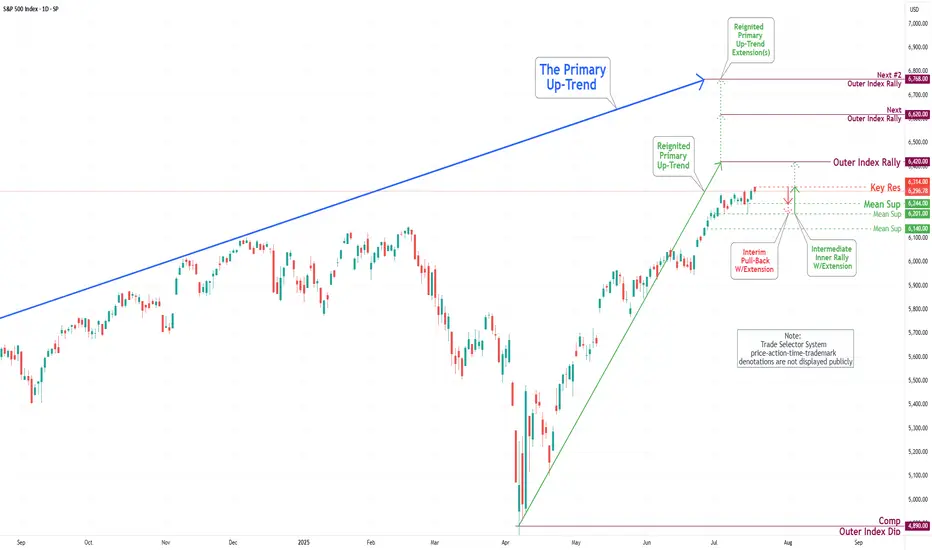
During the current trading week, the S&P 500 Index has demonstrated a predominantly upward trajectory. It has successfully retested the Mean Support level at 6200 and established a new Key Resistance level at 6314. Currently, the index displays a bullish sentiment, with the objective for the Outer Index Rally set at 6420.
Nevertheless, it is essential to recognize that the current price action may result in a decline, potentially leading to a retest of the Mean Support at 6244 and extending to the Mean Support at 6201. Following this potential downward movement, it is anticipated that the index will resume its upward trend, driving the price action towards the Key Resistance level at 6314 and ultimately achieving the Outer Index Rally target of 6420.
SPX500 Short From Resistance!
HI,Traders !
#SPX500 is trading in an
Uptrend but the price will
Soon hit a horizontal resistance
Area around 6285.44 from
Where we will be expecting
A local bearish correction !
Comment and subscribe to help us grow !

S&P overbought sideways consolidation supported at 6207 Fed Signals Rate Cut Ahead
US Federal Reserve Governor Christopher Waller called for a quarter-point interest rate cut this month, citing cooling inflation and minimal upside price risks. His dovish stance diverges from the broader FOMC consensus, which still views the labor market as resilient.
UK-Germany Defense Pact
UK PM Keir Starmer signaled potential alignment with Germany to purchase US weapons for Ukraine, following the signing of the “Kensington Treaty.” The accord emphasizes mutual defense cooperation, raising expectations of deeper UK involvement in European security initiatives.
Intel Concerns with Spain
US lawmakers raised concerns over intelligence sharing with Spain, due to the country's reliance on Huawei for its wiretap infrastructure, highlighting geopolitical tech tensions.
Trump Authorizes Epstein Testimony Release
President Donald Trump has authorized the release of grand jury testimony from the Epstein case, yielding to public and political pressure for greater transparency.
S&P 500 Outlook:
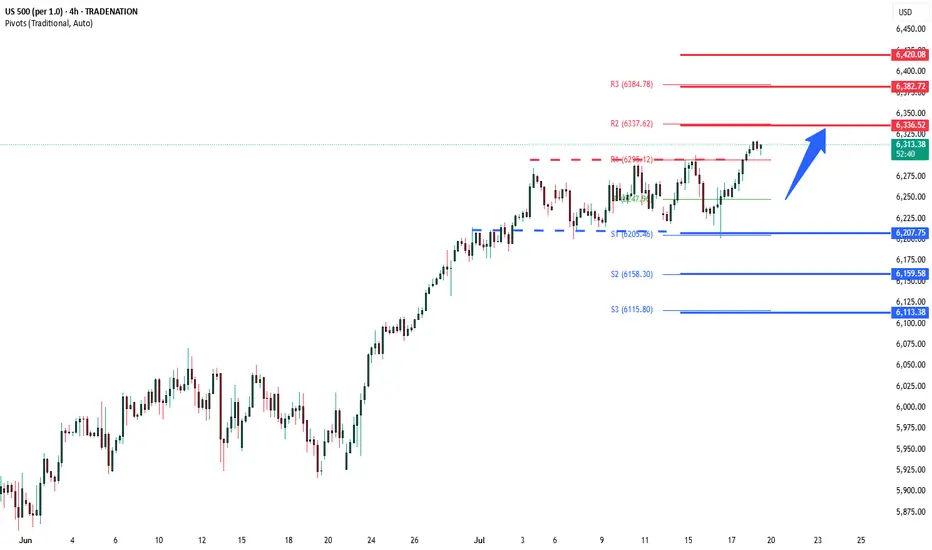
Waller’s call for a rate cut adds bullish momentum for equities, especially rate-sensitive sectors like tech and real estate. While geopolitical tensions and defense headlines introduce headline risk, the dovish Fed signal is likely to dominate sentiment in the near term. Expect S&P 500 support near 6207 with upside potential if more Fed officials echo Waller’s stance.
Key Support and Resistance Levels
Resistance Level 1: 6336
Resistance Level 2: 6383
Resistance Level 3: 6420
Support Level 1: 6207
Support Level 2: 6160
Support Level 3: 6113
This communication is for informational purposes only and should not be viewed as any form of recommendation as to a particular course of action or as investment advice. It is not intended as an offer or solicitation for the purchase or sale of any financial instrument or as an official confirmation of any transaction. Opinions, estimates and assumptions expressed herein are made as of the date of this communication and are subject to change without notice. This communication has been prepared based upon information, including market prices, data and other information, believed to be reliable; however, Trade Nation does not warrant its completeness or accuracy. All market prices and market data contained in or attached to this communication are indicative and subject to change without notice.
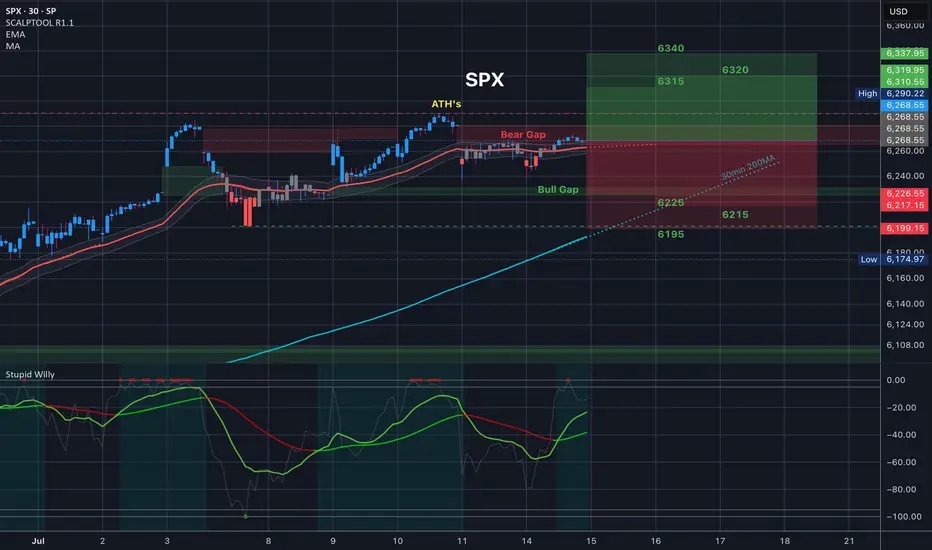
S&P500 (CASH500) (SPX500) SHORT - Head and shoulders 30minRisk/reward = 3.3
Entry price = 6314.8
Stop loss price = 6318.4
Take profit level 1 (50%) = 6301.3
Take profit level 2 (50%) = 6297.5
Waiting on validation from a few other variables.
For example, waiting for the current 30min candle to close in range.
Letssss goooooo
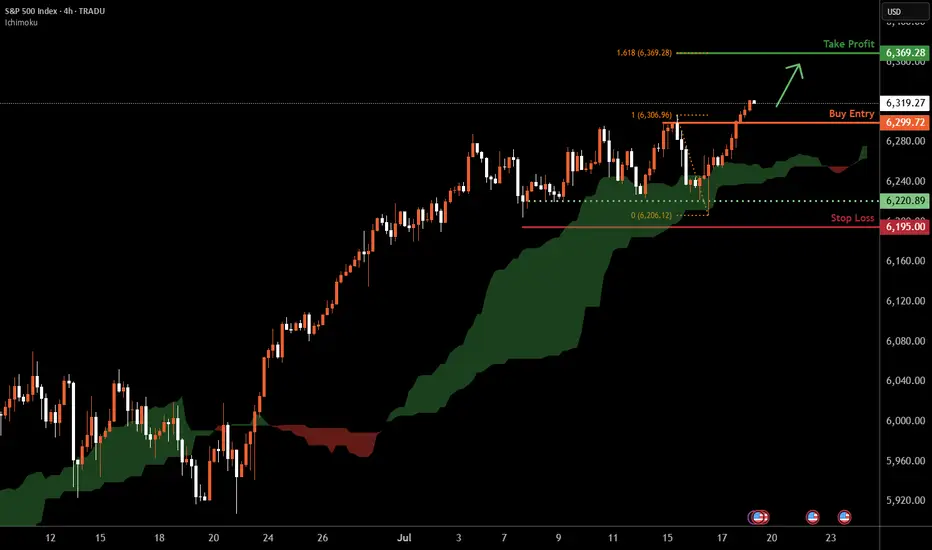
S&P 500 H4 | Making a run towards a new ATH?The S&P 500 (SPX500) is falling towards a pullback support and could potentially bounce off this level to climb higher.
Buy entry is at 6,299.72 which is a pullback support.
Stop loss is at 6,195.00 which is a level that lies underneath a multi-swing-low support.
Take profit is at 6,369.28 which is a resistance that aligns with the 161.8% Fibonacci extension.
High Risk Investment Warning
Trading Forex/CFDs on margin carries a high level of risk and may not be suitable for all investors. Leverage can work against you.
Stratos Markets Limited (tradu.com ):
CFDs are complex instruments and come with a high risk of losing money rapidly due to leverage. 66% of retail investor accounts lose money when trading CFDs with this provider. You should consider whether you understand how CFDs work and whether you can afford to take the high risk of losing your money.
Stratos Europe Ltd (tradu.com ):
CFDs are complex instruments and come with a high risk of losing money rapidly due to leverage. 66% of retail investor accounts lose money when trading CFDs with this provider. You should consider whether you understand how CFDs work and whether you can afford to take the high risk of losing your money.
Stratos Global LLC (tradu.com ):
Losses can exceed deposits.
Please be advised that the information presented on TradingView is provided to Tradu (‘Company’, ‘we’) by a third-party provider (‘TFA Global Pte Ltd’). Please be reminded that you are solely responsible for the trading decisions on your account. There is a very high degree of risk involved in trading. Any information and/or content is intended entirely for research, educational and informational purposes only and does not constitute investment or consultation advice or investment strategy. The information is not tailored to the investment needs of any specific person and therefore does not involve a consideration of any of the investment objectives, financial situation or needs of any viewer that may receive it. Kindly also note that past performance is not a reliable indicator of future results. Actual results may differ materially from those anticipated in forward-looking or past performance statements. We assume no liability as to the accuracy or completeness of any of the information and/or content provided herein and the Company cannot be held responsible for any omission, mistake nor for any loss or damage including without limitation to any loss of profit which may arise from reliance on any information supplied by TFA Global Pte Ltd.
The speaker(s) is neither an employee, agent nor representative of Tradu and is therefore acting independently. The opinions given are their own, constitute general market commentary, and do not constitute the opinion or advice of Tradu or any form of personal or investment advice. Tradu neither endorses nor guarantees offerings of third-party speakers, nor is Tradu responsible for the content, veracity or opinions of third-party speakers, presenters or participants.
Market Mood Sours as Inflation Surprises AgainU.S. stock markets were under pressure on Tuesday after new inflation data came in higher than expected. This has made investors rethink how soon the Federal Reserve might cut interest rates.
What Happened?
● The Consumer Price Index (CPI) recorded its biggest monthly rise in 5 months.
● Core inflation (which excludes food and energy) jumped by 2.9% compared to last year — more than the Fed's 2% target.
What It Means
● Investors had expected the Fed to cut interest rates multiple times in 2025.
● After the inflation report, they now think the Fed will cut less than expected.
● The chances of a rate cut in September also dropped sharply.
Market Impact
● Bond yields went up — the 10-year U.S. government bond yield rose to 4.49%, making borrowing more expensive.
● Stock futures fell (Dow, S&P 500, Nasdaq), as higher yields tend to hurt company profits and stock prices.
S&P 500 and Dow Struggle at Resistance
● Both the S&P 500 and Dow Jones faced resistance near all-time highs.
● This rejection suggests potential for further short-term pullback, especially if macro pressures like inflation and rate uncertainty persist.
Near-Term Outlook
With inflation running hotter than expected, hopes for early Fed rate cuts have cooled. Traders and investors should remain cautious, manage risk actively, and prepare for continued volatility in the coming weeks.

A steady move up for the next 3 yearsYou can clearly see the pattern. The boom/bust cycle, and inflation. Don't expect my lines to be exact. Imagine bitcoin if we hit the upper trend line.
Bullish for the next 3-5 years and another crisis. (2030)
They should teach this in school.
Major LowI'm buying puts expiring on October 31st, All Hallow's Eve.
I'll give price room to keep melting up to 666 at the farthest, that is my stop level. If we breach that price, then just know that tech is unstoppable and Artificial Intelligence is the Mark of the Beast.
If the market doesn't drop here, then the sky is the limit.

US 500 – A New Record Peak or Reversal in the Week AheadSo far in July, the US 500 has recorded multiple all-time highs on its way to an eventual peak of 6294 on Thursday (July 10th), from which it finally succumbed to some profit taking into the weekend, leading to a small Friday sell off to close at 6255 (-0.4%).
Along the way traders have ignored mixed US economic data, and more importantly they have, for the most part, shrugged off President Trump’s increasingly aggressive approach to tariffs, choosing instead to focus on economic resilience, renewed AI optimism and an improving outlook for the Q2 corporate earnings season that kicks fully into gear in the coming days.
In terms of tariffs, the fact that there is now a new August 1st deadline to concentrate on may be taking away some of the immediate urgency for the announcement of trade deals, although these issues still remain important and on-going, highlighted by President Trump's weekend social media announcement of 30% tariffs on the EU and Mexico, if a better deal cant be reached in the next 3 weeks.
With regard to corporate earnings, the major US banks like JP Morgan (Tuesday before the open) and Bank of America (Wednesday before the open) report this week. Both company’s share prices have seen strong gains since the April lows, so traders will be eagerly awaiting their actual numbers. They will also be keen to hear the thoughts of the bank CEOs on future earnings, bad debt provisions and the potential impact of Trump’s tariffs on the US economy moving forward. Only last week, Jamie Dimon, CEO of JP Morgan, warned market complacency towards potential tariff risks.
In terms of scheduled economic data. Tuesday’s US CPI (1330 BST) and Wednesday’s PPI release (1330 BST) stand out. Traders are sensitive to US inflation updates and have been watching over the last several months for signs that tariffs are pushing up prices. So far this hasn’t been the case but these new releases may tell a different story.
All of these issues could impact risk sentiment and the direction of the US 500 index in the next 5 trading days. Certainly, the early open has been impacted by President Trump's weekend tariff announcement, with the US 500 currently down 0.46% at 6227 (0800 BST).
The technical outlook could also be an important factor in determining price moves.
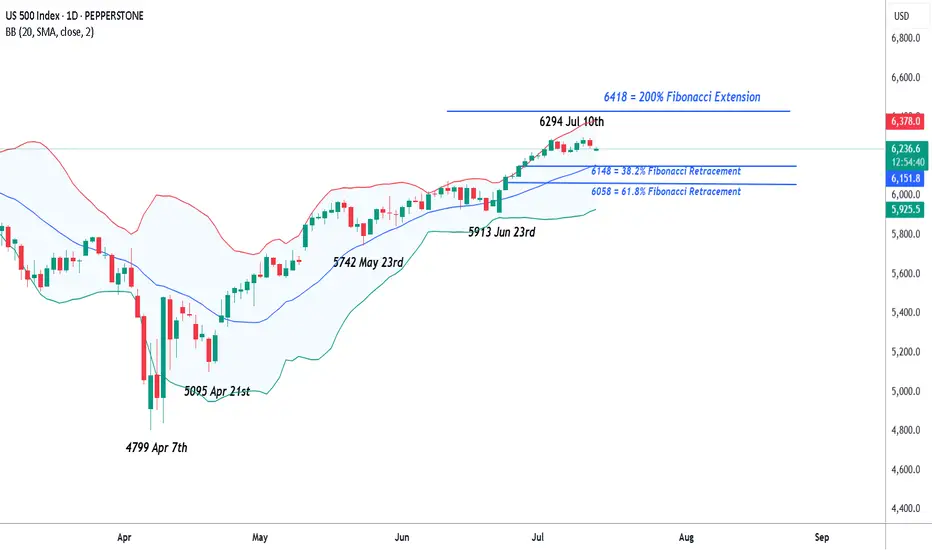
Technical Update: Assessing the Move to A New Record High
Last week appears to have seen a slowing in the speed of the recent price strength, but a new all-time high was still posted at 6294 on Thursday. It could be argued that this activity maintains what is still a more constructive pattern of higher price highs and higher price lows that have materialised since the April 7th downside extreme of 4799.
However, there is no guarantee this price activity will continue to see new all-time highs posted, so we need to be aware of potential support and resistance levels that may influence price activity.
Possible Support Levels:
If last week’s possible slowing in upside price momentum develops into a new phase of price weakness, a support level that traders might now be watching could be 6148.
This 6148 level is equal to both the 38.2% Fibonacci retracement of June 23rd to July 10th strength and the current level of the rising Bollinger mid-average. Closes below 6148 might suggest a more extended phase of weakness back to 6058, the lower 61.8% Fibonacci retracement, possibly further if this in turn gives way.
Possible Resistance Levels:
Having been capped by the 6294 all-time high last week, sellers may continue to be found at this level, so this might prove to be the first potential resistance if fresh attempts at price strength over the coming week develop.
Closing defence of 6294 may need to be watched if challenged, as successful breaks above this level might suggest an extension of the uptrend pattern currently evident in price activity. Such closing breaks higher may well suggest price strength towards 6418, the 200% Fibonacci extension level of the recent price decline.
The material provided here has not been prepared accordance with legal requirements designed to promote the independence of investment research and as such is considered to be a marketing communication. Whilst it is not subject to any prohibition on dealing ahead of the dissemination of investment research, we will not seek to take any advantage before providing it to our clients.
Pepperstone doesn’t represent that the material provided here is accurate, current or complete, and therefore shouldn’t be relied upon as such. The information, whether from a third party or not, isn’t to be considered as a recommendation; or an offer to buy or sell; or the solicitation of an offer to buy or sell any security, financial product or instrument; or to participate in any particular trading strategy. It does not take into account readers’ financial situation or investment objectives. We advise any readers of this content to seek their own advice. Without the approval of Pepperstone, reproduction or redistribution of this information isn’t permitted.
Risk environment to remain positive? S&P continuation?Despite all the recent tariff concerns, inflation concerns and Middle East worries. The S&P continues to push all tine highs. And 'risk surprises' not withstanding, is likely to do so. Backed up by a solid start to ratings season, especially from Netflix.
In the currency space, that should mean the JPY remains weak. And I'm cutoutting recent JPY strength due to profit taking ahead of weekend elections. But moving into the new week, i'll be looking for JPY short opportunities.
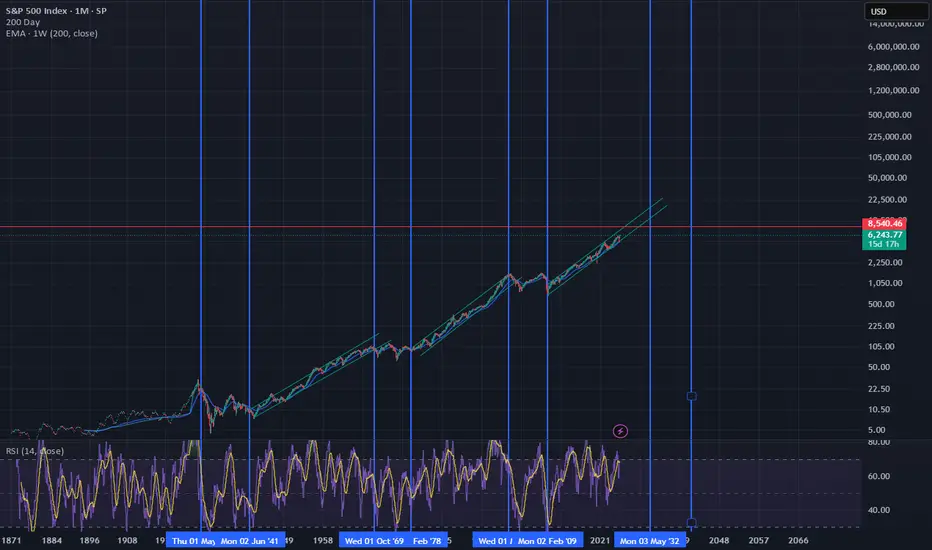
SPX: Long-Term Strength and Opportunity
SPX: Long-Term Strength and Opportunity
The S&P 500 (SPX) on this monthly timeframe clearly illustrates a powerful long-term uptrend, where each significant pullback has consistently presented a valuable buying opportunity. Most recently, the market effectively retested and bounced off the established long-term trendline, even amidst geopolitical concerns such as the April low experienced when tariffs were announced, underscoring the underlying bullish resilience. This sustained trajectory suggests continued upward momentum, reaffirming the 'buy the dip' strategy within this robust market environment.
Disclaimer:
The information provided in this chart is for educational and informational purposes only and should not be considered as investment advice. Trading and investing involve substantial risk and are not suitable for every investor. You should carefully consider your financial situation and consult with a financial advisor before making any investment decisions. The creator of this chart does not guarantee any specific outcome or profit and is not responsible for any losses incurred as a result of using this information. Past performance is not indicative of future results. Use this information at your own risk. This chart has been created for my own improvement in Trading and Investment Analysis. Please do your own analysis before any investments.

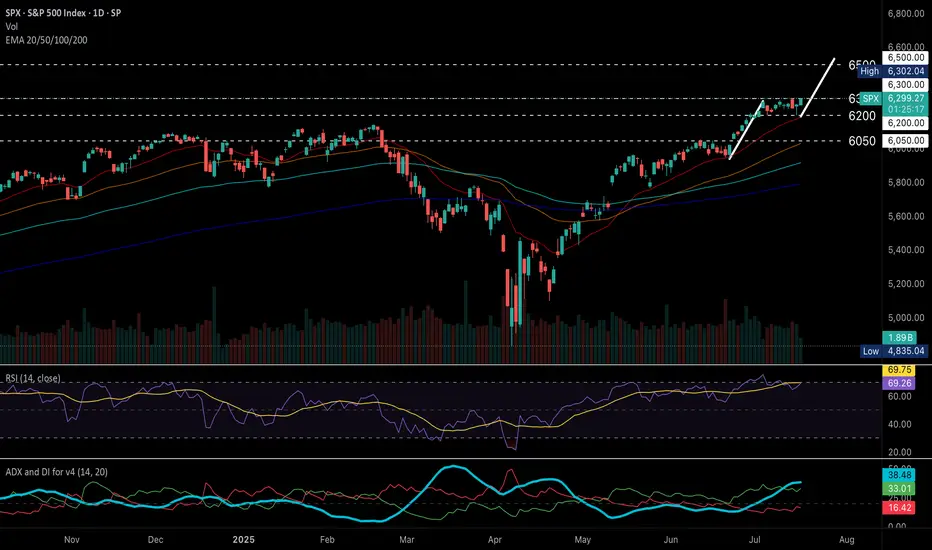
S&P 500 (US500) maintains strong bullish momentum.S&P 500 (US500) maintains strong bullish momentum.
Technical Outlook
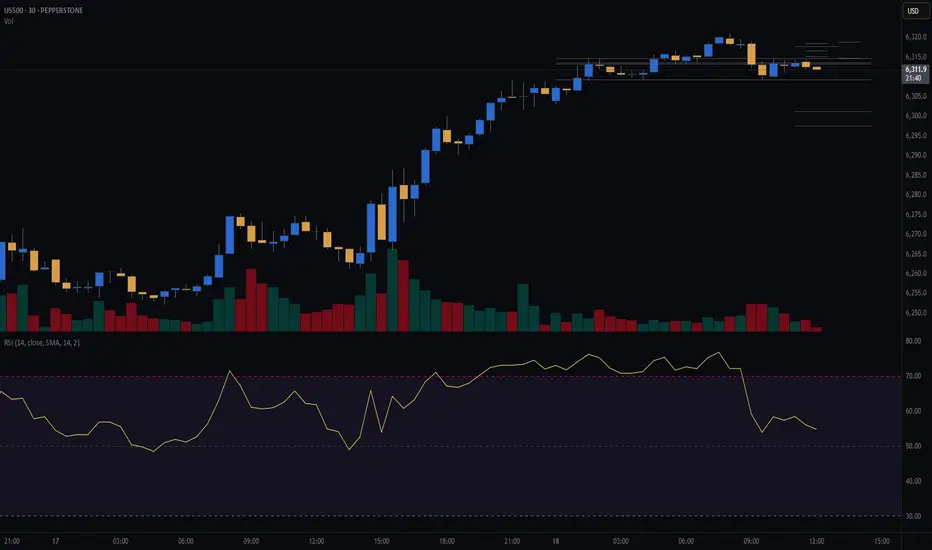
S&P 500 (US500) holds a strong bullish structure, continuing to print higher highs and higher lows above diverging EMAs, signaling sustained upward momentum.
RSI has eased from overbought levels, now hovering below 70, while price consolidates sideways near recent highs, a typical pause before potential continuation.
ADX remains elevated above DI+ and DI-, with DI+ above DI–, confirming trend strength and ongoing bullish momentum.
A breakout above the 6300 all-time high would confirm a bullish continuation, with the next upside target near 6500 based on the flagpole projection.
Conversely, a drop below 6200 may trigger a deeper pullback toward the 6050 support zone.
Fundamental Outlook
Corporate earnings, particularly in the tech sector, continue to exceed expectations, providing significant support to the index. Analysts project continued earnings growth for S&P 500 companies, with profits expected to grow by approximately 9% year-over-year in 2025, reinforcing confidence in the index’s rising fundamental valuation.
Markets are now pricing in earlier Fed rate cuts, driven by evolving economic data and political pressure.
Economic data such as stronger-than-expected retail sales and unemployment claims, though the latter could reduce the likelihood of imminent rate cuts, signal robust consumer demand, which should continue to support economic growth.
by Terence Hove, Senior Financial Markets Strategist at Exness
SellRejection Level
Daily Volume
Market Structure Shift
London Session
Trend Line Break
Untapped Order Point

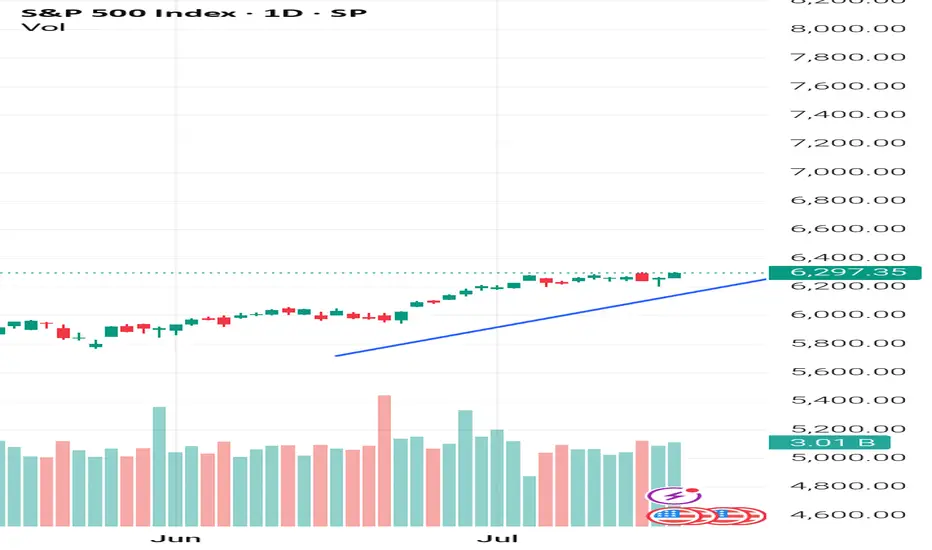
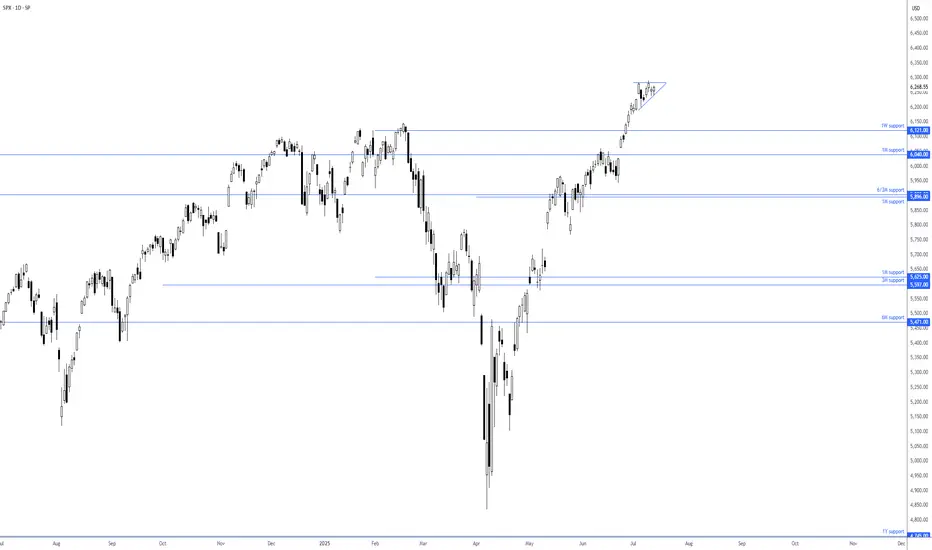
S&P 500 consolidating at all-time highsOf late, we have seen price action on the S&P 500 consolidate around all-time highs of 6,290 and is on track to form a small ascending triangle. The nearest support to note resides at the 1W level of 6,121, closely shadowed by a 1M support from 6,040.
Based on the current technical picture, this clearly remains a buyers’ market.
- FP Markets Research Team
$SPX Trading Range for 7.15.25 and everything in it for CPI
Tomorrow’s Trading range and everything in it. How are you playing it?
US500 evening analysisMy primary count of bullish price action since 7 April 2025 low sees regular flat (regular flat A, zigzag B, impulse C), impulse C with ending diagonal 5 of (5).
Median line (red line) of pitchfork was never tagged, implies price action eventually returning to origin (5098.6).
Ending diagonal invalid above 6307.2, bears with high reward, low risk opportunity.

S&P 500 H4 | Approaching a multi-swing-low supportThe S&P 500 (SPX500) is falling towards multi-swing-low support and could potentially bounce off this level to climb higher.
Buy entry is at 6,220.89 which is multi-swing-low support that aligns with the 23.6% Fibonacci retracement.
Stop loss is at 6,170.00 which is a level that lies underneath a multi-swing-low support.
Take profit is at 6,299.72 which is a swing-high resistance.
High Risk Investment Warning
Trading Forex/CFDs on margin carries a high level of risk and may not be suitable for all investors. Leverage can work against you.
Stratos Markets Limited (tradu.com ):
CFDs are complex instruments and come with a high risk of losing money rapidly due to leverage. 63% of retail investor accounts lose money when trading CFDs with this provider. You should consider whether you understand how CFDs work and whether you can afford to take the high risk of losing your money.
Stratos Europe Ltd (tradu.com ):
CFDs are complex instruments and come with a high risk of losing money rapidly due to leverage. 63% of retail investor accounts lose money when trading CFDs with this provider. You should consider whether you understand how CFDs work and whether you can afford to take the high risk of losing your money.
Stratos Global LLC (tradu.com ):
Losses can exceed deposits.
Please be advised that the information presented on TradingView is provided to Tradu (‘Company’, ‘we’) by a third-party provider (‘TFA Global Pte Ltd’). Please be reminded that you are solely responsible for the trading decisions on your account. There is a very high degree of risk involved in trading. Any information and/or content is intended entirely for research, educational and informational purposes only and does not constitute investment or consultation advice or investment strategy. The information is not tailored to the investment needs of any specific person and therefore does not involve a consideration of any of the investment objectives, financial situation or needs of any viewer that may receive it. Kindly also note that past performance is not a reliable indicator of future results. Actual results may differ materially from those anticipated in forward-looking or past performance statements. We assume no liability as to the accuracy or completeness of any of the information and/or content provided herein and the Company cannot be held responsible for any omission, mistake nor for any loss or damage including without limitation to any loss of profit which may arise from reliance on any information supplied by TFA Global Pte Ltd.
The speaker(s) is neither an employee, agent nor representative of Tradu and is therefore acting independently. The opinions given are their own, constitute general market commentary, and do not constitute the opinion or advice of Tradu or any form of personal or investment advice. Tradu neither endorses nor guarantees offerings of third-party speakers, nor is Tradu responsible for the content, veracity or opinions of third-party speakers, presenters or participants.

SPX - Next Target is 7000- SPX is currently trading around 6200 after breakout previous all time high.
- Price has formed a nice broadening wedge pattern and currently heading towards the next resistance line.
- We can expect a slight correction upt o 6100, and reversal towards 7000.
- I'm expecting SPX to hit 7000 target by Q1 of 2026.
Trade Opportunity
Entry: 6200
TP1: 6400
TP2: 6600
TP3: 6800
TP4: 7000
SL at: 6057
Stay tuned frequent updates
Cheers
GreenCrypto

SPX looking brittleSPX seems to showing signs of cooling, noting by the 50/200 SMA lines clearly show this. Also, lower highs. Don't wait until you're in the red to sell! Remember that retailers have been buying and institutions have been offloading stocks. Someone will be holding the bag!
