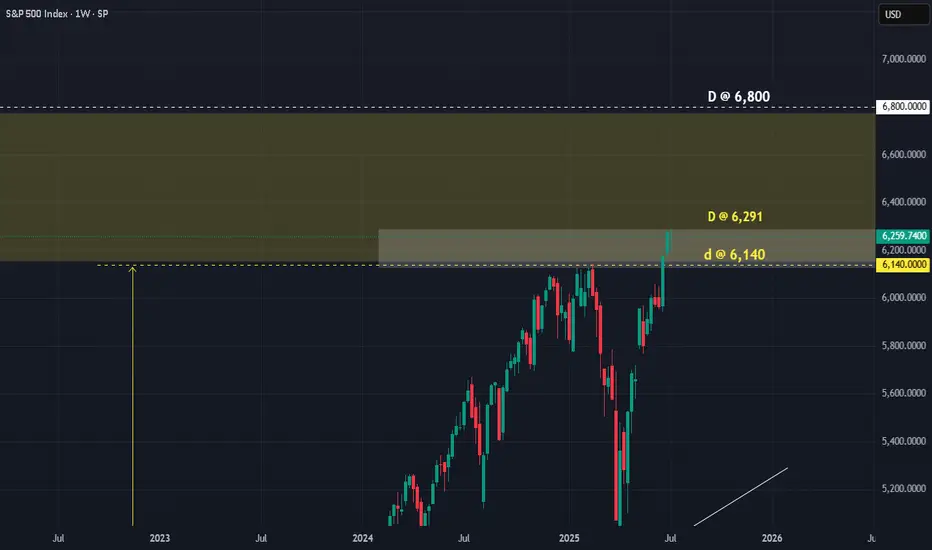
SPX : How to play this DPrice has now reached our target as anticipated. The question is, when do we SELL?
Anyway, for those who follow the D, I am sure it has saved you guys a lot of trouble. At least you know where/when to start SELLING. Many others who started selling EARLy had all lost their money.
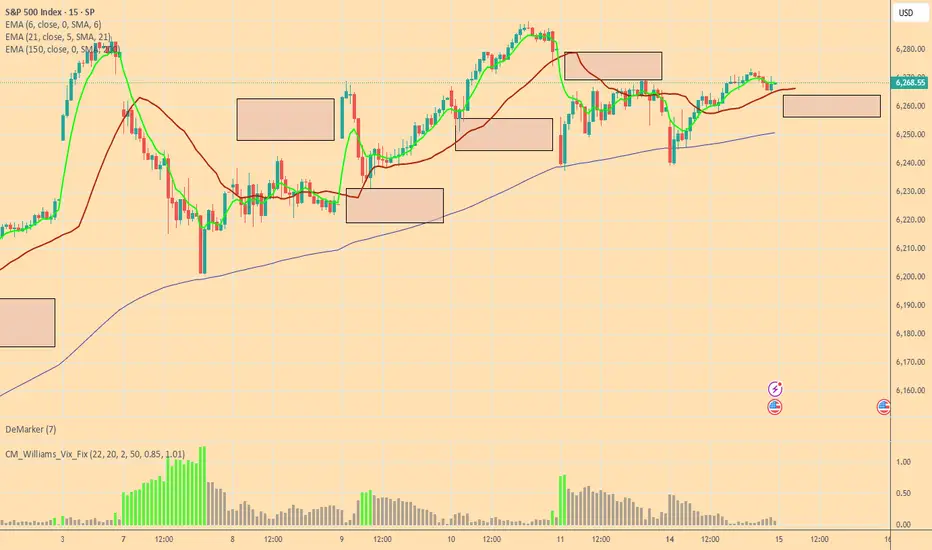
As we can see, there are 3 D's. Price can still move UP to 6,800. Bear that in mind. Or has already reached the max at 6,291!!!
Price is at where they are, there are 2 choices:
a) SELL now and SL @ 6,300
b) SELL when price touched the lower D @ 6,140 with SL @ 6,291
Whichever way, the R/R is still FANTASTIC.
It is true that MARKET MAKER might still take advantage and try to screw short sellers. But even they would find it hard at the D. For even they need to respect it a bit.
If you know your D, you trade safer.
Good luck.
SP500FT trade ideas
SPX 6300 Highs to 6200 Lows - Watch Key LevelsThis week earnings season kicks off
-Notables include JPM, GS, BAC, WFC, NFLX, KMI, PEP and others
US Inflation (CPI and PPI) this week
-forecasts are showing HIGHER inflation
-consumers care, but markets may not
6300-6350 key resistance area for SPX
6200 key support area for SPX
If we break the 6200 floor, there's room to fall to 6000-5700 to find stronger support
I discuss the 50 day moving averarages on the S&P and Nasdaq as levels to watch
For the remainder of the month...
7/18 July Monthly Expiration
7/30 US FOMC (with Press Conference)
8/1 US Non-Farm
8/1 US Tariff Deadline (per Trump)
Markets will have to really love a slew of good earnings and good news to see more highs and melt-ups through this typically bumpy season (Aug-Sep)
Thanks for watching!!!

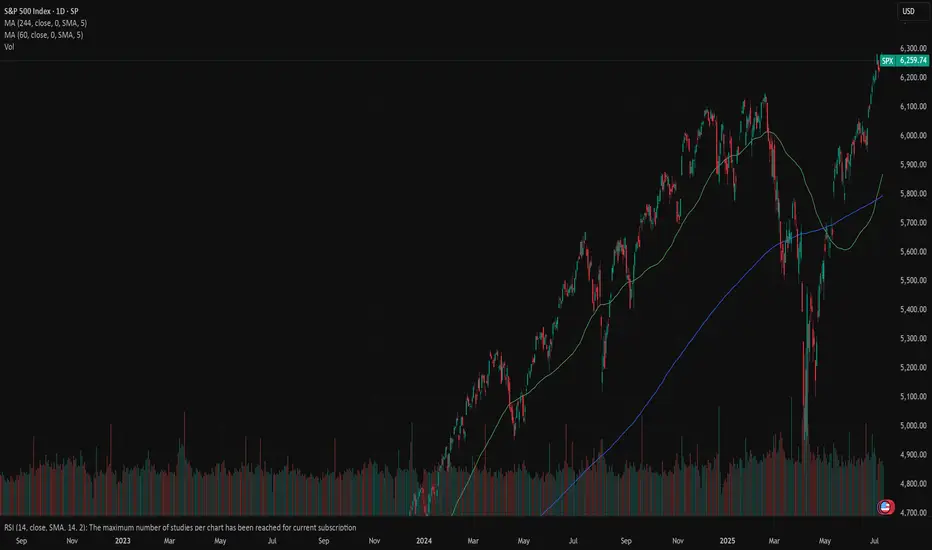
SPX: earnings sentiment aheadPrevious week was another optimistic week on financial markets. Regarding the approaching deadline for a delay in the application of trade tariffs set by the US Administration, which came due on July 9th, the market did not show much of a concern. The green trend line of the S&P 500 continued during the week, where the index managed to reach another new all time highest level on Thursday, at 6.290. During the previous week there has not been any currently important US macro data posted, in which sense, the market sentiment remained optimistic. However, Friday's news regarding trade tariffs spoiled a bit of an up-trend, so the index ended the week, just a bit lower from its ATH level, at 6.259.
Weekly tariffs news include a 35% imposed tariffs on imports from Canada, and 50% on goods imported from Brazil in the U.S. There are also some comments on a potential increased universal 10% tariff on the majority of other nations, noting 15% and 20%, as well as a 50% tariff on copper. Analysts are noting that the market is already adjusted to the comments regarding trade tariffs, in which sense, there are no more strong market reactions on any incoming news.
The week ahead brings some important US macro data, as well as gearing up for the earnings season, starting with major banks like JPMorgan. The June inflation data as well as PPI will be posted in the week ahead, closing with University of Michigan Consumer Sentiment. This data might bring back some volatility to the S&P 500, however, the general investors sentiment remains positive at this moment.
SP500 weekly balance?JUst some ideas while looking at weekly charts. We've put in a doji on the week - indecision. A pullback to 6100 would start raising flags about a possible false breakout from balance.

SPX500USD is on a riseHi traders,
Last week SPX500USD started the next impulse wave 5 (grey) as I've said in my outlook.
Next week we could see more upside for this pair.
Let's see what the market does and react.
Trade idea: Wait for a small pullback and a change in orderflow to bullish on a lower timeframe to trade longs.
NOTE: the next three weeks I'm on holiday so I will not post any outlook publicly.
If you want to learn more about trading FVG's & liquidity sweeps with Wave analysis, then please make sure to follow me.
This shared post is only my point of view on what could be the next move in this pair based on my technical analysis.
Don't be emotional, just trade your plan!
Eduwave

SPX500 NEARING AN IMPORTANT FIB. EXTENSION RESISTANCEIn this weekend's analysis I find the SPX500 to remain BULLISH for next few days as we have strong closings outside the upper KC band and also touching the upper Bollinger band on the higher time frames from Daily to Monthly charts. It's also important to note that declining volume bars is NOT supporting the monthly rally, while MACD, RSI divergences are also sounding warning sirens that it's near a major correction territory which I have measure as the fib extension 0.618 from the October, 2022 base or support on the monthly chart. As signaled last week that we could be getting a capitulation candle soon to the fib target. Once we get a reversal candle on the 4 Hours it will confirm that the intermediate tops is achieved on the SPX500 and a correction is highly probable. So our trade thesis is Bullish until we get a confirmed bearish signal on either the 4H or 1D timeframe with Stop loss at 6377 level. Thanks for visiting my publication and trade idea on the SPX500. Cheers and happy trading to everyone.

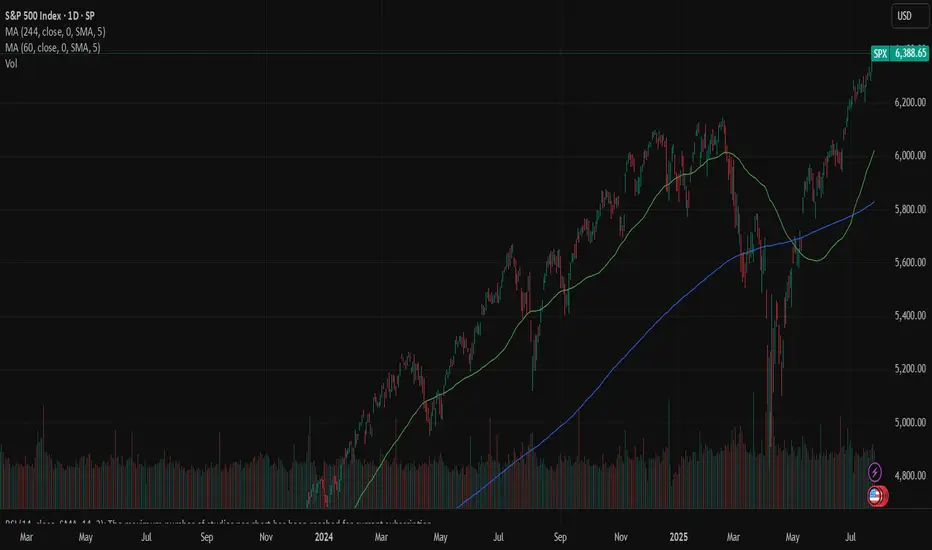
SPX: Tariffs deal (un)certainty Investors' optimism continued to hold at the U.S. equity markets another week in a row. The S&P 500 posted another weekly winning streak, supported by solid earnings of companies included in the index. The index also reached another all time highest level, with Friday's level of 6.388, gaining around 1,5% for the week.
Tech companies were once again main contributors to the surge of the index. Alphabet posted better than expected quarterly results, supporting the surge in share price of 4%. Tesla shares gained 3,5% for the week. The company reported strong vehicle delivery numbers and progress in AI-driven autonomous driving technology. Analysts are noting that 82% of all companies included in the S&P 500 index, that have already reported quarterly results, have beaten the market expectations.
Alongside strong earnings reports, recent advancements in U.S. trade negotiations have contributed to market gains. Earlier this week, President Donald Trump announced a significant trade agreement with Japan, which includes a 15% reciprocal tariff arrangement—an important step toward redefining trade terms between the two nations. Additionally, the U.S. and Indonesia have reportedly reached a framework agreement for a trade deal, reflecting a broader U.S. effort to strengthen and stabilize trade partnerships in Asia. On Friday, President Trump expressed confidence that more trade agreements will be finalized ahead of the August 1 deadline for new tariffs. One of these possible deals involves the European Union. Investors have welcomed these developments, as they help reduce tariff-related uncertainties and ease concerns about escalating trade disputes that could disrupt global supply chains and impact corporate earnings.
The week ahead brings a bunch of important macro data for the U.S. as well as the FOMC meeting, where Fed members will discuss a potential change in interest rates. Markets are currently not expecting that the Fed will make a move at this meeting. Certainly, with JOLTs, NFP, PCE data in combination with the FOMC meeting, the week ahead might bring back some higher volatility in the US equity markets, in case of any unexpected news.
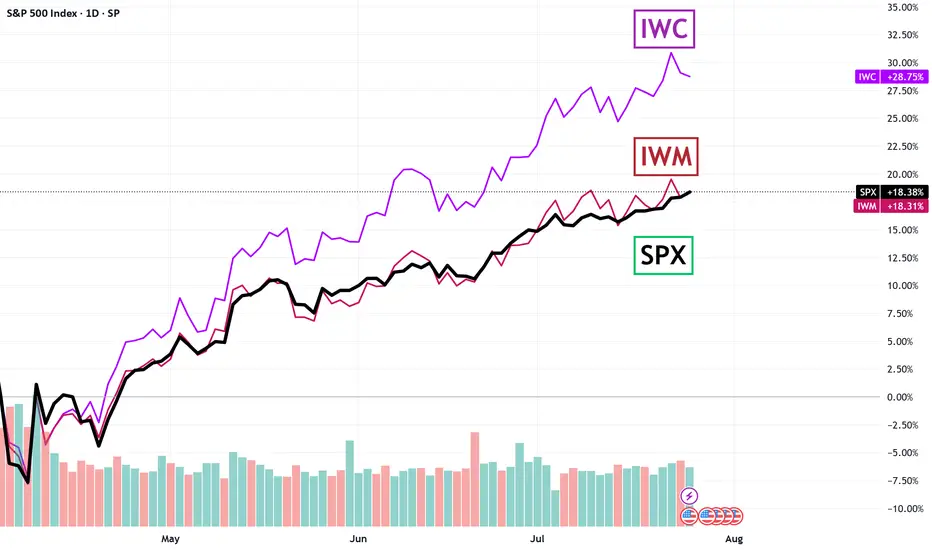
Where is the opportunity now?Small and microcap stocks have that reputation for being "icky" but they are currently looking like anything but that!
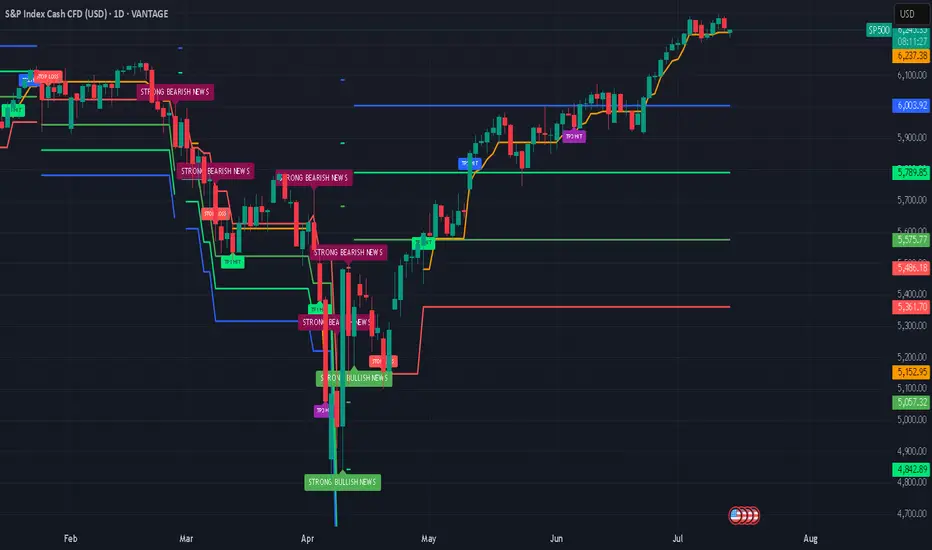
Position builders?📈 This One Daily Signal Ignited a 1,000+ Point Rally
While everyone else panicked during that April drop…
The ELFIEDT RSI + Reversion system quietly printed one word:
UP.
💹 That one green tag at the bottom?
It wasn’t just a bounce.
It was the start of a full-blown trend reversal.
⸻
🟢 Why Long-Term Traders Love This System:
✅ Signals only appear at extreme structure zones
✅ RSI was buried in oversold with clean divergence
✅ Daily timeframe = position-size confidence
✅ No need to overtrade — just buy the dip and hold
✅ Over 1,000+ points and still running…
⸻
This is what we call “High Conviction Buying.”
You didn’t need to time the top.
You just needed to trust a clean, unemotional signal at the bottom.
⸻
💬 DM “SP500 LONG” to see how this could’ve been on your chart
📲 Follow for more real, repeatable swing & position trade setups
🔒 Daily edge. Weekly confirmation. Monthly rewards.
Because sometimes…
📉 The scariest candles…
🔥 Become the most profitable trades.

Third quarter and something we didn’t expectso I’ve been watching the markets for a while and honestly this new admin is doing something that many didn’t saw coming.
it's not even a full year yet, we’re still on Q3, but the impact on the economy is starting to show. what really gets my attention is the tariff collection, it’s been really high and from what I see it’s even generating some kind of surplus in certain areas.
at first I thought this was going to slow down the market or create pressure, but the opposite happened, the stock market has been hitting all time highs, especially in tech and defense sectors.
inflation didn’t spike like people was saying, that calmed down many investors and the flow of money is pretty obvious.
i’m not an expert or nothing but this first months looks like there’s a real direction and the money is moving in a positive way. still need to see how this year closes but if it stays like this, could be one of the strongest starts for a president in a long time.
just wanted to share my thoughts, what you guys think?
Can the S&P 500's Ascent Continue?The S&P 500 recently achieved unprecedented highs, reflecting a multifaceted market surge. This remarkable performance stems primarily from a robust corporate earnings season. A significant majority of S&P 500 companies surpassed earnings expectations, indicating strong underlying financial health. The Communication Services and Information Technology sectors, in particular, demonstrated impressive growth, reinforcing investor confidence in the broader market's strength.
Geopolitical and geostrategic developments have also played a crucial role in bolstering market sentiment. Recent "massive" trade agreements, notably with Japan and a framework deal with Indonesia, have introduced greater predictability and positive economic exchanges. These deals, characterized by reciprocal tariffs and substantial investment commitments, have eased global trade tensions and fostered a more stable international economic environment, directly contributing to market optimism. Ongoing progress in trade discussions with the European Union further supports this positive trend.
Furthermore, resilient macroeconomic indicators underscore the market's upward trajectory. Despite a recent dip in existing home sales, key data points like stable interest rates, decreasing unemployment claims, and a rising manufacturing PMI collectively suggest an enduring economic strength. While technology and high-tech sectors, driven by AI advancements and strong earnings from industry leaders like Alphabet, remain primary growth engines, some segments, such as auto-related chipmakers, face challenges.
The S&P 500's climb is a testament to the powerful confluence of strong corporate performance, favorable geopolitical shifts, and a resilient economic backdrop. While the immediate rally wasn't directly driven by recent cybersecurity events, scientific breakthroughs, or patent analyses, these factors remain critical for long-term market stability and innovation. Investors continue to monitor these evolving dynamics to gauge the sustainability of the current market momentum.
ECB on the agenda: The ECB is on the agenda today. I don't envision a particularly volatile event, although a continuation of the 'limited further cuts narrative' should see the EUR supported, particularly given growing thoughts of a US / EUR trade deal.
All in all, with the S&P still climbing, I continue to hold the view that 'risk on' trades are viable, especially since the announcement of the US / JAPAN trade deal. It's just a case of choosing whether to short the JPY or USD.
In other news, 'soft' SERVICE PMI data from the UK puts a little more pressure on the BOE to cut rates, arguably creating a GBP short 'catalyst' trade for anyone at the charts in that moment.
Also, a relatively hawkish speech from the RBA'S BULLOCK, keeps the AUD high on my 'to long list'.
Wall Street takes off: 5 secret growth engines for #S&P500 Record closes for the indices on July 21 came from a powerful combo: a surge in #Google , a strong start to the earnings season, gains in #Apple (+0.6%), #Amazon (+1.4%), plus #Microsoft, #Meta Platforms, and #Nvidia . This momentum, coupled with market bets on imminent Fed rate cuts and hopes for a softening US-EU tariff conflict, pushed #S&P500 and #NQ100 to new all-time highs.
5 mega drivers that could keep #S&P500 and #NQ100 on the runway through 2025:
• AI capex and monetization: Top cloud providers are ramping up spending in computing clusters and generative AI solutions. The growing lineup of paid AI products (Google Gemini, Microsoft Copilot+ Apps, Amazon Bedrock) is starting to generate significant revenue, boosting profit estimates for the “Magnificent 7.”
• Fed policy easing: If inflation keeps drifting towards 2%, we may see the first rate cut of the cycle between July and September. Historically, every 25 bps drop in 10-year UST yields adds ~2% to the #NQ100 ’s valuation multiple.
• Record buybacks and dividends: #S&P500 companies hold $3.5 trillion in cash. After tax relief on repatriated foreign earnings earlier this year, several megacap boards approved accelerated buybacks — mechanically supporting stock prices.
• Easing tariff risks: Potential trade deals between the US and EU, and the US and Mexico, would remove the threat of 20–50% tariffs priced into valuations, unlocking CAPEX in manufacturing and semiconductors — sectors with a heavy #NQ100 weight.
• Resilient consumers and services: Unemployment remains near 4%, and household spending is growing 2–3% YoY. This supports e-commerce, streaming, and platform advertising — together making up ~40% of #NQ100 and ~28% of #S&P500 .
The current highs of #S&P500 and #NQ100 aren’t a random spike — they result from strong corporate earnings, expectations of Fed cuts, and hopes of trade détente. If even some of these five drivers materialize, the indices have a strong chance to stay elevated and set new records by year-end. FreshForex analysts believe current prices could spark a new rally, with today’s market conditions offering plenty of entry points in both indices and stock CFDs.

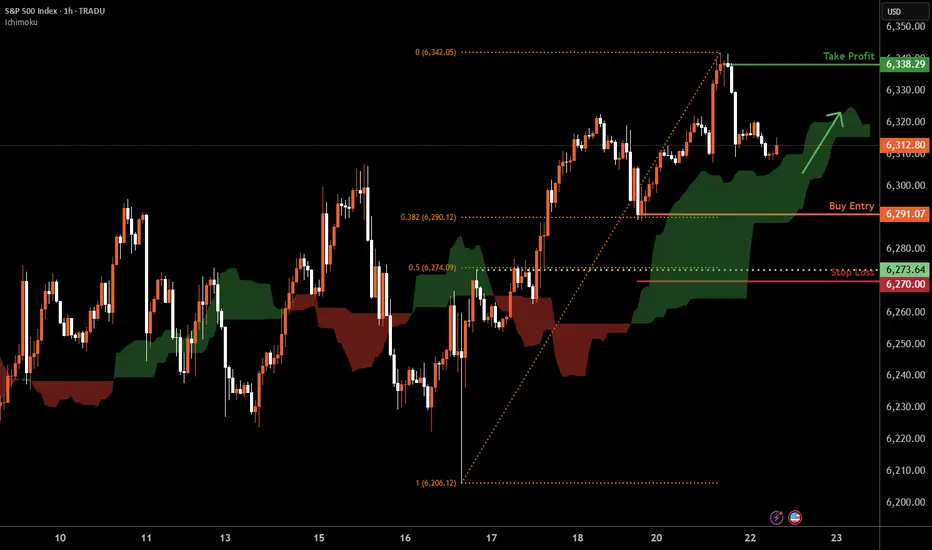
S&P 500 H1 | Swing-low support at 38.2% Fibonacci retracementThe S&P 500 (SPX500) is falling towards a swing-low support and could potentially bounce off this level to climb higher.
Buy entry is at 6,291.07 which is a swing-low support that aligns with the 38.2% Fibonacci retracement.
Stop loss is at 6,270.00 which is a level that lies underneath a pullback support and the 50% Fibonacci retracement.
Take profit is at 6,338.29 which is a swing-high resistance.
High Risk Investment Warning
Trading Forex/CFDs on margin carries a high level of risk and may not be suitable for all investors. Leverage can work against you.
Stratos Markets Limited (tradu.com ):
CFDs are complex instruments and come with a high risk of losing money rapidly due to leverage. 66% of retail investor accounts lose money when trading CFDs with this provider. You should consider whether you understand how CFDs work and whether you can afford to take the high risk of losing your money.
Stratos Europe Ltd (tradu.com ):
CFDs are complex instruments and come with a high risk of losing money rapidly due to leverage. 66% of retail investor accounts lose money when trading CFDs with this provider. You should consider whether you understand how CFDs work and whether you can afford to take the high risk of losing your money.
Stratos Global LLC (tradu.com ):
Losses can exceed deposits.
Please be advised that the information presented on TradingView is provided to Tradu (‘Company’, ‘we’) by a third-party provider (‘TFA Global Pte Ltd’). Please be reminded that you are solely responsible for the trading decisions on your account. There is a very high degree of risk involved in trading. Any information and/or content is intended entirely for research, educational and informational purposes only and does not constitute investment or consultation advice or investment strategy. The information is not tailored to the investment needs of any specific person and therefore does not involve a consideration of any of the investment objectives, financial situation or needs of any viewer that may receive it. Kindly also note that past performance is not a reliable indicator of future results. Actual results may differ materially from those anticipated in forward-looking or past performance statements. We assume no liability as to the accuracy or completeness of any of the information and/or content provided herein and the Company cannot be held responsible for any omission, mistake nor for any loss or damage including without limitation to any loss of profit which may arise from reliance on any information supplied by TFA Global Pte Ltd.
The speaker(s) is neither an employee, agent nor representative of Tradu and is therefore acting independently. The opinions given are their own, constitute general market commentary, and do not constitute the opinion or advice of Tradu or any form of personal or investment advice. Tradu neither endorses nor guarantees offerings of third-party speakers, nor is Tradu responsible for the content, veracity or opinions of third-party speakers, presenters or participants.
LAST WEEK TO GET BIDSSo as earnings push higher, it is expected that indices will try to push as there are no major news events however as this overbought Sp500 is due for correction if it taps the 6330 threshold to get to 6400.

Weekly Review: The S&P and NASDAQ once again hit all time highs during the week starting Monday 14 July. Which is a sign of confidence despite the ongoing external threats (tariffs / Middle East). I've noticed the current earnings season wasn't approached with as much trepidation as recent earnings seasons have been. Of course, that could come crashing down as companies continue to report over the next couple of weeks.
Once again, the currencies didn't quite react in accordance with the overall 'positive risk environment'. As each of the 'risk off currencies' offers their own separate challenges:
Ever since the recent NFP data, the USD had been strong, the FED continues to maintain a view for a 'slow pace of rate cuts' and US data backs up that view. Particularly this week's retail sales data, even CPI, although relatively benign, wasn't soft enough to warrant a 'FED pivot' towards a more dovish stance. The USD spent most of the week on the front foot, although the 'higher for longer' narrative was put to the test when the president once again offered his views on Mr Powell. Also FED board member WALLER chipped in with some dovish comments. Currently, it's up in the air as to how many more rate cut the FED will implement before year end (if any). The narrative at the July FOMC meeting could go a long way to determine the dollar's direction for the rest of the summer. But ultimately, it'll be the data that decides.
Recently, I've been encouraged by the re-emergence of JPY weakness. This past week, I put any periods of JPY strength down to profit taking before this weekends election. I need to do some reading regarding the implications of the result. But I'm 'hopeful' that over the coming weeks and months the 'old fashioned, JPY short 'risk on trade', will be prevalent.
The CHF continues to have a mind of it's own. It could be tracking EUR strength, it could be the article I read about gold, it could be SNB intervention, It could be random, or something I'm not aware of. Ultimately, until I'm comfortable the CHF is back in correlation with the risk environment, my preference is to short the JPY instead.
In other news, disappointing AUD data took the shine off the hawkish RBA. But I still view the AUD as a good 'risk on' long.
I'll begin the new week with an open mind. My preference remains for 'risk on' trades. But it's a case of keeping up to date with all of the narratives, if momentum aligns with logic and a narrative. And you feel comfortable with a stop loss and profit target, place the trade. But, be aware that the narrative the market is focused on can change from day to day.
On a personal note, it was a week of two trades. A post US CPI 'risk on' AUD JPY long. The trade stopped out. And as discussed during the week, it was one of those situations where if I would have been at the charts and hour later, I would have traded a different pair. That's life.
The second trade was AUD USD long. Post WALLER'S dovish comments, I felt the USD short momentum could continue. On my account the trade hit profit by the skin of its teeth before reversing. Again, that's life. Sometimes you get good luck, sometimes you get bad luck. I feel it's important to acknowledge good luck, as we often only focus on the bad luck we have.
The USD is finely poised and I'm intrigued to see where the data and rate cut narrative takes it over the coming weeks.
Results:
Trade 1: AUD JPY -1
Trade 2: AUD USD +1.2
Total = +0.2%

Miss This Watchlist, Miss Next Week’s OpportunitiesHey friends,it’s Skeptic 🩵 hope you’re having a great weekend!I know it’s the weekend, so a lot of you are probably chilling away from the charts, but for some, trading’s such an addiction that even weekends can’t keep you away. In this video, I’m gonna break down my weekly watchlist for you. Knowing it will help you miss fewer good opportunities, avoid FOMO, and have a plan ready for different scenarios and events.
Don’t forget money management , and stay clear of FOMO. & if it helped smash that boost bottom and follow for more !


SPX500 LongThere is a lot of support at this level
There is a shark pattern on M15 and M30
All timeframes are oversold and there are multiple bottoms with divergence
This trade is with the trend
25 Pip stop loss

Bulls and Bears zone for 07-15-2025ETH session market is trading higher and expected to Open gap up.
Would traders be able to keep that momentum going rest of the RTH session.
Level to watch: 6328 --- 6330
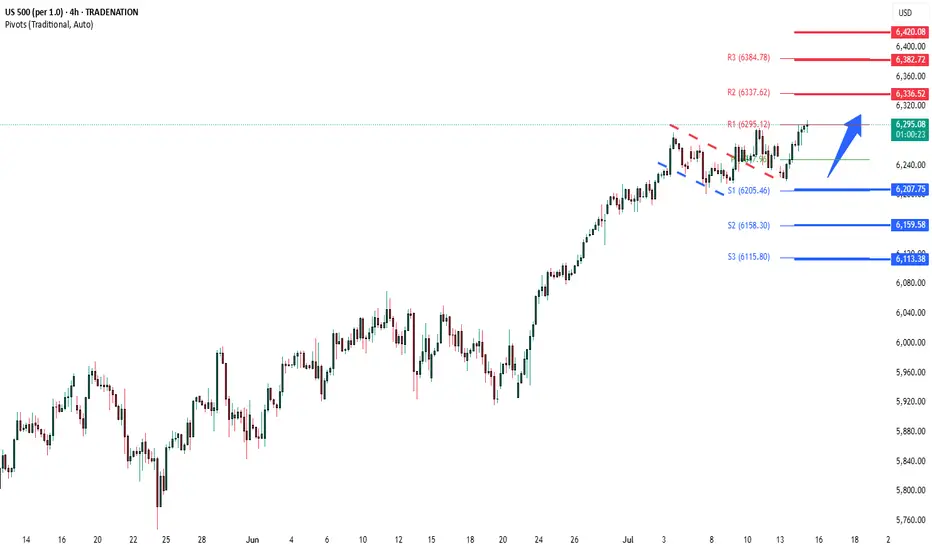
S&P500 Bullish breakout supported at 6207Trump’s $3.4 Trillion Tax Plan
Favors wealthy investors: Tax burden shifts based on how you earn, not how much.
Winners: Business owners, investors, high-income earners.
Losers: Immigrants, elite universities.
Trade Tensions
EU Tariffs: Brussels targets $72B in US goods (e.g., Boeing, cars, bourbon) in response to Trump’s tariff threats.
Impact: Risk to transatlantic trade; US open to talks.
US-China Tech Relations
Nvidia: Resumes H20 AI chip sales to China after US approval—boosted chip stocks.
Trump: To announce $70B in AI & energy investments today in Pennsylvania.
Trend: Signs of easing tensions between US and China.
Earnings Focus: Big US Banks
Q2 results (JPM, Citi, WFC, BNY Mellon, BlackRock) will highlight:
Net interest income: How rate levels affect profits
Loan growth & credit quality: Signs of lending strength or weakness
Capital markets activity: Trading & investment banking trends
Key Support and Resistance Levels
Resistance Level 1: 6335
Resistance Level 2: 6380
Resistance Level 3: 6420
Support Level 1: 6207
Support Level 2: 6160
Support Level 3: 6115
This communication is for informational purposes only and should not be viewed as any form of recommendation as to a particular course of action or as investment advice. It is not intended as an offer or solicitation for the purchase or sale of any financial instrument or as an official confirmation of any transaction. Opinions, estimates and assumptions expressed herein are made as of the date of this communication and are subject to change without notice. This communication has been prepared based upon information, including market prices, data and other information, believed to be reliable; however, Trade Nation does not warrant its completeness or accuracy. All market prices and market data contained in or attached to this communication are indicative and subject to change without notice.
S&P 500: Defying Tariff Headwinds, Breaking RecordsThe S&P 500 has staged a remarkable rally in 2025, shattering all-time highs and capturing global attention. This surge has unfolded despite the negative economic overhang of renewed tariff threats and ongoing trade tensions, raising critical questions for investors: How did the market overcome such headwinds, and what lies ahead for both the short and long term?
The Rally Against the Odds
Tariff Turbulence: Earlier this year, President Trump announced sweeping new tariffs, sparking fears of supply chain disruptions and higher costs for American companies. Historically, such moves have triggered volatility and corrections.
Market Resilience: Despite these concerns, the S&P 500 not only recovered losses from the spring but surged to new record highs, with the index climbing over 23% since April’s lows. Major tech companies, especially those leading in AI and innovation, have been at the forefront of this advance.
Investor Sentiment: The rally has been fueled by optimism around potential Federal Reserve rate cuts, robust corporate earnings, and expectations of long-term economic growth—even as the immediate impact of tariffs remains uncertain.
Short-Term Correction: A Healthy Pause?
While the long-term outlook remains bullish, several indicators suggest the market may be due for a short-term correction:
Narrow Market Breadth: The current rally has been driven by a handful of mega-cap stocks, leaving the median S&P 500 stock well below its own 52-week high. Historically, such narrow leadership often precedes periods of consolidation or pullbacks.
Valuation Concerns: Stock valuations are at elevated levels, and some analysts warn that earnings growth could slow as companies adapt to higher input costs and shifting trade policies.
Correction Forecasts: Some strategists predict the S&P 500 could correct to around 5,250 by the third quarter of 2025, citing factors like slowing consumer spending and persistent policy uncertainty.
Long-Term Outlook: Higher Highs Ahead
Despite the potential for near-term volatility, the long-term trajectory for the S&P 500 remains positive:
Fed Policy Tailwinds: Anticipated rate cuts and lower bond yields are expected to provide further support for equities, encouraging risk-taking and higher valuations.
Corporate Adaptation: Companies are actively offsetting tariff impacts through cost savings, supply chain adjustments, and strategic pricing.
Growth Sectors: Innovation in technology, productivity gains, and deregulation are setting the stage for sustained profit growth, especially in sectors like AI, robotics, and defense.
Key Takeaways for Investors
Stay Disciplined: While a short-term correction is possible, history shows that markets often rebound strongly after periods of volatility.
Diversify Exposure: With market gains concentrated in a few names, diversification and active stock selection are more important than ever.
Focus on Fundamentals: Long-term investors should look beyond headlines and focus on companies with resilient earnings and adaptive business models.
The S&P 500’s ability to break records in the face of tariff headwinds is a testament to the underlying strength and adaptability of the U.S. economy. While short-term bumps are likely, the path ahead still points toward new highs for those with patience and perspective.
This article is for informational purposes only and does not constitute investment advice. Always consult with a financial advisor before making investment decisions.
#spx500 #stockmarket #analysis #economy #us #nasdaq #fed #bonds #rates #trading
S&P500 Slips Ahead of CPI & Earnings SeasonEquities began the week under pressure, with the S&P 500 dropping 0.5%, slipping below the 6,230-resistance area. Although the Fed minutes released last week indicate that most members are open to cutting rates this year, inflation data and second-quarter earnings could change that trajectory.
Upcoming Events to Watch:
• CPI Release (Tuesday 14:30 SAST): A cooler-than-expected print would support a breakout in risk assets. A hot reading could shift expectations toward policy tightening, weighing on equities.
• Q2 Earnings Season: Major banks including JPMorgan Chase, Wells Fargo, and Citigroup will report this week. Strong earnings may cushion the market, while any weakness could exacerbate volatility.
S&P500 Technical View:
• Immediate Resistance: 6,230
• Potential Upside: A cooler CPI could see the index rally toward 6,290.
• Support Levels: Should inflation surprise to the upside, the index may slide to 6,190, or even 6,150 in extended selling.
