Bearish drop?S&P500 is reacting off the resistance level which is a pullback resistance and could drop from this level too ur take profit.
Entry: 6,237.85
Why we like it:
There is a pullback resistance level.
Stop loss: 6,268.46
Why we like it:
There is a pullback resistance level.
Take profit: 6,187.51
Why we like it:
There is a pullback support that is slightly below the 61.8% Fibonacci retracement.
Enjoying your TradingView experience? Review us!
Please be advised that the information presented on TradingView is provided to Vantage (‘Vantage Global Limited’, ‘we’) by a third-party provider (‘Everest Fortune Group’). Please be reminded that you are solely responsible for the trading decisions on your account. There is a very high degree of risk involved in trading. Any information and/or content is intended entirely for research, educational and informational purposes only and does not constitute investment or consultation advice or investment strategy. The information is not tailored to the investment needs of any specific person and therefore does not involve a consideration of any of the investment objectives, financial situation or needs of any viewer that may receive it. Kindly also note that past performance is not a reliable indicator of future results. Actual results may differ materially from those anticipated in forward-looking or past performance statements. We assume no liability as to the accuracy or completeness of any of the information and/or content provided herein and the Company cannot be held responsible for any omission, mistake nor for any loss or damage including without limitation to any loss of profit which may arise from reliance on any information supplied by Everest Fortune Group.
SPCUSD trade ideas

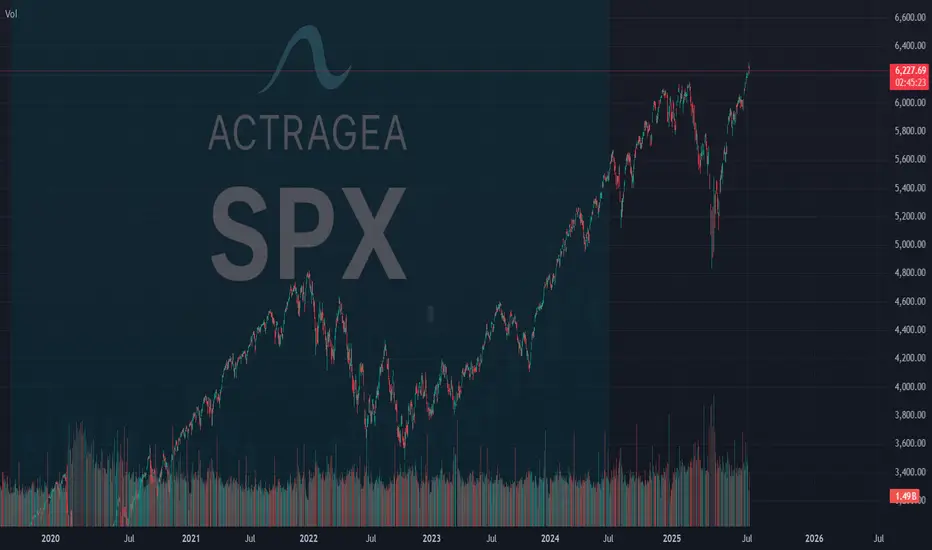
SPX: 75% chance Multi-Timeframe Reversal to 5,775-6,103 Zone **SPX MULTI-TIMEFRAME CYCLE CONFLUENCE ANALYSIS - SUPER VERSION**
**CURRENT SITUATION: July 7, 2025 - Price: 6,238**
Based on our quantitative cycle analysis across 4 timeframes, applying **ACTRAGEA hierarchical dominance principles** where ITM >> MTY >> TCY >> TYL.
---
## **CYCLE HIERARCHY STATUS**
| **Timeframe** | **Cycle Phase** | **Status** | **Hierarchy** | **Key Level** |
|---------------|-----------------|------------|---------------|---------------|
| **ITM (1D)** | Phase 2 | FLAT | **DOMINANT** | Max: 6,284.65 **awaiting confirmation** |
| **TCY (1H)** | Phase 2 | FLAT | Secondary | Max: 6,284.65 **awaiting confirmation** |
| **MTY (270m)** | Phase 1 | LONG (+1.64%) | Subordinate | Seeking max: 6,359 |
| **TYL (15m)** | Phase 2 | LONG (+0.11%) | Subordinate | Max: 6,242.7 **awaiting confirmation** |
---
## **PRIMARY SCENARIO (Probability: 75%)**
**DIRECTIONAL BIAS:** **Multi-timeframe reversal upon ITM maximum confirmation**
**RATIONALE:**
- **ITM timing**: 0 bars remaining from 50° percentile window → Maximum at 6,284.65 **awaiting confirmation** → Statistical pressure for confirmation increases daily
- **Hierarchical cascade**: **When ITM confirms maximum** → all subordinate cycles transition into Phase 3 (minimum search)
- **Current LONG positions** (MTY +1.64%, TYL +0.11%) face hierarchical override risk upon ITM maximum confirmation. Subordinate cycles will align regardless of current profitability.
**STATISTICAL PRICE LEVELS (50° Percentile):**
- **ITM**: 5,775.84
- **TCY**: 6,103.58
- **MTY**: 5,996.35
- **TYL**: 6,170.98
**STATISTICAL TIME WINDOWS (50° Percentile):**
- **ITM**: 65 bars | **TCY**: 58 bars | **MTY**: 62 bars | **TYL**: 81 bars
**EXTREME SCENARIOS (20° Percentile):**
- **ITM**: 5,420.71 | **TCY**: 5,934.73 | **MTY**: 5,728.16 | **TYL**: 6,084.71
---
## **⚠️ ALTERNATIVE SCENARIO (Probability: 25%)**
**DIRECTIONAL BIAS:** ITM extension toward 80° percentile before maximum confirmation
**CONDITION:** ITM exceeds statistical time boundaries, allowing subordinate cycles temporary independence
---
## **CRITICAL DECISION POINT**
**Confirmation Trigger:** ITM maximum validation at 6,284.65 → Phase 2→3 transition → Activation timeframe: Within 1-3 trading sessions (statistical pressure)
**Hierarchy Activation:** Immediate subordinate cycle alignment into Phase 3 upon ITM confirmation
**Invalidation:** Sustained break above 6,285 (negates ITM maximum thesis)
---
## ** PROBABILITY FOUNDATION**
**75% probability derived from:**
- ITM expired timing creating high statistical pressure for confirmation
- Historical dominance patterns (85%+ subordination rate upon ITM phase changes)
- Dual Phase 2 alignment (ITM + TCY at identical maximum level awaiting confirmation)
---
## **ACTRAGEA METHODOLOGY FOUNDATION**
Our **quantitative cycle framework** operates on **hierarchical dominance principles** where longer timeframes command shorter ones. Statistical levels represent **50° percentile probabilities**, not certainties. The **ITM critical juncture** at 6,284.65 creates high-probability setup for **coordinated multi-timeframe reversal initiation**.
**Performance Context:** Systems demonstrating 65.71% to 82.86% statistical reliability across timeframes.
---
*Analysis based on ACTRAGEA hierarchical cycle principles and statistical percentile distributions. All levels represent probabilities, not guaranteed outcomes.*
Logarithmic channelsThe price has reached a support area at the bottom of the long-term logarithmic channel. If this area will not hold the price I see a possible spike to 5330 level which is 1.618 retracement of March 13 bottom - March 25 top. The price did the same retracement in October 2023. Pay attention that we have 1d positive divergence forming on RSI. We are bottoming, a crash is unlikely right now. The reversal will most likely happen this week.

S&P500 Strong Buy Signal flashed for the 3rd time in 2 years!The S&500 index (SPX) is comfortably trading above its previous All Time High (ATH) and shows no signs of stopping here. Coming off a 1D MA50/ 100 Bullish Cross, we expect the 1D MA50 (blue trend-line) to turn now into the first long-term Support going towards the end of the year.
The last 1D MA50/ 100 Bullish Cross (December 15 2023) was nothing but a bullish continuation signal, which extended the uptrend all the way to the 2.0 Fibonacci extension, before a pull-back test of the 1D MA100 (green trend-line) again.
The 1W RSI is now on the same level (63.30) it was then. In fact it is also on the same level it was on June 05 2023, which was another such bullish continuation signal that peaked on the 2.0 Fib ext.
This suggests that we have a rare long-term Buy Signal in our hands, only the 3rd time in 2 years that has emerged. Based on that, we should be expecting to see 7600 as the next Target before it hits the 2.0 Fib ext and pulls back to the 1D MA100 again and there is certainly enough time to do this by the end of the year, assuming the macroeconomic environment favors (trade deals, potential Fed Rate cuts etc).
-------------------------------------------------------------------------------
** Please LIKE 👍, FOLLOW ✅, SHARE 🙌 and COMMENT ✍ if you enjoy this idea! Also share your ideas and charts in the comments section below! This is best way to keep it relevant, support us, keep the content here free and allow the idea to reach as many people as possible. **
-------------------------------------------------------------------------------
Disclosure: I am part of Trade Nation's Influencer program and receive a monthly fee for using their TradingView charts in my analysis.
💸💸💸💸💸💸
👇 👇 👇 👇 👇 👇

S&P Bullish Flag developing supported at 6180Trump Softens Tariff Stance:
Trump said the Aug. 1 tariff deadline isn’t firm, easing fears of an immediate trade war. US equity futures rose on hopes for more negotiation. Japan criticized the planned 25% tariff, calling it “truly regrettable.”
Texas Floods – Trump to Visit:
Over 100 people died in the Texas floods, including 27 children. Trump said he’ll visit the state Friday to support recovery efforts. The news may draw attention to infrastructure and emergency response spending.
Apple Loses AI Chief to Meta:
Apple’s AI lead, Ruoming Pang, is leaving for Meta’s new AI unit. This raises more questions about Apple’s AI strategy, while Meta’s aggressive hiring supports its tech edge.
US Resumes Ukraine Weapons Aid:
Biden will restart weapons shipments to Ukraine, reversing a previous pause. This could support defense stocks, though broader market impact is limited for now.
Takeaway:
Markets welcomed Trump’s trade flexibility, lifting sentiment. Watch tech and industrials as traders react to shifts in AI leadership and trade policy.
Key Support and Resistance Levels
Resistance Level 1: 6290
Resistance Level 2: 6340
Resistance Level 3: 6400
Support Level 1: 6180
Support Level 2: 6120
Support Level 3: 6065
This communication is for informational purposes only and should not be viewed as any form of recommendation as to a particular course of action or as investment advice. It is not intended as an offer or solicitation for the purchase or sale of any financial instrument or as an official confirmation of any transaction. Opinions, estimates and assumptions expressed herein are made as of the date of this communication and are subject to change without notice. This communication has been prepared based upon information, including market prices, data and other information, believed to be reliable; however, Trade Nation does not warrant its completeness or accuracy. All market prices and market data contained in or attached to this communication are indicative and subject to change without notice.

SHORT ON SPY (SPX/USD)SPY has a double top and is currently pulling back to a supply zone.
I expect spy to drop to the next demand level or FVG to the downside.
This is a sell limit order. Waiting for price to reach the supply area before taking the sell.

SPX500 Range-Bound Between 6223–6246 |Breakout Will Define TrendSPX500 – Technical & Fundamental Outlook
The SPX500 is currently trading within a narrow consolidation zone between 6223 and 6246.
A 1H or 4H candle close below 6223 would confirm a bearish breakout, with downside targets at 6191 and 6143.
Conversely, a 1H close above 6246 would signal bullish continuation, potentially driving the price toward the next resistance at 6287, followed by 6305.
Support: 6223 / 6191 / 6143
Resistance: 6287 / 6305
Fundamental Note:
The tariff situation remains a major driver.
Successful negotiations would likely boost bullish sentiment across indices.
Lack of progress may trigger renewed bearish momentum.

SPX may have retracement soon, taking profits timeAs if timing cannot be more coincidental, Trump has announced slapping 25% tariff on Japan and South Korea. This sends chills back to the stock market as the SPX has recently climbed and exceeded the previous high of 6148 price level.
This week, I expect the SPX to retrace to the various levels I indicated on the chart. Profit target 3 and 4 looks less likely but not impossible. 1 & 2 are more likely and that again would be a good entry level to accumulate.
No, I am not shorting as I invest in the VOO ETF for long term so retracement is a good opportunity to long.

06/30 Weekly Gamma Exposure Outlook🧠 SPX Weekly Outlook — Gamma Breakout + Short Week Setup
The bulls finally broke through after weeks of painful grinding — and they did so with force.
📈 Thursday & Friday brought a textbook gamma squeeze as SPX sliced through the long-standing 6100 call wall , triggering sharp upside acceleration.
We are now firmly in positive Net GEX territory.
🔺 Entire GEX structure has shifted higher.
🎯 New squeeze zone at 6225 , with major call resistance near 6200 .
🔍 What Just Happened?
📊 The 6060–6120 zone acted as a tough resistance range for weeks — until last week’s breakout.
💥 Put skew collapsed , suggesting downside hedges are being unwound.
📉 VIX and IV keep dropping , confirming a shift toward lower-volatility environment .
🧲 Strong Net GEX across expiries created sustained upward dealer pressure → we’re in long gamma mode .
✅ Bullish Bias — But Stay Tactical
We're in a bullish gamma regime , so dips are likely to be bought.
Key pullback zone to watch: 6125–6060 .
🛠️ Strategy Ideas:
• Wait for a 6060–6125 retest before re-entering longs
• Use shorter-DTE bull put spreads or 0DTE gamma scalps above 6130+
• Scale out or trim risk near 6200–6225
⚠️ Risks to Watch
We’re overextended short-term.
🚨 Losing 6130–6125 could spark a quick flush to 6050 .
Bearish signals to monitor:
• IV spike or renewed put buying
• Loss of 6100 = no-man’s land without confirmation
• Consider short-term debit put spreads if breakdown confirms
🗓️ Short Trading Week Note
🇺🇸 U.S. markets closed Friday, July 5 for Independence Day.
This compresses flows into 4 sessions. Expect:
📌 Early week dealer hedging
📌 Possible positioning unwind on Thursday
💡 Weekly Trade Idea — Structure in Place
💼 Setup:
• Put Butterfly below spot
• 3x Call Diagonal Spreads above spot (5pt wide)
• Slight net negative delta , 11 DTE
🎯 Why it works:
• Leverages IV backwardation
• Profits from time decay
• Favors a stable or modestly bullish week
• Takes advantage of horizontal skew (July 11 vs July 14)
💰 Profit Target: 10–20% return on ~$1,730 risk.
Take profits before time decay kills the center valley — don’t overstay. 🏃💨
📌 Final Thoughts:
The 6100 breakout was technically & gamma-structurally significant ,
but big moves often retest before continuing.
Let price breathe.
Stay aligned with gamma exposure profile. 🔄

$100 to $1k to $10k to $100k: TRADING MASTERCLASSHow I approach trading:
Trading is a mostly psychological endeavor
You will not WIN LONGTERM in trading until you WIN YOURSELF (i.e. master your emotions)
I use Technical Analysis to help me determine overall Market Direction and Entry/Exit points
I do not use ANY fundamental analysis in my trading
I use Elliott Wave Theory to understand MARKET STRUCTURE
I use a combination of Anchored Volume Weighted Average Price (AVWAP), Fixed Range Volume Point of Control (VPOC) and custom coded Momentum indicators to pinpoint Entry/Exit points
Risk Management:
I will generally aim for 2%-5% percent stop loss but price structure will dictate as well
Position sizing will be fluid
Targets will be fluid but will generally target key Fib Extensions, VWAPs or VPOCs..or a combination of all of the above
Starting Account Size:
$100
Goal:
Grow a small $100 account to $1k then $10k then $100k
Every trade will be public...wins and losses
I will be looking to make my first trade(s) shortly and will show Entry level, Stop Loss and Target
NONE OF THIS CONSTITUTES FINANCIAL ADVICE

Decade-Long Uptrend Holds Strong – SPX Hits Fresh HighsS&P 500 Just Hit a New All-Time High (ATH) 🚀
The index has been in a strong uptrend for over a decade, consistently printing higher highs (HH) and higher lows (HL).
Every major resistance level has flipped into support, classic bull market structure.
Even during corrections, the 33 EMA and 100 EMA have acted like dynamic support zones.
Now that SPX has cleared its previous ATH, the structure remains intact, unless a strong breakdown occurs, momentum is still with the bulls.

S&P to go down a bit....good time to hop on UVIX!Saw this from a mile away. We are now at the cross hair between high tariffs and the tail-end of a week long rally that was mostly based on hot air. What's next? Gravity will prevail.
The VIX has been at super low levels historically. UVIX is a nice 2X! Jumped like 4% already today and there's way more upside. Best of luck and always do your own due diligence.

SPX500 Bearish Breakout!
HI,Traders !
#SPX500 was trading along
The rising support line but
Now we are seeing a bearish
Breakout so we are bearish
Biased and we will be expecting
A further bearish move down !
Comment and subscribe to help us grow !

SPX500 Holding Bullish Structure – Eyes on 6287 BreakoutSPX500
The price maintains bullish momentum as long as it remains above 6225 and 6246.
Currently, the market is approaching the 6287 resistance level. A confirmed 4H candle close above 6287 is required to validate continuation of the bullish trend toward 6325.
However, a rejection from 6287 may trigger a short-term bearish correction, with potential pullbacks toward 6246 and 6225.
A sustained break below 6225 would shift the momentum to the downside, targeting the 6143 support level.
Pivot Level: 6264
Resistance: 6287 – 6325
Support: 6246 – 6225 – 6143

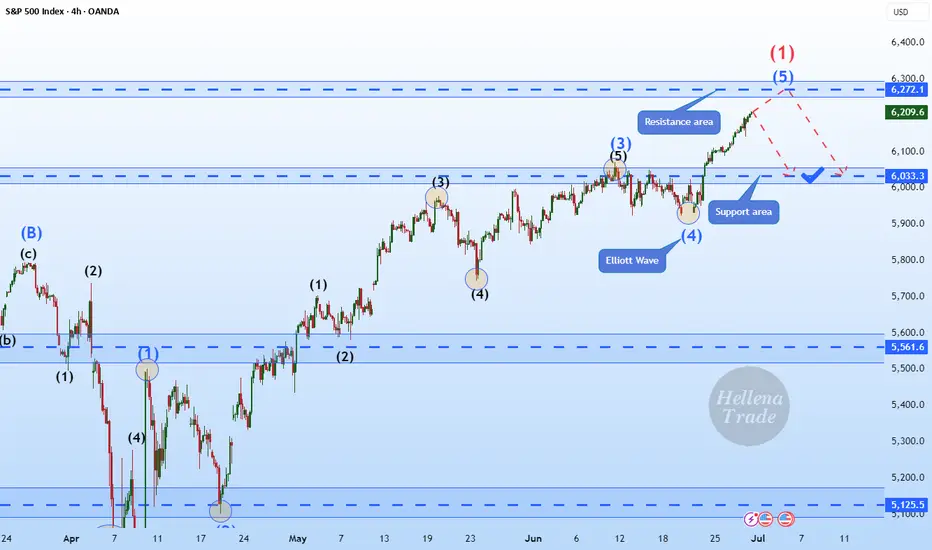
Hellena | SPX500 (4H): SHORT to support area of 6033.Colleagues, I assume that wave “1” completes the upward movement and somewhere around here a major correction ‘2’ should begin, which will consist of waves “ABC” and may continue to the level of 5700. But for now, I think we need to focus on the nearest targets.
I see the support area of 6033 as the first target.
Manage your capital correctly and competently! Only enter trades based on reliable patterns!
Bullish continuation?S&P500 (US500) is falling towards the pivot which acts as a pullback support and could bounce to the 1st resistance, which aligns with the 161.8% Fibonacci extension.
Pivot: 6,127.80
1st Support: 5,785.00
1st Resistance: 6,428.64
Risk Warning:
Trading Forex and CFDs carries a high level of risk to your capital and you should only trade with money you can afford to lose. Trading Forex and CFDs may not be suitable for all investors, so please ensure that you fully understand the risks involved and seek independent advice if necessary.
Disclaimer:
The above opinions given constitute general market commentary, and do not constitute the opinion or advice of IC Markets or any form of personal or investment advice.
Any opinions, news, research, analyses, prices, other information, or links to third-party sites contained on this website are provided on an "as-is" basis, are intended only to be informative, is not an advice nor a recommendation, nor research, or a record of our trading prices, or an offer of, or solicitation for a transaction in any financial instrument and thus should not be treated as such. The information provided does not involve any specific investment objectives, financial situation and needs of any specific person who may receive it. Please be aware, that past performance is not a reliable indicator of future performance and/or results. Past Performance or Forward-looking scenarios based upon the reasonable beliefs of the third-party provider are not a guarantee of future performance. Actual results may differ materially from those anticipated in forward-looking or past performance statements. IC Markets makes no representation or warranty and assumes no liability as to the accuracy or completeness of the information provided, nor any loss arising from any investment based on a recommendation, forecast or any information supplied by any third-party.

Little more upside for SPX500USDHi traders,
Last week SPX500USD went higher then expected (wavecount updated).
If this is correct, then next week we could see a little more upside for this pair.
Let's see what the market does and react.
Trade idea: Wait for price come into the Daily bullish FVG's to trade longs again. At the moment price is too high to trade.
If you want to learn more about trading FVG's & liquidity sweeps with Wave analysis, then please make sure to follow me.
This shared post is only my point of view on what could be the next move in this pair based on my technical analysis.
Don't be emotional, just trade your plan!
Eduwave

S&P 500 and the Elliott Wave TheoryAnalysis shows that the Wave 3(Black) correction is a Flat because Wave 2(Black) was a Zigzag. From the ending of Wave 3(Black), we see a shallow Wave A(Blue) forming. This is our first Wave of the 3 move correction. From A(Blue), another 3 wave move MUST occur and must go beyond the ending of Wave 3(Black) as seen. The correction of Wave A(Blue) is marked by an unfolding 3 wave move shown in Green. Waves A and B are formed after Wave A(Blue) completes. For the last 'leg' of the 3 Wave correction, we find a 5 Wave move shown in Red and this should contain all properties of a normal 5 wave move. Wave 1(Red) is followed by a Zigzag correction and we should expect a Flat correction at Wave 3(Red). Indeed a Flat is formed and is highlighted in Purple. Wave 4(Red) is complete. This sets in motion a last wave that upon completion would be the end of Wave C(Green) hence the end of Wave B(Blue) and would trigger the start of Wave 4(Black). Follow for breakdown of the same chart in the Daily time frame.

SPX Expansion with Historical DataGood morning everyone!
This week I wanted to elaborate more on my previous idea of SPX with the historical data that led to this analysis. This is almost all fundamental analysis adding in the retracement percentages which can also be evaluated through some technical instruments.
Unemployment rate is currently at 4.1%, with inflation at 2.4%. Based on the data, it is evident the market is currently in an expansion period which is why the narrative that we will see 2 interest rate drops by the end of year continues to diminish. I think we will probably see 1 before the year ends and that would just fuel the market and gain momentum to the upside.
If we were to measure the expansion of SPX going back to the 2000's, we get an extension of at least 75%. If we were to extend 75% based on the previous swing high (6,147) we could see future SPX price at 8,500. Now, do your own research, but the data is here. I expect the market to possibly retest previous high, but if you did not enter during the dip, no worries. There is still plenty of upside potential and better late than never.
Remember... CASH FLOW IS KING!
Avoid all the noise and distractions. The job of many platforms out there is to have something to put out for the public EVERYDAY! A good amount of that is noise. Look for macroeconomic news and let that be your indicator.
Historical Data:
(1) .com Bubble (2000 - 2002) We had a 50% drop of SPX. This lasted for almost 2 years before recovery.
(2) Housing Market (2007 - 2009) The SPX dropped 57% due to the collapse of subprime lenders collapsing. Housing prices decline drastically leaving people with high mortgage payments than what their homes are actually worth leading to a wave of foreclosures.
(3) Covid (2020) This was a global event with government mandated shutdowns causing the entire financial markets to come to a halt. Many business closures that led to jobs loss with an unemployment rate of approximately 15%.
(4) Inflation & Rate Hikes (2022) When Covid happened, upon recovery market expanded way too fast causing inflation to rise and the Feds to increase interest rates to slow down the economy.
(5) Tariffs (2025) Will stay away from politics on this one, however, a rebalancing of trade has taken place with some countries still working on tariff deals with the U.S. This has caused huge uncertainty for companies and corporation. VIX (fear index) reached 60.13.
Hope you enjoyed this post. Have a great rest of your week, don't forget to like and follow and Happy Trading!

Gold Bullish for 2 months followed by 3 months of Bearish?An interesting pattern developed on Gold for the monthly that could indicate 2 months of Bullish order flow to 3600 - 3800 area followed by 3 months of bearishness to 3000 - 3100 area.

Let’s talk about technical analysis & stops.Technical analysis is not your decision-making process — it’s a tool to help you structure better trading decisions by studying past price movements to anticipate likely future moves.
👉 Every time you look at a chart, you should decide:
✅ Do I want to trade at all?
✅ What’s my entry?
✅ Where’s my stop (when does my thesis fail)?
✅ What’s my target (where will I take profits)?
________________________________________
🛑 Where to put your stop?
Take the S&P 500 daily chart. It’s been trending up strongly. Many traders use an exponential moving average (EMA) as a dynamic stop.
But:
• A 9 EMA often stops you out too early on strong trends.
• Adjusting to a 15 or 16 EMA could keep you in the trade longer, letting your winners run.
In tools like TradingView, you can visually adjust the EMA and see in real time how it would have kept you in or taken you out.
________________________________________
💡 Key takeaway:
When price closes below your EMA stop — that’s your signal to exit and lock in profits.
Use TA to structure your trades, not just spot pretty patterns.
________________________________________
💬 What’s your favourite method for setting stops?
Disclaimer:
The information posted on Trading View is for informative purposes and is not intended to constitute advice in any form, including but not limited to investment, accounting, tax, legal or regulatory advice. The information therefore has no regard to the specific investment objectives, financial situation or particular needs of any specific recipient. Opinions expressed are our current opinions as of the date appearing on Trading View only. All illustrations, forecasts or hypothetical data are for illustrative purposes only. The Society of Technical Analysts Ltd does not make representation that the information provided is appropriate for use in all jurisdictions or by all Investors or other potential Investors. Parties are therefore responsible for compliance with applicable local laws and regulations. The Society of Technical Analysts will not be held liable for any loss or damage resulting directly or indirectly from the use of any information on this site.

SPX: highly optimisticThe US market celebrated on Friday the US Independence Day, after highly optimistic last two weeks. Almost every day, the S&P 500 was reaching new all time highest levels, finishing Thursday trading session at 6.279. At this moment this is officially treated as a new ATH for the index. The optimism was supported by better than expected US jobs data posted during the previous week. The NFP added 147K new jobs in June, which beated market expectations. The strong US payrolls reinforced market confidence despite concerns over trade tariffs. With inflation remaining sticky and solid jobs growth, markets have increased expectations of the Fed's rate cut in September. Currently, there is relatively low odds that the next rate cut might occur at the Julys FOMC meeting.
Tech companies were again those who led the index to the upside. The leader was for one more time Nvidia, with a weekly surge of 9,7%. AMZN was traded higher by 6,3%, MSFT by 3,9%. TSLA was struggling a bit, ending the week 0,33% higher from the week before.
Weekly news regarding trade tariffs include a US-Vietnam trade deal of 20% tariffs on imports from Vietnam. At the same time, the US exports to Vietnam will be tariffs-free. However, markets are still concerned regarding the final resolution of imposed 90-days delay of implemented tariffs for almost 180 countries around the world, a period which expires in July. On the other hand, Trump's tax mega bill was passed by the US Senate on Tuesday, and is currently awaiting final approval from the House. There were many discussions during the previous period that this tax mega bill might further increase US debt levels, which will be negatively reflected in the economy.

Dummy ideaFastest Way to Create an Idea on TradingView
Here’s a step-by-step guide to quickly publish an idea (analysis, chart, or setup) on TradingView:
1. Prepare Your Chart
• Open TradingView and set up your chart with all desired indicators, drawings, and timeframes.
2. Open the Publish Idea Window
• Shortcut: Press `Alt + P` on your keyboard to instantly open the “Publish Idea” window.
• Or: Click the Publish button at the top-right corner of your chart.
3. Fill Out the Required Fields
• Title: Enter a clear, descriptive title for your idea.
• Description: Write a brief explanation of your analysis or setup.
• Category: Select the appropriate category (e.g., Analysis, Tutorial).
• Direction: Mark your idea as Long, Short, or Neutral.
• Privacy: Choose Public or Private.
• (Optional) Add tags and related ideas for better visibility.
4. Publish
• Confirm you agree to the House Rules.
• Click Publish Idea.
