S&P 500 Index Wave Analysis – 25 July 2025
- S&P 500 Index broke key resistance level 6300.00
- Likely to rise to resistance level 6500.00
S&P 500 Index recently broke the key resistance level 6300.00 (which stopped the previous waves 5 and (B), as can be seen below).
The breakout of the resistance level 6300.00 continues the active intermediate impulse wave (5) from the middle of this month.
Given the strong daily uptrend, S&P 500 Index can be expected to rise to the next resistance level 6500.00 (coinciding with the daily up channel from May).
SPCUSD trade ideas

S&P 500 (CASH500) - Double Top H1Risk/reward = 2.7
Entry price = 6388.4
Stop loss price = 6399.7
Take profit level 1 (50%) = 6360.4
Take profit level 2 (50%) = 6352
Also, waiting on confirmation on some variables

SPX More upside potentialI've revised my previous count based on recent price action. I now see a potential minor Wave 4 (of Intermediate Wave 5) forming around the 6,500 level. This could present a reasonable opportunity to take some % profits, (for the cautious or short term traders) though I recommend being prepared to re-enter, as I still believe we are ultimately headed toward the 6,650–6,720 range before a larger-scale correction sets in.
Taking some profits around 6,500 may be a prudent move, or alternatively, you can continue holding while adjusting your trailing stops accordingly.
Generally and in most cases its best to exhaust you bullish counts in Elliot .
On the right hand side i am showing SPX/ DXY which is typically a more accurate and discernable wave pattern then the SPX alone. FYI

SPX 0DTE TRADE IDEA – JULY 25, 2025
⚠️ SPX 0DTE TRADE IDEA – JULY 25, 2025 ⚠️
🔻 Bearish Bias with Weak Volume – Max Pain Looming at 6325
⸻
📊 Quick Market Snapshot:
• 💥 Price below VWAP
• 🧊 Weak Volume
• 📉 Max Pain @ 6325 = downside pressure
• ⚖️ Mixed Options Flow = no clear bullish conviction
⸻
🤖 Model Breakdown:
• Grok/xAI: ❌ No trade – weak momentum
• Claude/Anthropic: ✅ Bearish lean, favors PUTS near highs
• Gemini: 🟡 Slightly bullish bias, BUT agrees on caution
• Llama: ⚪ Neutral → No action
• DeepSeek: ❌ Bearish → No trade
⸻
📌 TRADE IDEA:
🎯 SPX 6365 PUT (0DTE)
💵 Entry Price: $0.90
🎯 Profit Target: $1.80 (💥 2x return)
🛑 Stop Loss: $0.45
📆 Expires: Today
🕒 Exit by: 3:45 PM
📈 Confidence: 65%
⏰ Entry Timing: OPEN
⸻
⚠️ Risk Flags:
• Low volume = fragile conviction
• Possible reversal if SPX breaks above session highs
• Max pain magnet at 6325 could limit gains or induce a bounce
⸻
🧠 Strategy:
Scalp it quick. Get in early. Exit before the gamma games explode into close.
📈 Like this setup? Drop a 🔽 if you’re playing puts today!
#SPX #0DTE #PutOptions #OptionsTrading #MaxPain #SPY #MarketGamma #TradingSetup

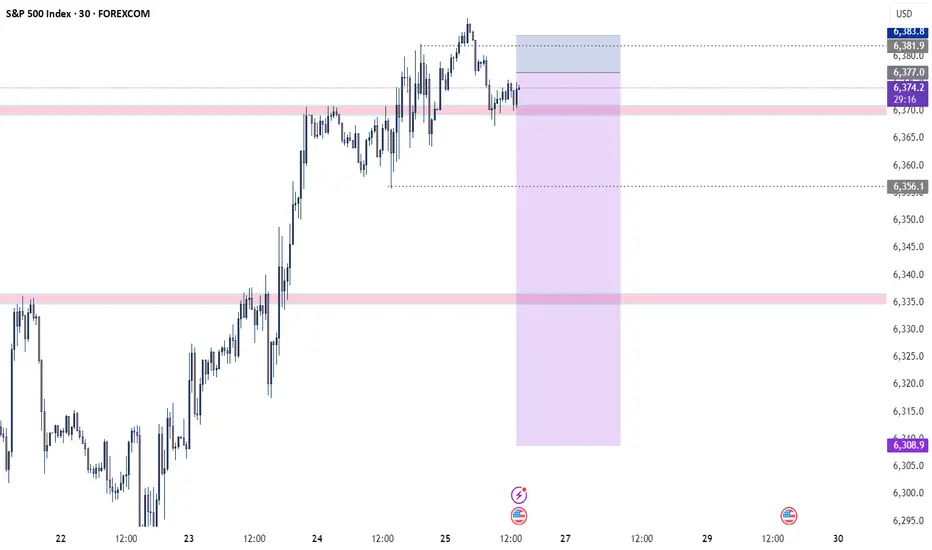
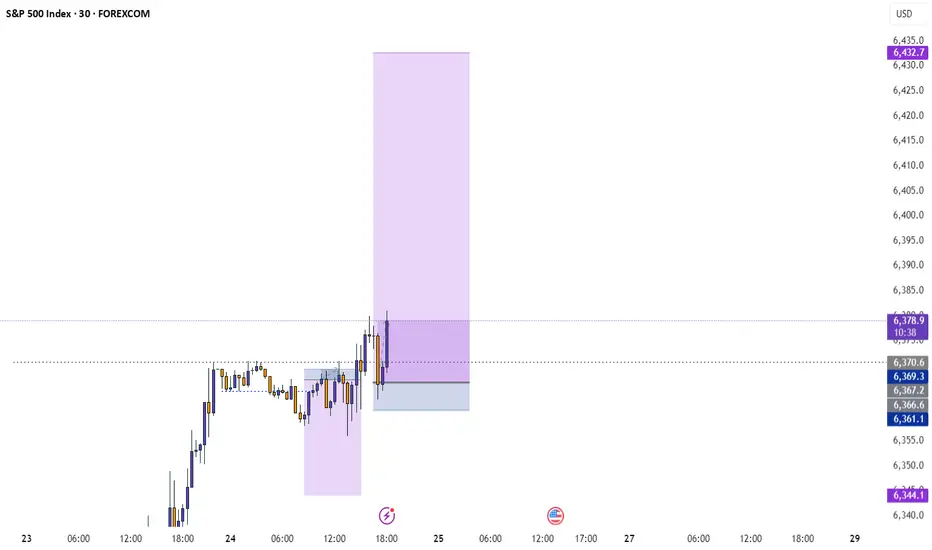
S&P500 (CASH500) SHORT - head and shoulders 30minRisk/reward = 4.1
Entry price = 6378
Stop loss price = 6385.9
Take profit level 1 (50%) = 6349.2
Take profit level 2 (50%) = 6337.2
Still waiting on confirmation of a few variables at close of this 30min candle at 17.00

SellRejection Level
Daily Volume
Market Structure Shift
London US Session
Trend Line Break
Untapped Order Point
Can the S&P 500's Ascent Continue?The S&P 500 recently achieved unprecedented highs, reflecting a multifaceted market surge. This remarkable performance stems primarily from a robust corporate earnings season. A significant majority of S&P 500 companies surpassed earnings expectations, indicating strong underlying financial health. The Communication Services and Information Technology sectors, in particular, demonstrated impressive growth, reinforcing investor confidence in the broader market's strength.
Geopolitical and geostrategic developments have also played a crucial role in bolstering market sentiment. Recent "massive" trade agreements, notably with Japan and a framework deal with Indonesia, have introduced greater predictability and positive economic exchanges. These deals, characterized by reciprocal tariffs and substantial investment commitments, have eased global trade tensions and fostered a more stable international economic environment, directly contributing to market optimism. Ongoing progress in trade discussions with the European Union further supports this positive trend.
Furthermore, resilient macroeconomic indicators underscore the market's upward trajectory. Despite a recent dip in existing home sales, key data points like stable interest rates, decreasing unemployment claims, and a rising manufacturing PMI collectively suggest an enduring economic strength. While technology and high-tech sectors, driven by AI advancements and strong earnings from industry leaders like Alphabet, remain primary growth engines, some segments, such as auto-related chipmakers, face challenges.
The S&P 500's climb is a testament to the powerful confluence of strong corporate performance, favorable geopolitical shifts, and a resilient economic backdrop. While the immediate rally wasn't directly driven by recent cybersecurity events, scientific breakthroughs, or patent analyses, these factors remain critical for long-term market stability and innovation. Investors continue to monitor these evolving dynamics to gauge the sustainability of the current market momentum.
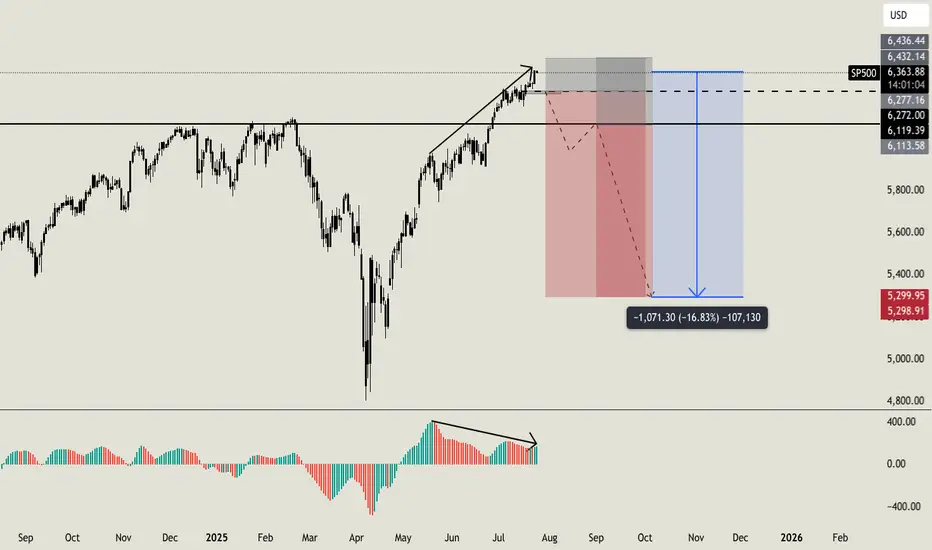
Do you want to keep buying SP500?Hello all. I usually love to work analyzing volumes, times and key level, i am not used to check the standard indicators, but this time i'll made an exception. Lot of indicators (AO, MACD, RSI, OBV) are showing weakness on higher timeframe with a strong bearish divergence (like the one i am sharing now on AO). On smaller timeframe i usually ignore this signals, because they can result in a little retrace, but on higher timeframe like this one can be a strong reversal indicator. But this is not the only things that let me open this position. Going deeper into my analysis, i have a first key level at $6270. Once we will break below this level, i'll open my first sell order with a stoploss a little higher than ATH. If price will break below my second key level at $6120 i'll open my second short order. My main and final target is $5300 (around -16% from now) but i will consider to secure profits before this level. I'll update you guys, and let me know if you are agree with me or not. Cheers
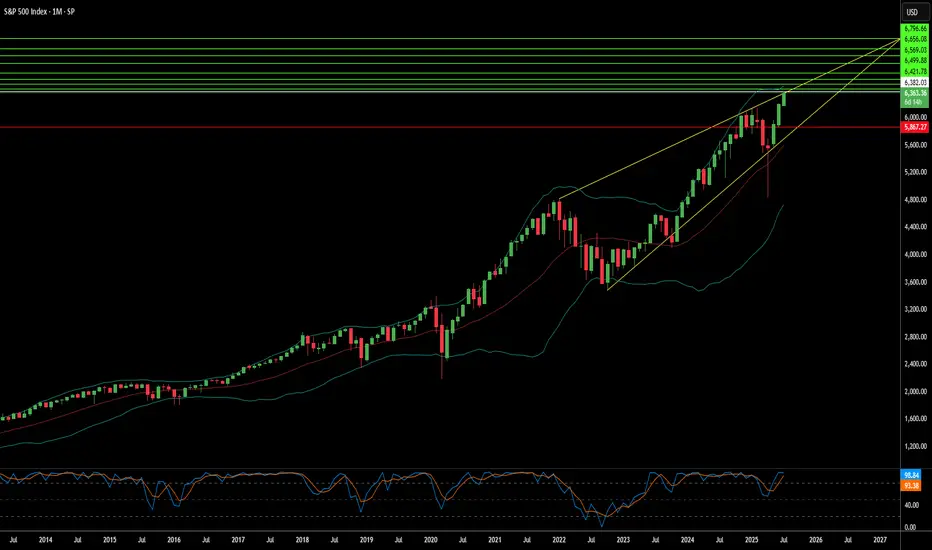
S&P500 This is why every CORRECTION is a GIFT.The S&P500 index (SPX) has been steadily rising since the April bottom to new All Time Highs (ATH). On the grand 100 year scale, the February - March tariff fueled correction, has been nothing significant. The last true technical correction has been the 2022 Inflation Crisis because it touched, and instantly rebounded on, the 1M MA50 (blue trend-line).
This is not the first time we bring forward our multi-decade perspective on stock and in particular this chart. But it serves well, keeping us into the meaningful long-term outlook of the market. This suggests that since the Great Depression and the first signs of recovery after the 1935 - 1941 Bear Cycle, the market has entered a multi-decade Channel Up, which is divided into long-term aggressive expansion periods (Bull Cycles) and shorter term depressions (Bear Cycles).
During a Bull Cycle, every test of the 1M MA50 is a instant cyclical buy opportunity and in fact that isn't presented very often. During a Bear Cycle, the market makes an initial aggressive correction below the 1M MA50, turns increasingly volatile for 5-7 years, trading sideways within the Channel Up with its second peak resulting into a 2nd correction that eventually breaks below the 1M MA200 (orange trend-line).
That is what we call a 'generational buy opportunity' as in the past 80 years, it has only been taken place 2 times.
Right now (again this is not something we mention for the first time), the market is at the start of the A.I. Bubble, with incredibly strong similarities with the Internet Bubble of the 1990s.
In fact, relative to the Internet Bubble, it appears that we are on a stage similar to 1993 - 1994, before the market turned parabolic to the eventual Dotcom Bust of 2000.
As a result, from a technical perspective, every 'small' correction such as the one we had this year, is a blessing in disguise (buy opportunity). As the index grew by 5 times during the Internet Bubble (300 to 1500), it is also very possible to see it approach this feat going from roughly 3500 (late 2022) to 14000 (by late 2032) and touch the top of the multi-decade Channel Up.
Are you willing to miss out on this generational wealth creation opportunity?
-------------------------------------------------------------------------------
** Please LIKE 👍, FOLLOW ✅, SHARE 🙌 and COMMENT ✍ if you enjoy this idea! Also share your ideas and charts in the comments section below! This is best way to keep it relevant, support us, keep the content here free and allow the idea to reach as many people as possible. **
-------------------------------------------------------------------------------
💸💸💸💸💸💸
👇 👇 👇 👇 👇 👇

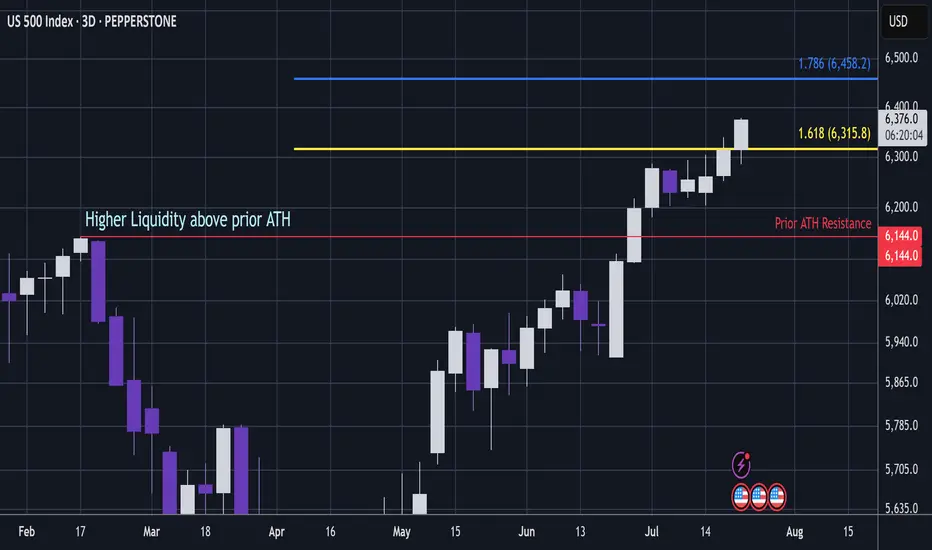
US500 - Can S&P Pass Critical Ratio / Liquidity ZoneS&P (Pepperstone CFD)
Price has popped above the 1.618 extension, which is a key ratio zone.
A bearish whipsaw in this area could be dangerous.
However, if price continues to push through this level, it signals that S&P is entering a very bullish phase.
The area above prior ATH resistance holds high liquidity.
If price moves beyond this ratio band, it will signal that a reversal in this zone is unlikely.
That said, if it’s still in this band when Trump tariffs are reinstated potentially on 1 August, then this is looking dangerous 🧐.
(Fib trendlines lower in the chart).
This analysis is shared for educational purposes only and does not constitute financial advice. Please conduct your own research before making any trading decisions.
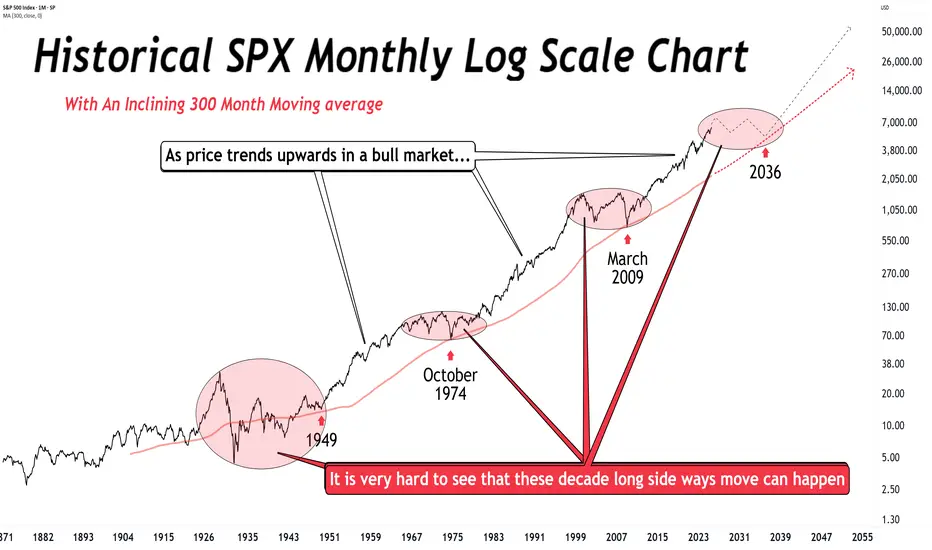
Before the perma-bulls go bonkers… Before the perma-bulls go bonkers… no, I’m not calling for a crash or bear market (yet).
But longer this bull runs, greater the odds of mean reversion.
Further we drift from 2009 without tagging the 300-month MA, more likely a sideways decade begins.
This will happen again.
You can't say we are "early" in the bull market. That simply is not true. Early is in the few years after the 2009 retouch of that very long term moving average. Can the indices still go up? Of course. But understand where you are in the cycle.
S&P's "hugely overbought" towards 6375!1). Position Volume dropping! 2). Big institutions (Banks & Insurance) have backed off on higher Risk positions! 3). Huge resistance at .728 fib & trend! 4). Trump tariff talk is likely adding to a fall as well! 5). We're looking for a "SELL" trade @ 6375, since buying is too risky at the moment...Good Luck!

Quarterly Candle AnalysisQuarterly candle data going back to 1928 was exported and analyzed in Excel .
The purpose of doing so was to identify candles comparable to the candle we had in Q2 of 2025 (last quarter) in terms of scale and form.
Two properties of the candles were considered:
1. Candle Length as a % of Close (Column L)
2. Lower Wick as a % of Close minus Upper Wick as a % of Close (Column R)
The product of these properties (Column S) was considered as the primary quantitative metric for this analysis.
The two quarters determined to be most similar based on having green candles with forms similar to Q2 2025 were as follows:
Q4 1998
Q1 2016
Both quarters were followed by at least 4 more bullish quarters, hence, the result of this analysis is bullish, as should be expected with such a bullish candle.

US500 Bulls Assemble | Breakout Heist Strategy📈🚨 MASTER HEIST PLAN: “SPX500 ROBBERY – THIEF TRADING STYLE 🔥💸” 🚨📈
(The Ultimate Long Strategy Blueprint for Smart Day/Swing Traders)
🌍 Greetings to All Market Bandits, Bullish Burglars, and Chart Snipers!
Hola! Bonjour! Ola! Hallo! Marhaba! 🙌
🦹♂️This is your friendly chart thief checking in with the latest SPX500/US500 masterplan!
This isn’t just a trade—it’s a heist 🎯. We’re not here to participate, we’re here to dominate! Welcome to the Thief Trading Style, where we map, trap, and snatch those pips with ruthless precision. 🧠🔍💰
🚀 THIEF TRADE SETUP - SPX500/US500
A mix of technical sniper entries + fundamental black ops analysis = 💸 Maximum Extraction. 💸
🎯 ENTRY PLAN: THE BREAKOUT HEIST
📍Buy Entry Zone: Wait for the clean breakout + candle close above 6270.00.
"The vault opens once we clear that wall. Let the bullish getaway begin!" 💥🚪📈
🛠️Thief Tips for Entry:
Use Buy Stop Orders above resistance levels.
OR layer in Buy Limit Orders near recent pullbacks (15/30m swing zones) using DCA Style (Dollar Cost Average layering like a pro).
Want stealth mode? Set that alert (alarm), and strike when the breakout sings. 🔔🎯
🛑 STOP LOSS – PROTECT THE LOOT
🧨Set your SL smart—beneath the nearest swing low using the 2H timeframe for stronger structure.
💬 “Look, don’t gamble. A thief knows when to run. Set that stop where I showed ya, or risk losin’ the bag.” 💼💣
❗Your SL should reflect your risk per trade, lot size, and number of entries. It’s your getaway plan—don’t mess it up.
💥 TARGETS – WHERE WE CASH OUT
🏴☠️Primary Take Profit (TP1): 6310.00
🏴☠️Secondary Take Profit (TP2): 6370.00
💹 Scalp Traders: Stick to the Long Side Only. Ride the momentum, but use trailing SL to lock it in.
🔍 THIEF FUNDAMENTAL INTEL: WHY THIS IS OUR MOMENT
Current SPX500 bullishness driven by:
✅ Positive macro & geopolitical tailwinds
✅ Institutional positioning (COT reports)
✅ Intermarket analysis showing strong correlations
✅ Momentum building with sentiment and volume
📌 Stay sharp—check all your fundamental reports, news catalysts, and sentiment tools before executing your move. Smart thieves plan every detail. 🎓📊
⚠️ NEWS RELEASE REMINDER
📢 News = Chaos. Don’t get caught in the spray:
🔒Avoid entering trades just before big announcements.
🚀 Use Trailing SL to secure profit if you're already in.
Stay agile. Stay smart. Stay rich. 💼🚁
❤️ SUPPORT THE HEIST – HIT THAT BOOST BUTTON!
👊 Liked the plan? Hit the Boost to join the elite robbery crew.
Every boost fuels the mission. Every like sharpens the strategy. Let's build a team of smart, profitable traders. 🚀💸🔥
🧠 Remember: This is general analysis – not financial advice. Manage your risk like a true thief. Stay updated. Adapt fast. Don't get caught. 🕵️♂️
🎉See you in the next Heist Plan! Keep your tools sharp, your charts cleaner, and your profit bags fatter. 🤑🔥

BuyRejection Level
Daily Volume
Market Structure Shift
London US Session
Trend Line Break
Untapped Order Point
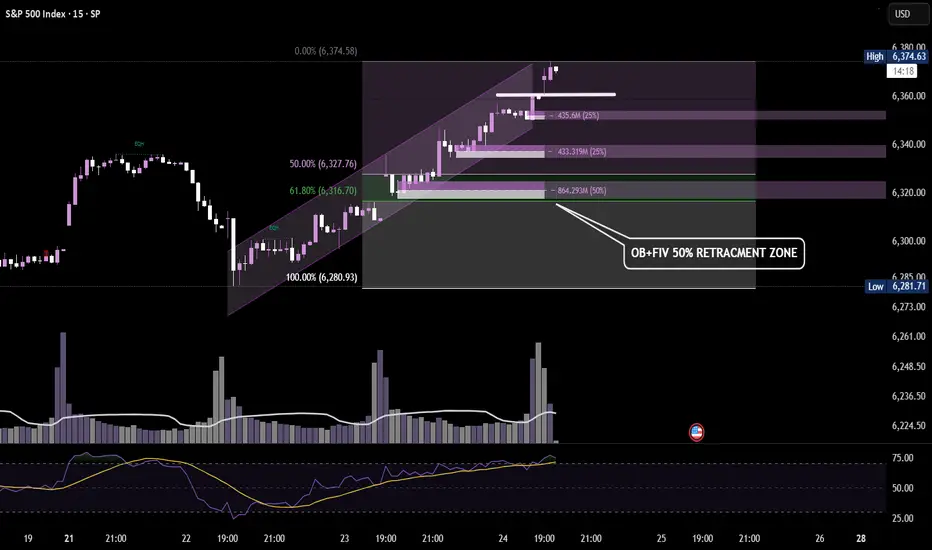
S&P 500 – 15Min Chart BreakdownPotential retracement zone aligning with Order Block + 50% FIB.
Watching for bullish reaction near 6320–6316 — key confluence zone for a possible continuation leg. 🔁📈
S&P500 push to new ATH? Key Developments:
AI Drives Earnings Momentum
Alphabet reported strong results, but flagged surging AI infrastructure costs, signaling increased capex ahead.
SK Hynix posted record earnings and committed to expanding AI-related investments, reinforcing the sector’s critical growth role.
Investor sentiment remains AI-positive, with capital rotation favoring tech and semiconductors despite margin compression risks.
Banking Sector Boosted by Tariff-Driven Volatility
Deutsche Bank’s FIC (Fixed Income & Currencies) trading revenue jumped 11% to €2.28B, its best Q2 since 2007, aided by global trade uncertainty.
BNP Paribas also beat earnings estimates, continuing the strong showing from European banks amid market volatility.
Trade & Tariff Watch
The EU and US are nearing a deal on a 15% standard tariff rate, potentially stabilizing trade flows and market pricing.
Trump’s broader reciprocal tariff push remains in focus, especially after the US-Japan deal. Investors are watching for signs of escalation or resolution with other partners like the EU and Canada.
Fed in the Political Spotlight
Trump visited the Fed’s construction site, criticizing costs and maintaining pressure on Chair Jerome Powell.
Speculation about Fed leadership changes and political interference is unsettling, though markets have largely shrugged this off for now.
Meanwhile, House Republicans are drafting a follow-up tax-and-spending plan, which could shape future fiscal policy and market expectations.
Conclusion: S&P 500 Trading Outlook
The S&P 500 remains buoyed by strong earnings, particularly from AI-linked sectors and financials, while geopolitical risks and tariff volatility are being absorbed as catalysts for trading profits rather than panic.
Bullish factors: Strong corporate earnings (Alphabet, SK Hynix, Deutsche Bank), potential trade de-escalation (EU-US tariff deal), and AI momentum.
Risks to monitor: Rising AI capex (impact on margins), political tension around the Fed, and tariff uncertainty.
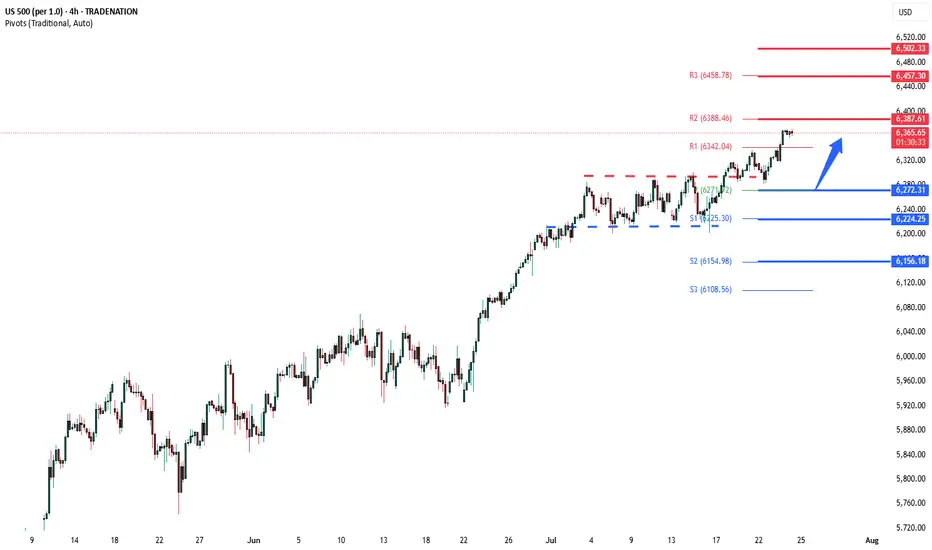
Key Support and Resistance Levels
Resistance Level 1: 6387
Resistance Level 2: 6457
Resistance Level 3: 6502
Support Level 1: 6272
Support Level 2: 6224
Support Level 3: 6156
This communication is for informational purposes only and should not be viewed as any form of recommendation as to a particular course of action or as investment advice. It is not intended as an offer or solicitation for the purchase or sale of any financial instrument or as an official confirmation of any transaction. Opinions, estimates and assumptions expressed herein are made as of the date of this communication and are subject to change without notice. This communication has been prepared based upon information, including market prices, data and other information, believed to be reliable; however, Trade Nation does not warrant its completeness or accuracy. All market prices and market data contained in or attached to this communication are indicative and subject to change without notice.
SellRejection Level
Daily Volume
Market Structure Shift
London Session
Trend Line Break
Untapped Order Point

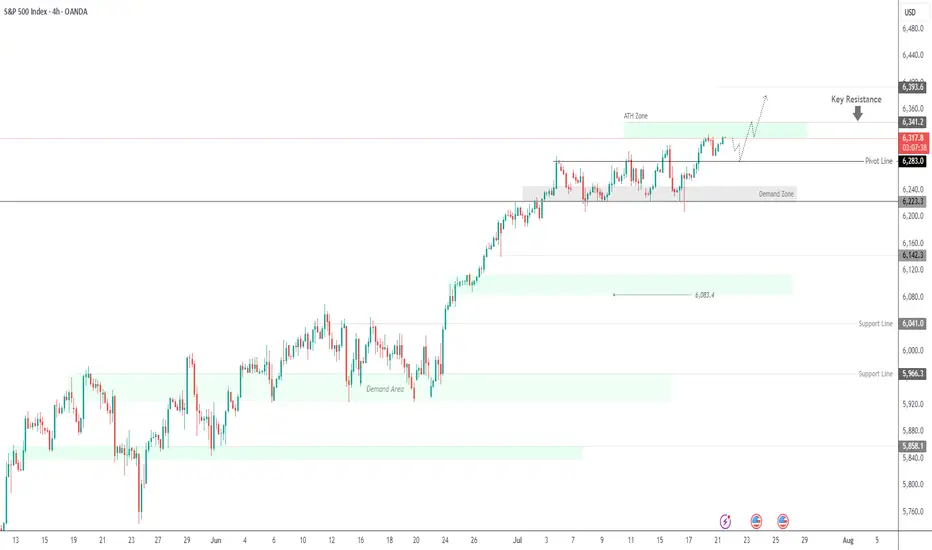
SPX500 Near ATH | Earnings Week Could Fuel Next MoveSPX500 | Weekly Outlook
The S&P 500 continues its bullish run, trading at record highs as investors await a critical week of tech earnings. Reports from Alphabet and Tesla could be key in justifying the lofty valuations driven by the AI boom.
Technical Outlook:
The price is expected to consolidate between 6341 and 6283 before any decisive move. A short-term bearish correction may occur initially, but if the price holds above the support zone, a push toward a new ATH at 6341 is likely. A breakout above this level could extend gains toward 6375 and 6393.
However, a break below 6283 would indicate weakness, potentially driving the price toward the demand zone near 6250 and 6224.
Support: 6283 · 6250 · 6224
Resistance: 6341 · 6375 · 6393
Well...... I have no words to say, lets see what happens now. The Last Breath of Bulls
They came with horns of thunder,
hooves pounding gold from earth,
a decade’s dance in roaring winds,
each sunrise glinting mirth.
They charged through fields of candlesticks,
green banners held aloft,
dreams stacked on dreams, layer by layer,
voices rising, soft to rough.
But markets tire as all beasts do,
the grass runs dry and thin,
greed’s fattened calves now restless,
as silence crowds the din.
A tremor in the trading halls,
screens blinking red, then grey,
the bulls look up at iron clouds,
no dawn in this new day.
They stand, bewildered, heavy,
in fields now tinged with frost,
the horns that once carved futures bright,
bowed under the cost.
The end comes not with fury,
but a quiet pulling thread,
the bullish songs that once were sung,
now whispers of the dead.
Yet even as the bulls lie down,
the soil still holds the sun,
for from the hush of fallen hooves,
new seasons will be spun.

People don't like the truth! Let's be honest, people don't like honesty. They prefer ideas that affirm their own beliefs.
When I read articles and posts from newer traders, it's often from a place of "all in" diamond hands and the notion that things go up forever.
I've been a trader for over 25 years now, and the game isn't about making a quick buck, it's about making money over and over again. This got me thinking, the issue is when you deal with a small account you require leverage, small timeframes and of course the "shit" or bust mindset. If you lose a thousand dollars, $10,000 even $100,000 - what does it matter? That's no different than a game of poker in Vegas.
The idea of being 80% in drawdown, is alien to me. The idea of one trade and one win is also a crazy notion.
Instead of playing with the future, there is an easier way to work. This isn't about slow and boring, it's about psychology and discipline. 10% returns on a million-dollar account isn't all that difficult. Instead of aiming for 300x returns on an alt coin (due to the account size being tiny) You can make less of a percentage gain with a larger account size.
In terms of psychology - the word " HOPE " is used, way too often, it's used when you hope a stock or the price of Bitcoin goes up, it's used when you hope the position comes back in your favour, it's used when you want your 10,000 bucks to double.
This isn't trading, it's gambling.
The truth is, it's not the winners that make you a good trader. It's the way you deal with the losses.
Once you learn proper risk management, a downtrend in a market move is a 1-2% loss coupled with a new opportunity to reverse the bias.
As a disciplined trader, the game is played differently.
Let's assume you don't have $100k spare - prop firms are a great option, OPM = other people's money.
Remove the risk and increase the leverage, all whilst trading with discipline.
The market goes through many phases, cycles and crashes.
You don't always need something as catastrophic to take place, but if you are all in on a position. You need to understand that losses can be severe and long-lasting.
When everyone sees an oasis in the desert, it's often a mirage.
You only have to look at the Japanese lesson in 1989, when the Nikkei was unstoppable-until it wasn't. For that short space in time, everyone was a day trader, housewives to taxi drivers.
Everyone's a genius in a Bull market.
Then comes the crash. The recovery time on that crash?
34-years!!!
I have covered several aspects of psychology here on TradingView;
When it comes to trading, if you are able to keep playing. It's a worthwhile game. If you are gambling, it's a game whereby the house often wins.
Right now, stocks are worth more than their earnings. Gold is up near all-time highs, crypto, indices the same.
All I am saying is if you are all in. Be careful!
Disclaimer
This idea does not constitute as financial advice. It is for educational purposes only, our principal trader has over 25 years' experience in stocks, ETF's, and Forex. Hence each trade setup might have different hold times, entry or exit conditions, and will vary from the post/idea shared here. You can use the information from this post to make your own trading plan for the instrument discussed. Trading carries a risk; a high percentage of retail traders lose money. Please keep this in mind when entering any trade. Stay safe.
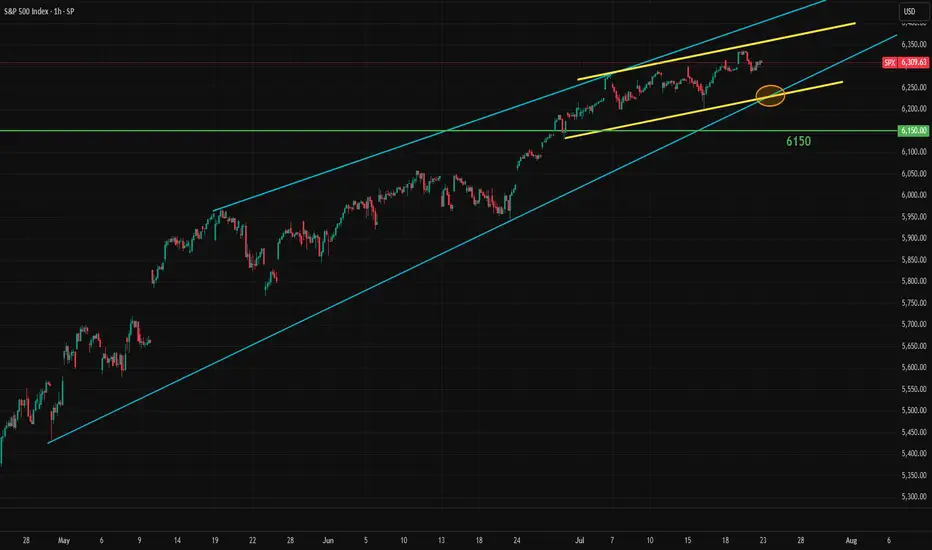
Market Breadth Flashes Warning, but S&P 500 Still Holds SteadyThe S&P 500 continues its slightly positive movement. However, the momentum has been slowing, forming a long, wedge-like pattern. These long wedges have been a recurring feature in the stock market for years. From the monthly timeframe to the 1-hour chart, the market often forms wedges.
Wedge formations tend to break to the downside but can persist for a long time before doing so. The S&P 500 typically makes a sharp correction selloff, then recovers in a "V" shape, followed by the formation of another wedge. This pattern appears to be repeating once again. Still, there are some negative signals that traders should be aware of:
1- The impact of tariffs on growth remains a major unknown. Most tariff deals have not been finalized yet. While the Japan agreement is a positive step, negotiations with the EU will be more significant.
2- Many earnings reports will be released in the coming weeks, potentially shaping market sentiment. These earnings will reflect some of the tariff effects. AI and tech remain the key market drivers, so their results will be especially important.
3- Some breadth indicators are showing early warning signs. One of the most useful is the "percentage of stocks above the 200-day moving average." This metric shows whether the market is broadly participating in the rally or being driven by a few large-cap names. Typically, when the market weakens, traders rotate into mega caps. The rounded numbers below shows the weakness:
March 2024 Top: 5250 - Percantege Above 200 MA: 85%
July 2024 Top: 5675 - Percantege Above 200 MA: 80%
December 2024 Top: 6100 - Percantege Above 200 MA: 74%
July 2025 Current: 6309 - Percantege Above 200 MA: 66%
This shows that fewer and fewer stocks are managing to stay above their 200-day moving average while S&P making new highs. This is not an immediate red flag, but the weakening is apparent.
In summary, the slightly positive outlook remains intact for now and is expected to continue until the wedge breaks with some early warning signs. If that happens, a sharp selloff may follow, creating both selling and buying opportunities. In the short term, 6280 is the immediate support level to watch.
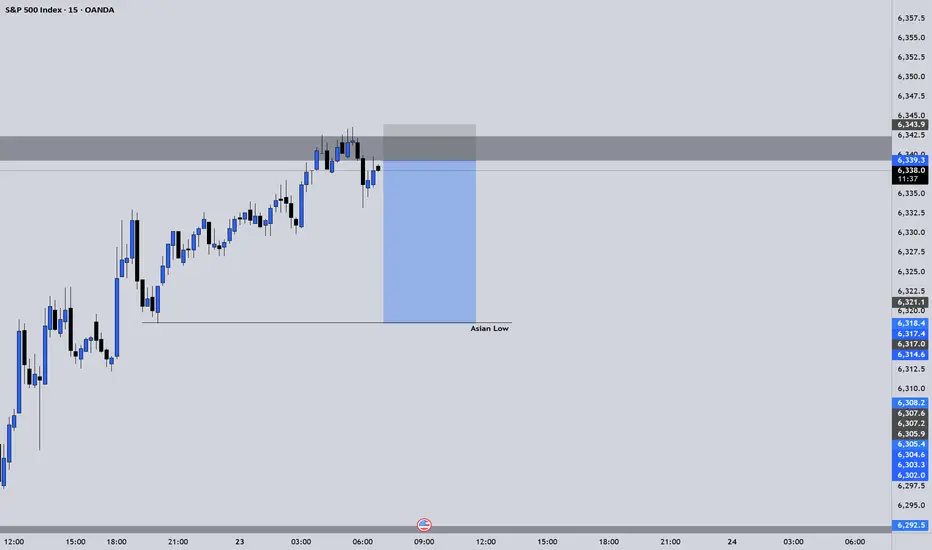
SPX500 ShortElite Analysis
This was a discretionary trade
Price came to structural liquidity
Executed trade on 5m
Targeting Asian low LP.