Textbook Falling Wedge & Wyckoff Accumulation Brewing?Analysis:
Looking at the daily chart for Crude Oil, we appear to be seeing a very compelling confluence of bullish technical signals that suggest a potential significant reversal to the upside.
Textbook Falling Wedge Formation:
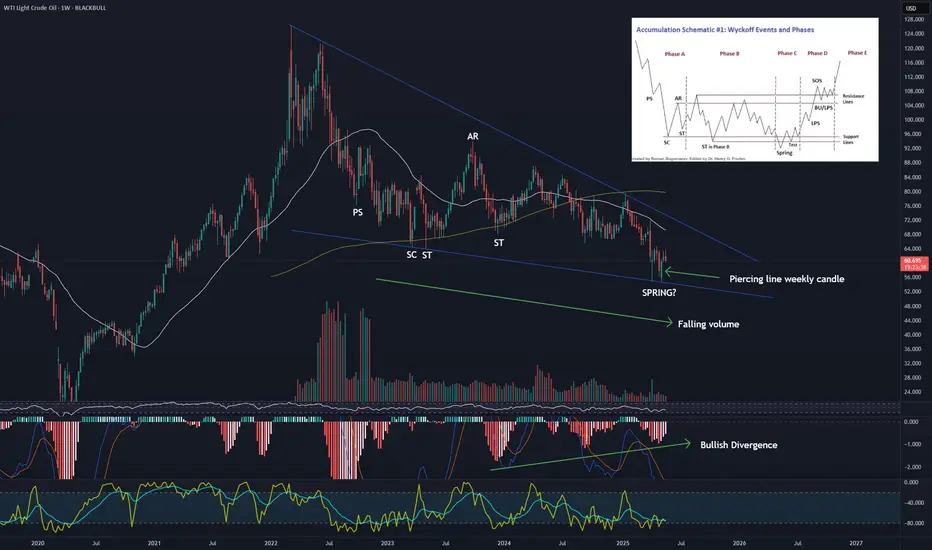
Price action is clearly consolidating within a well-defined falling wedge pattern.
We have observed multiple clear touches (3+ on the upper, 4+ on the lower trendline), indicating these boundaries are highly respected by the market.
Crucially, volume has been declining as price consolidates within the wedge, a classic characteristic signifying diminishing selling pressure.
The angles of convergence also appear ideal, with the upper trendline being steeper than the lower.
Wyckoff Accumulation Schematic #1 in Play?
Diving deeper, the internal structure of this falling wedge strongly resembles Wyckoff's Accumulation Schematic #1.
We can identify potential phases:
PS (Preliminary Support): Early signs of buying.
SC (Selling Climax): A sharp sell-off often with high volume, marking potential capitulation.
AR (Automatic Rally): The first significant bounce after the SC.
ST (Secondary Test): Retesting the lows of the SC.
Spring: A key event where price dips below the established trading range support (or the wedge's lower trendline) only to quickly reverse back above it, effectively trapping sellers and confirming a shakeout of weak hands.
This internal Wyckoff structure within the falling wedge significantly strengthens the case for institutional accumulation taking place.
Bullish Candlestick & Oscillator Confluence:
At the recent lows, we observed a potential Piercing Line bullish reversal candlestick pattern forming right at the lower trendline of the wedge. This indicates aggressive buying stepping in.
The MACD indicator has confirmed this bullish shift, showing a recent bullish crossover (MACD line above Signal line) and a flip of the histogram from red to green.
Furthermore, there appears to be a bullish divergence on the MACD – as price made lower lows within the wedge, the MACD indicator made higher lows (or showed increasing bullish momentum), suggesting underlying bearish momentum is weakening significantly.
Market Sentiment & Potential Implications:
It's noteworthy that this bullish technical setup is occurring amidst increased bearish media and Twitter sentiment surrounding oil. From a contrarian perspective, extreme bearish sentiment often coincides with market bottoms, as "smart money" accumulates positions while the crowd is most pessimistic. This situation could set the stage for a strong reversal, potentially fueled by short covering.
Conclusion:
All signs from price action, volume, candlestick patterns, and oscillators point towards a high probability of a bullish reversal and an upside breakout from this well-formed falling wedge. The potential Wyckoff accumulation pattern adds significant weight to the idea that sophisticated players are positioning for a significant move higher.
What to Watch For:
The next critical step is a decisive breakout above the upper trendline of the falling wedge, ideally accompanied by a significant surge in buying volume. This would confirm the pattern's completion and signal the potential start of a new uptrend. A more aggressive approach is entering now and capturing more upside if it is to occur.
This is for educational purposes only and not financial advice. Always conduct your own research and manage your risk.
SPOTCRUDE trade ideas
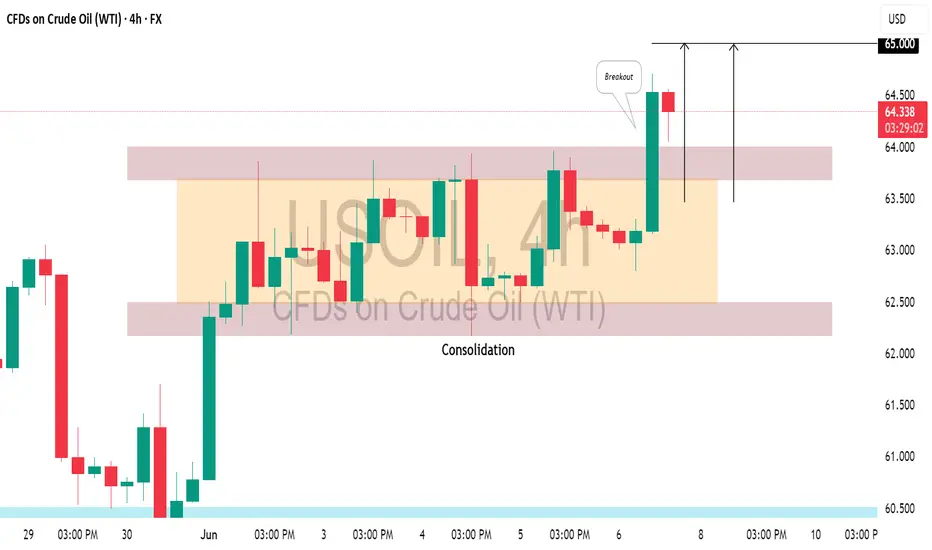
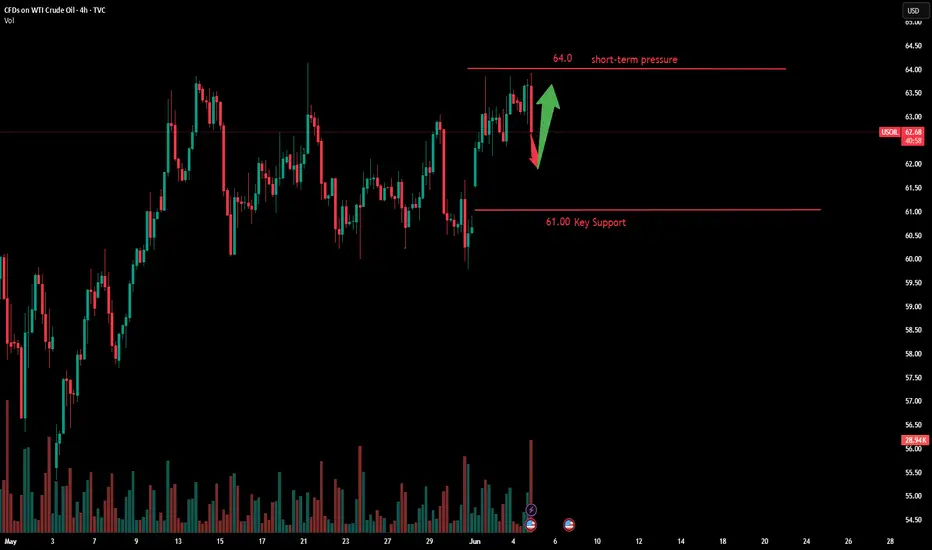
US CRUDE OIL(#WTI) : Bullish Trend Continues📈USOIL is trading in a bullish trend on a 4H time frame.
After a prolonged upward movement, it started to consolidated within a horizontal range for a while.
Recently, the resistance of this range was breached, indicating strong buyer momentum.
I believe the upward movement may persist, potentially leading the market to reach the 65.00 level soon.
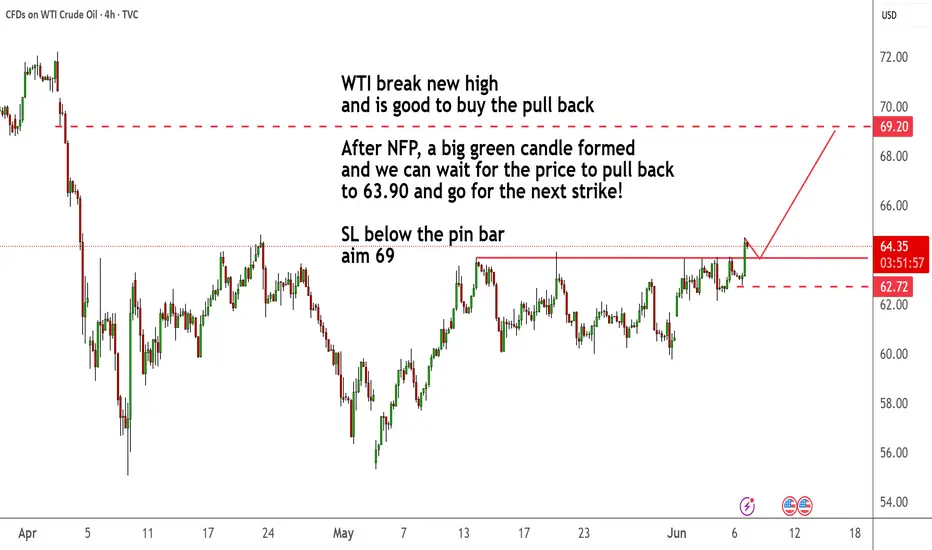
WTI break new high and is good to buy the pull backWTI break new high
and is good to buy the pull back
After NFP, a big green candle formed
and we can wait for the price to pull back
to 63.90 and go for the next strike!
SL below the pin bar
aim 69
USOIL:The strategy of going short
USOIL: Same thinking, still maintain the short strategy. Friends with short orders at 63.3-63.5 continue to wait, can increase short orders near 63.8, the target is 62.5-62.3 unchanged
↓↓↓ More detailed strategies and trading will be notified here ↗↗↗
↓↓↓ Keep updated, come to "get" ↗↗↗

Crude Oil (WTI) Daily Chart AnalysisCrude Oil (WTI) Daily Chart Analysis
Pattern Formed:
A Symmetrical Triangle formation is clearly visible.
Context:
The prior trend leading into the triangle was bearish.
Typically, in technical analysis, a triangle after a downtrend is considered a continuation pattern — meaning there is a higher probability that the price will break downward.
The triangle appears to have completed its 5-wave internal structure (ABCDE), a classical behavior of contracting triangles.
Breakout Expectation:
After a completed 5-wave triangle, a breakout is imminent.
Directional Bias: Since this triangle is forming after a strong downtrend, the higher probability is for a bearish breakout.
However, triangles can break either way, and when they do, the move is often impulsive.
Potential Scenarios:
Bearish Breakdown (High Probability):
A downside break would likely trigger a sharp fall.
Immediate support levels to watch post-breakout:
$60.00
$56.50
$46.75 (measured move — target derived from the height of the triangle projected downward)
Bullish Breakout (Low Probability but Possible):
In case of an upside breakout, resistance zones are:
$72.00 (supply zone + previous highs)
$78.00
Upside could see sharp momentum but is less likely unless there is strong fundamental support (e.g., geopolitical tensions, production cuts).
Volume Confirmation:
Volume typically contracts during triangle formation. Post-breakout, volume expansion is essential to confirm the breakout direction.
Indicators (Suggested Additional Confirmations):
Watch for RSI — if divergence forms, could signal weakness.
Monitor MACD for crossovers at breakout zones.
Summary
Triangle Completed: 5-wave structure inside the triangle — ready for breakout.
Bias: Bearish continuation pattern — higher probability of a downward move.
Trigger: Breakout of the triangle boundary with volume expansion will confirm the next move.
Targets (Post-Breakout):
Downside: $60 ➔ $56.5 ➔ $46.75
Upside (less probable): $72 ➔ $78
⚠️ Disclaimer:
This analysis is based purely on technical chart patterns and historical price action. Trading and investing involve substantial risk. Always perform your own due diligence or consult a financial advisor.

OIL short termAfter yesterday rally today price must back down to first target 61.8-62 then to 61 and maybe we go lower to close GAP.

Could the price bounce from here?WTI Oil (WTI/USD) is falling towards the pivot, which has been identified as an overlap support and could bounce to the 1st resistance, which is a pullback resistance.
Pivot: 62.36
1st Support: 61.81
1st Resistance: 63.24
Risk Warning:
Trading Forex and CFDs carries a high level of risk to your capital and you should only trade with money you can afford to lose. Trading Forex and CFDs may not be suitable for all investors, so please ensure that you fully understand the risks involved and seek independent advice if necessary.
Disclaimer:
The above opinions given constitute general market commentary, and do not constitute the opinion or advice of IC Markets or any form of personal or investment advice.
Any opinions, news, research, analyses, prices, other information, or links to third-party sites contained on this website are provided on an "as-is" basis, are intended only to be informative, is not an advice nor a recommendation, nor research, or a record of our trading prices, or an offer of, or solicitation for a transaction in any financial instrument and thus should not be treated as such. The information provided does not involve any specific investment objectives, financial situation and needs of any specific person who may receive it. Please be aware, that past performance is not a reliable indicator of future performance and/or results. Past Performance or Forward-looking scenarios based upon the reasonable beliefs of the third-party provider are not a guarantee of future performance. Actual results may differ materially from those anticipated in forward-looking or past performance statements. IC Markets makes no representation or warranty and assumes no liability as to the accuracy or completeness of the information provided, nor any loss arising from any investment based on a recommendation, forecast or any information supplied by any third-party.

WTI CRUDE OIL: Going for a LH rejection. Sell signal.WTI Crude Oil is practically neutral on its 1D technical outlook (RSI = 55.991, MACD = 0.160, ADX = 24.748) as it's on the 3rd straight day of flat consolidation on the 1D MA50. The last time it did this was on April 2nd, which resulted in a LH rejection to the S1 level. As the presence of the R1 level (64.90) is just above, we expect the market to get rejected and aim for the S1 again (TP = 56.00).
## If you like our free content follow our profile to get more daily ideas. ##
## Comments and likes are greatly appreciated. ##

Crude Oil is Building Momentum for a BreakoutDuring the U.S. trading session on Thursday, international oil prices fluctuated higher, with U.S. crude oil currently trading near $63.55 per barrel. Despite the intraday volatility, international oil prices remain under downward pressure, primarily influenced by two key factors.
First, data from the U.S. Energy Information Administration (EIA) showed that as of last week, U.S. gasoline and distillate inventories increased more than expected, signaling weakening refined product demand in the world’s largest economy. This development has sparked investor concerns about whether the U.S. summer driving season can sustain demand growth, leading to a ~1% decline in oil prices on Wednesday.
The current crude oil market is caught between supply and demand headwinds:
Supply-side pressures: OPEC+’s production increase plan and Saudi Arabia’s strategic price cuts have created short-term bearish sentiment.
Demand-side uncertainties: The unexpected rise in U.S. refined product inventories has amplified market doubts about the vigor of global consumption recovery.
Additionally, the escalation of international trade frictions has further dampened risk appetite, exacerbating downward pressure on prices.
In the short term, oil prices are likely to continue oscillating within the $60–$65 per barrel range. Market participants should closely monitor U.S. macroeconomic data and OPEC+’s compliance with its production policies for directional cues.
Humans need to breathe, and perfect trading is like breathing—maintaining flexibility without needing to trade every market swing. The secret to profitable trading lies in implementing simple rules: repeating simple tasks consistently and enforcing them strictly over the long term.
Trading Strategy:
buy@61.5-62.0
TP:63.0-63.5
USOIL SELL SIGNAL Entry Point: 62.60USOIL SELL SIGNAL
Entry Point: 62.60
🎯 Target 1: 62.00
🎯 Target 2: 61.00
🎯 Final Target: 60.00
⚠️ Risk Management Matters!
– Always set a stop-loss
– Never risk more than 1–2% per trade
– Stick to your strategy, not emotions
📊 Technical Outlook:
– Resistance zone near 62.60
– Bearish pressure increasing
– Potential trend reversal forming
✅ Lock profits step by step
✅ Use trailing stops when in profit
✅ Avoid overtrading or revenge trading
📌 Stay consistent and patient
📌 The goal is longevity, not luck
📌 Trust your analysis – not the noise
📢 For educational purposes only – trade responsibly!

USOIL:Go short first today
USOIL: Crude oil downward momentum gradually stronger, the day's trend is weak, trading ideas first short.
Trading Strategy:
SELL@63.3-63.5
TP: 62.5-62.3
↓↓↓ More detailed strategies and trading will be notified here ↗↗↗
↓↓↓ Keep updated, come to "get" ↗↗↗

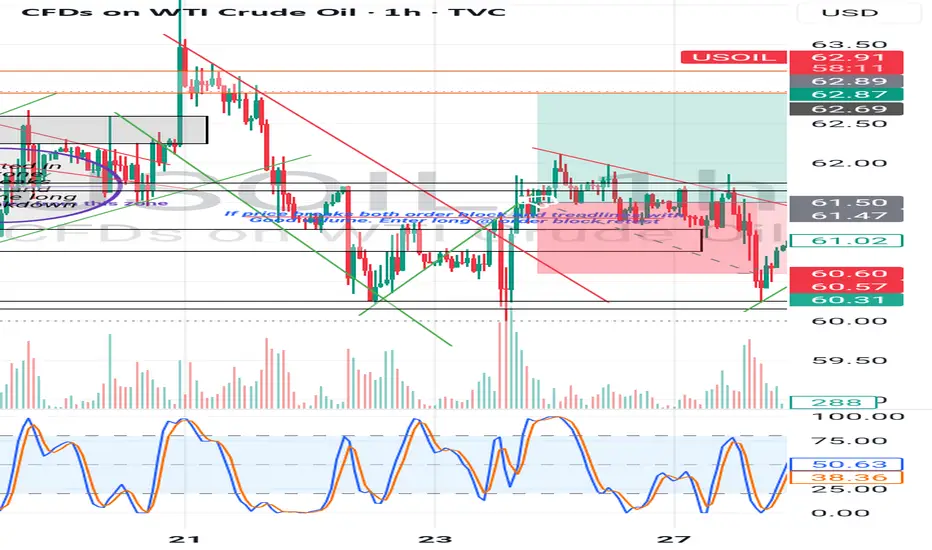
US OIL SHORT POSITION Oil price is currently in a Bearish trend, especially after it got rejected thrice from the supply zone, Also left a Gap over the weekend close and open which is another confluence for me taking the short is.
So let's see how it Goes.💪
US OIL LONG POSITION RESULT Oil had now formed a triple bottom pattern, and also holding the minor Support Trendline indicating signs for bullisd potential.
Price action did move in our direction, just couldn't break above the orange resistance zone, and then reversed and went straight down to our Sl (my bad though, Should've moved sl to entry price to make it safe).
Better Luck and TA next time.

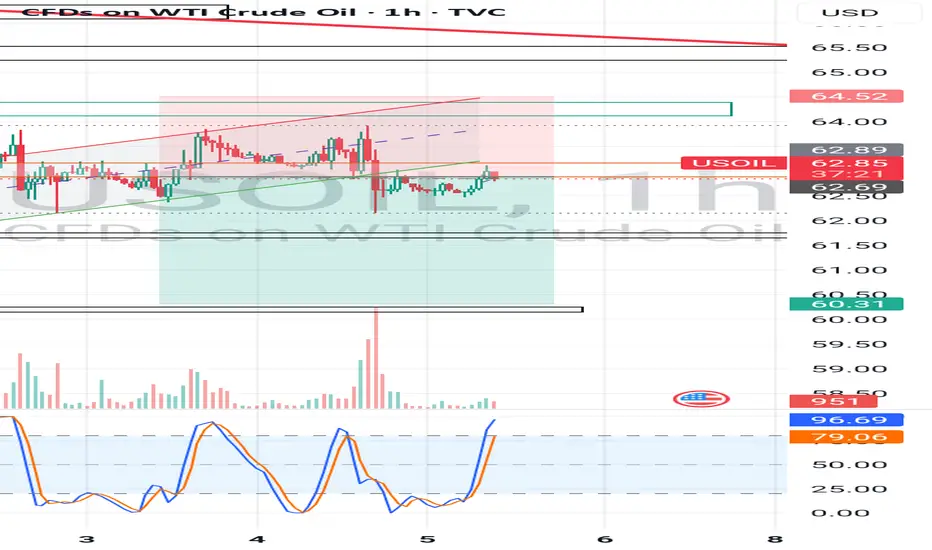
USOIL Will Grow! Buy!
Take a look at our analysis for USOIL.
Time Frame: 1D
Current Trend: Bullish
Sentiment: Oversold (based on 7-period RSI)
Forecast: Bullish
The market is testing a major horizontal structure 62.890.
Taking into consideration the structure & trend analysis, I believe that the market will reach 68.865 level soon.
P.S
The term oversold refers to a condition where an asset has traded lower in price and has the potential for a price bounce.
Overbought refers to market scenarios where the instrument is traded considerably higher than its fair value. Overvaluation is caused by market sentiments when there is positive news.
Disclosure: I am part of Trade Nation's Influencer program and receive a monthly fee for using their TradingView charts in my analysis.
Like and subscribe and comment my ideas if you enjoy them!

US OIL LONG RESULT Oil price broke out of the falling expanding wedge, with some good volume in Confluence woth the double pattern (as at entry) and also holding the minor support Trendline I decided to open a long trade to the next supply zone.
Price did move in our direction, just dumped down to grab liquidity at the support again hitting our SL.
Was a B" setup so we'll move on.
WTI Oil H1 | Overlap support at 61.8% Fibonacci retracementWTI oil (USOIL) is falling towards an overlap support and could potentially bounce off this level to climb higher.
Buy entry is at 61.52 which is an overlap support that aligns close to the 61.8% Fibonacci retracement.
Stop loss is at 59.60 which is a level that lies underneath a multi-swing-low support.
Take profit is at 63.76 which is a multi-swing-high resistance.
High Risk Investment Warning
Trading Forex/CFDs on margin carries a high level of risk and may not be suitable for all investors. Leverage can work against you.
Stratos Markets Limited (tradu.com ):
CFDs are complex instruments and come with a high risk of losing money rapidly due to leverage. 63% of retail investor accounts lose money when trading CFDs with this provider. You should consider whether you understand how CFDs work and whether you can afford to take the high risk of losing your money.
Stratos Europe Ltd (tradu.com ):
CFDs are complex instruments and come with a high risk of losing money rapidly due to leverage. 63% of retail investor accounts lose money when trading CFDs with this provider. You should consider whether you understand how CFDs work and whether you can afford to take the high risk of losing your money.
Stratos Global LLC (tradu.com ):
Losses can exceed deposits.
Please be advised that the information presented on TradingView is provided to Tradu (‘Company’, ‘we’) by a third-party provider (‘TFA Global Pte Ltd’). Please be reminded that you are solely responsible for the trading decisions on your account. There is a very high degree of risk involved in trading. Any information and/or content is intended entirely for research, educational and informational purposes only and does not constitute investment or consultation advice or investment strategy. The information is not tailored to the investment needs of any specific person and therefore does not involve a consideration of any of the investment objectives, financial situation or needs of any viewer that may receive it. Kindly also note that past performance is not a reliable indicator of future results. Actual results may differ materially from those anticipated in forward-looking or past performance statements. We assume no liability as to the accuracy or completeness of any of the information and/or content provided herein and the Company cannot be held responsible for any omission, mistake nor for any loss or damage including without limitation to any loss of profit which may arise from reliance on any information supplied by TFA Global Pte Ltd.
The speaker(s) is neither an employee, agent nor representative of Tradu and is therefore acting independently. The opinions given are their own, constitute general market commentary, and do not constitute the opinion or advice of Tradu or any form of personal or investment advice. Tradu neither endorses nor guarantees offerings of third-party speakers, nor is Tradu responsible for the content, veracity or opinions of third-party speakers, presenters or participants.

USCRUDEOIL - Up ChannelHi Traders,
We are following the price in the "Up Channel". I am not a wave trader but i do understand the concept. the ABC are just for drawing purposes not the exact science of it.
With that said, lets BUY CMCMARKETS:USCRUDEOIL
Price Action:
Price is moving within a clear ascending channel
Good Luck
Study, Study, Study Lorenzo Tarati

Potential bearish drop?WTI Oil (XTI/USD) has rejected off the pivot and could drop to the 1st support.
Pivot: 63.35
1st Support: 59.48
1st Resistance: 6.25
Risk Warning:
Trading Forex and CFDs carries a high level of risk to your capital and you should only trade with money you can afford to lose. Trading Forex and CFDs may not be suitable for all investors, so please ensure that you fully understand the risks involved and seek independent advice if necessary.
Disclaimer:
The above opinions given constitute general market commentary, and do not constitute the opinion or advice of IC Markets or any form of personal or investment advice.
Any opinions, news, research, analyses, prices, other information, or links to third-party sites contained on this website are provided on an "as-is" basis, are intended only to be informative, is not an advice nor a recommendation, nor research, or a record of our trading prices, or an offer of, or solicitation for a transaction in any financial instrument and thus should not be treated as such. The information provided does not involve any specific investment objectives, financial situation and needs of any specific person who may receive it. Please be aware, that past performance is not a reliable indicator of future performance and/or results. Past Performance or Forward-looking scenarios based upon the reasonable beliefs of the third-party provider are not a guarantee of future performance. Actual results may differ materially from those anticipated in forward-looking or past performance statements. IC Markets makes no representation or warranty and assumes no liability as to the accuracy or completeness of the information provided, nor any loss arising from any investment based on a recommendation, forecast or any information supplied by any third-party.

USOIL:tay long
USOIL: The short-term objective trend is oscillating. In terms of momentum, the MACD indicator is above the zero axis, showing a top divergence, indicating that the upward momentum is weakening. In the first two trading days, the overall rhythm trend was alternating between primary and secondary, and it is expected that the intraday crude oil trend will still maintain the probability of shock upward, so maintain the long idea.
Trading can wait for the retracement after the long.
Trading Strategy:
BUY@62.8-63
TP: 63.8-64
↓↓↓ More detailed strategies and trading will be notified here ↗↗↗
↓↓↓ Keep updated, come to "get" ↗↗↗

Potential bearish drop?USO/USD has reacting off the resistance level which is a pullback resistance and could drop from this level to our take profit.
Entry: 64.42
Why we like it:
There is a pullback resistance level.
Stop loss: 66.35
Why we like it:
There is a pullback resistance level that is slightly below the 78.6% Fibonacci projection.
Take profit: 56.94
Why we like it:
There is an overlap support level.
Enjoying your TradingView experience? Review us!
Please be advised that the information presented on TradingView is provided to Vantage (‘Vantage Global Limited’, ‘we’) by a third-party provider (‘Everest Fortune Group’). Please be reminded that you are solely responsible for the trading decisions on your account. There is a very high degree of risk involved in trading. Any information and/or content is intended entirely for research, educational and informational purposes only and does not constitute investment or consultation advice or investment strategy. The information is not tailored to the investment needs of any specific person and therefore does not involve a consideration of any of the investment objectives, financial situation or needs of any viewer that may receive it. Kindly also note that past performance is not a reliable indicator of future results. Actual results may differ materially from those anticipated in forward-looking or past performance statements. We assume no liability as to the accuracy or completeness of any of the information and/or content provided herein and the Company cannot be held responsible for any omission, mistake nor for any loss or damage including without limitation to any loss of profit which may arise from reliance on any information supplied by Everest Fortune Group.

Maintain high-level volatility.In early trading on Wednesday in the Asian market, international oil prices fell slightly, mainly affected by the easing of supply-demand balance and the drag on the global economic outlook from trade concerns. Brent crude oil futures fell 0.1% to $65.58 per barrel, while U.S. WTI crude oil fell 0.1% to $63.32. This decline came after both rose about 2% in the previous trading day, hitting two-week highs. Tuesday's rally was driven by two main factors: first, large-scale wildfires in Canada since early May, which caused thousands of people to evacuate and disrupted part of crude oil production; second, markets expected Asian countries to reject the nuclear agreement draft proposed by the United States, thereby maintaining sanctions on the major oil-producing country and reducing crude oil supply. The current international oil market is in a game of multiple forces. On the one hand, geopolitical factors and natural disasters have increased short-term supply risks; on the other hand, OPEC+ production expansion and trade concerns have constrained the sustainability of price rebounds. In the absence of clear policy directions and confirmation from inventory data, oil prices may remain volatile at high levels.
Humans need to breathe, and perfect trading is like breathing—maintaining flexibility without needing to trade every market swing. The secret to profitable trading lies in implementing simple rules: epeating simple tasks consistently and enforcing them strictly over the long term.
Trading Strategy:
buy@62.0-62.5
TP:63.5-64.0
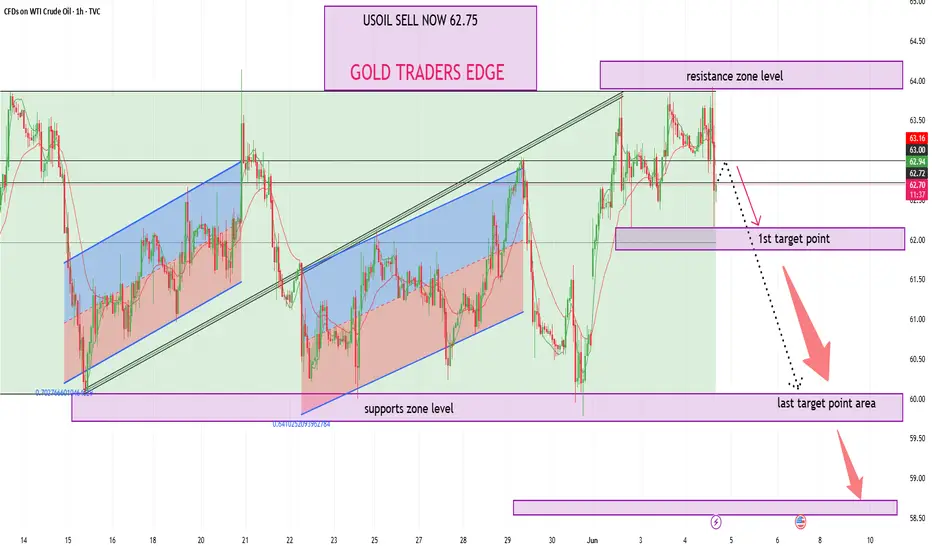
USOIL SHORT TRADE SETUP Entry: 62.75USOIL SHORT TRADE SETUP
Entry: 62.75
🔹 Direction: Sell / Short
🎯 Target Levels:
1️⃣ First Target: 62.00
2️⃣ Second Target: 61.00
3️⃣ Final Target: 60.00
🛡️ Risk Management:
✅ Position size according to your account size
✅ Use stop loss based on personal strategy
✅ Protect capital first – always
📊 Rationale:
Expecting bearish continuation below 63.00
Price facing resistance at higher levels
Downtrend pressure remains intact
⚠️ Disclaimer:
This is not financial advice
Trade at your own risk
Always do your own analysis
Stick to your trading plan
📈 Stay disciplined – patience pays!
Crude oil is about to end its shock outbreak
💡Message Strategy
International oil prices rose in early Asian trading on Tuesday, mainly due to rising risks of supply disruptions. Iran is expected to reject a nuclear deal proposal from the United States, which would have paved the way for easing sanctions on Iranian oil exports.
In addition, wildfires in Alberta, Canada, also caused some oil and gas production to be suspended, exacerbating market concerns about supply.
Brent crude rose 0.86% to $65.20 a barrel; U.S. West Texas Intermediate rose 0.75% to $63.00. This continued the previous trading day's nearly 3% increase.
Geopolitical tensions also added to market concerns. The ongoing conflict between Russia and Ukraine has increased uncertainty in the global supply chain and geopolitical risk premiums.
Oil prices were also supported by OPEC+'s slowing production increase. The Organization of the Petroleum Exporting Countries and its allies (OPEC+) decided at a meeting last week to increase production by only a small 411,000 barrels per day in July, the same as in the previous two months and lower than the large increase some market participants had expected.
International market conditions have a great impact on crude oil trends. Currently, various reasons have indicated an upward trend in crude oil, paving the way for the upcoming rising market.
📊Technical aspects
Technical analysis shows that the daily chart of US crude oil (WTI) is strong and still has room for upward movement in the short term. After the current WTI crude oil price stabilized at the integer mark of $61, it closed positively for several consecutive days, showing an obvious upward channel pattern.
In terms of technical indicators, the MACD fast and slow lines have formed a golden cross, and the kinetic energy column continues to expand, indicating that the bulls are strengthening; the RSI is near 65, not entering the overbought range, but showing good upward momentum.
In addition, the 5-day and 10-day moving averages continue to diverge upward after the golden cross, supporting the oil price trend. If the oil price can effectively break through the resistance level of $63.50, it is expected to challenge the previous high of $65.80;
💰 Strategy Package
Long Position: 62.00-62.50
