WTI US OIL US Oil (WTI Crude) Price Context
Price: WTI crude oil futures settled at approximately $68.66 per barrel close of friday.
Prices rebounded after a prior decline, supported by strong summer travel demand, high refinery utilization, and supply management efforts by major producers like Russia and Saudi Arabia.
Outlook: Despite near-term supply tightness, the International Energy Agency (IEA) and OPEC forecast a potential surplus later in 2025 and slower demand growth through 2026–2029, especially due to slower Chinese economic growth.
The DXY measures the USD strength against a basket of major currencies and often moves inversely to commodities priced in USD like oil.
When the DXY strengthens, oil prices can face downward pressure due to higher USD value making oil more expensive in other currencies.
Conversely, a weaker DXY tends to support higher oil prices.
Current Dynamics:
If geopolitical risks or supply constraints push oil prices up, the USD may weaken as markets price in inflationary pressures.
Conversely, if the USD strengthens due to safe-haven demand or monetary policy, oil prices may soften.
#usoil
SPOTCRUDE trade ideas

Crude Oil – Range Getting Too Long to Ignore
Oil has been stuck in a prolonged range, and a breakout in either direction is becoming increasingly likely.
The overall trend remains bullish, as there’s been no confirmed trend reversal yet.
📌 Key Scenarios:
A break to the upside would signal continuation of the bullish trend.
A break below the range could confirm a potential trend reversal.
📈📉 To avoid missing the next move, this setup can be traded with Buy Stop above the range and Sell Stop below it, allowing you to catch the momentum regardless of the direction.
⚠️ Wait for confirmation on higher timeframes if you prefer less risk
Crude oil rebounds after a correction!International oil prices continued to climb on Monday, though the gains were limited. Brent crude futures rose 8 cents to $70.44 per barrel, extending Friday's 2.51% rally. U.S. WTI crude edged up 5 cents to $68.50 per barrel, after surging 2.82% in the previous trading session.
The primary driver behind the current upward move stems from market expectations of further escalation in U.S. sanctions against Russia. U.S. President Trump stated on Sunday that he would provide Ukraine with the "Patriot" air defense missile system and deliver a "major announcement" on Russia-related issues on Monday. "Trump is dissatisfied with the Russian President's failure to advance the peace process, a stance exacerbated by Russia's continued bombing of Ukrainian cities in recent days.
In the short term (1-hour timeframe), crude oil has shown high volatility, with prices finding support at the lower edge of the wide trading range and moving higher again. The objective short-term trend direction is upward within the range, with sufficient bullish momentum. However, given the high probability of recent erratic price swings, there is a greater likelihood that intraday crude oil prices will encounter resistance at the upper edge of the range and pull back.
you are currently struggling with losses,or are unsure which of the numerous trading strategies to follow,You have the option to join our VIP program. I will assist you and provide you with accurate trading signals, enabling you to navigate the financial markets with greater confidence and potentially achieve optimal trading results.
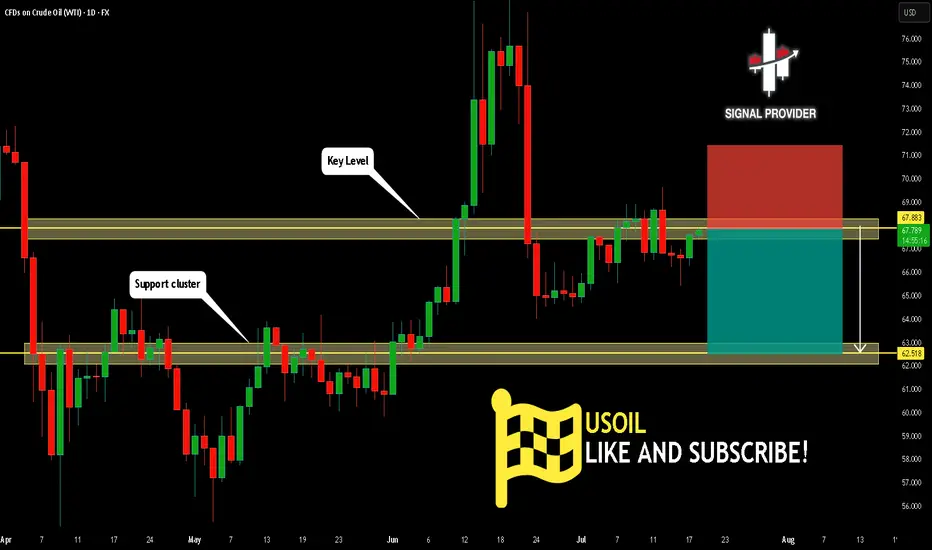
USOIL Will Go Lower! Sell!
Take a look at our analysis for USOIL.
Time Frame: 1D
Current Trend: Bearish
Sentiment: Overbought (based on 7-period RSI)
Forecast: Bearish
The price is testing a key resistance 67.883.
The above-mentioned technicals clearly indicate the dominance of sellers on the market. I recommend shorting the instrument, aiming at 62.518 level.
P.S
Overbought describes a period of time where there has been a significant and consistent upward move in price over a period of time without much pullback.
Disclosure: I am part of Trade Nation's Influencer program and receive a monthly fee for using their TradingView charts in my analysis.
Like and subscribe and comment my ideas if you enjoy them!
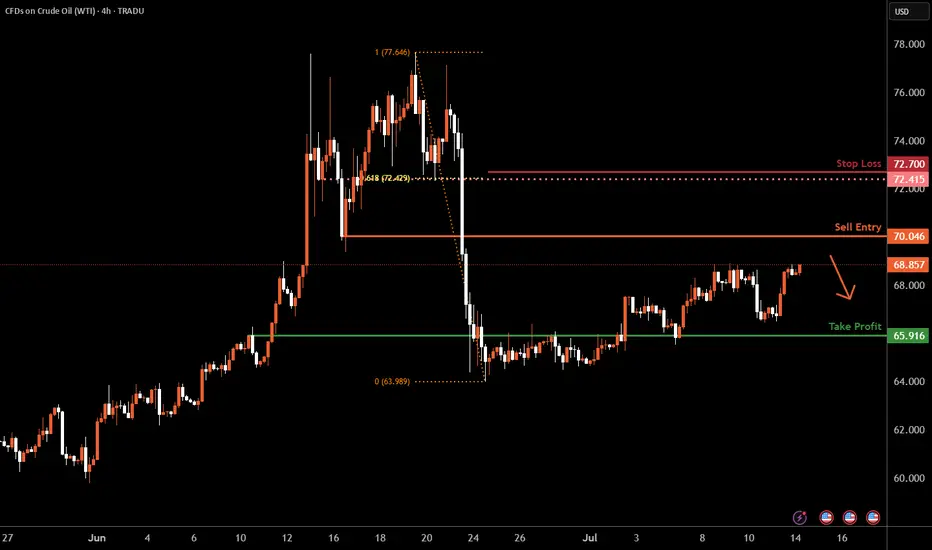
WTI Oil H4 | Rising into a pullback resistanceWTI oil (USOIL) is rising towards a pullback resistance and could potentially reverse off this level to drop lower.
Sell entry is at 70.04 which is a pullback resistance.
Stop loss is at 72.70 which is a level that sits above the 61.8% Fibonacci retracement and a pullback resistance.
Take profit is at 65.91 which is an overlap support.
High Risk Investment Warning
Trading Forex/CFDs on margin carries a high level of risk and may not be suitable for all investors. Leverage can work against you.
Stratos Markets Limited (tradu.com ):
CFDs are complex instruments and come with a high risk of losing money rapidly due to leverage. 63% of retail investor accounts lose money when trading CFDs with this provider. You should consider whether you understand how CFDs work and whether you can afford to take the high risk of losing your money.
Stratos Europe Ltd (tradu.com ):
CFDs are complex instruments and come with a high risk of losing money rapidly due to leverage. 63% of retail investor accounts lose money when trading CFDs with this provider. You should consider whether you understand how CFDs work and whether you can afford to take the high risk of losing your money.
Stratos Global LLC (tradu.com ):
Losses can exceed deposits.
Please be advised that the information presented on TradingView is provided to Tradu (‘Company’, ‘we’) by a third-party provider (‘TFA Global Pte Ltd’). Please be reminded that you are solely responsible for the trading decisions on your account. There is a very high degree of risk involved in trading. Any information and/or content is intended entirely for research, educational and informational purposes only and does not constitute investment or consultation advice or investment strategy. The information is not tailored to the investment needs of any specific person and therefore does not involve a consideration of any of the investment objectives, financial situation or needs of any viewer that may receive it. Kindly also note that past performance is not a reliable indicator of future results. Actual results may differ materially from those anticipated in forward-looking or past performance statements. We assume no liability as to the accuracy or completeness of any of the information and/or content provided herein and the Company cannot be held responsible for any omission, mistake nor for any loss or damage including without limitation to any loss of profit which may arise from reliance on any information supplied by TFA Global Pte Ltd.
The speaker(s) is neither an employee, agent nor representative of Tradu and is therefore acting independently. The opinions given are their own, constitute general market commentary, and do not constitute the opinion or advice of Tradu or any form of personal or investment advice. Tradu neither endorses nor guarantees offerings of third-party speakers, nor is Tradu responsible for the content, veracity or opinions of third-party speakers, presenters or participants.
I’m short USOIL🛢️ USOIL is WTI Crude Oil, the oil that powers our world.
I’m short USOIL 📉
Too much oil is flooding the market while demand slows down.
Would you take this trade? 🤔
OIL - shortOil back to $ 64.68 (conservative target) and possibly to $ 58 area (optimal target).
Stop loss above 67.32.
Trade with care.
Bullish bounce?USO/USD is falling towards the support level which is an overlap support that aligns with the 61.8% Fibonacci reracement and could bounce from this level to our take profit.
Entry: 64.89
Why we like it:
There is an overlap support that lines up with the 61.8% Fibonacci retracement.
Stop loss: 63.08
Why we like it:
There is a pullback support.
Take profit: 69.97
Why we like it:
There is an overlap resistance.
Enjoying your TradingView experience? Review us!
Please be advised that the information presented on TradingView is provided to Vantage (‘Vantage Global Limited’, ‘we’) by a third-party provider (‘Everest Fortune Group’). Please be reminded that you are solely responsible for the trading decisions on your account. There is a very high degree of risk involved in trading. Any information and/or content is intended entirely for research, educational and informational purposes only and does not constitute investment or consultation advice or investment strategy. The information is not tailored to the investment needs of any specific person and therefore does not involve a consideration of any of the investment objectives, financial situation or needs of any viewer that may receive it. Kindly also note that past performance is not a reliable indicator of future results. Actual results may differ materially from those anticipated in forward-looking or past performance statements. We assume no liability as to the accuracy or completeness of any of the information and/or content provided herein and the Company cannot be held responsible for any omission, mistake nor for any loss or damage including without limitation to any loss of profit which may arise from reliance on any information supplied by Everest Fortune Group.

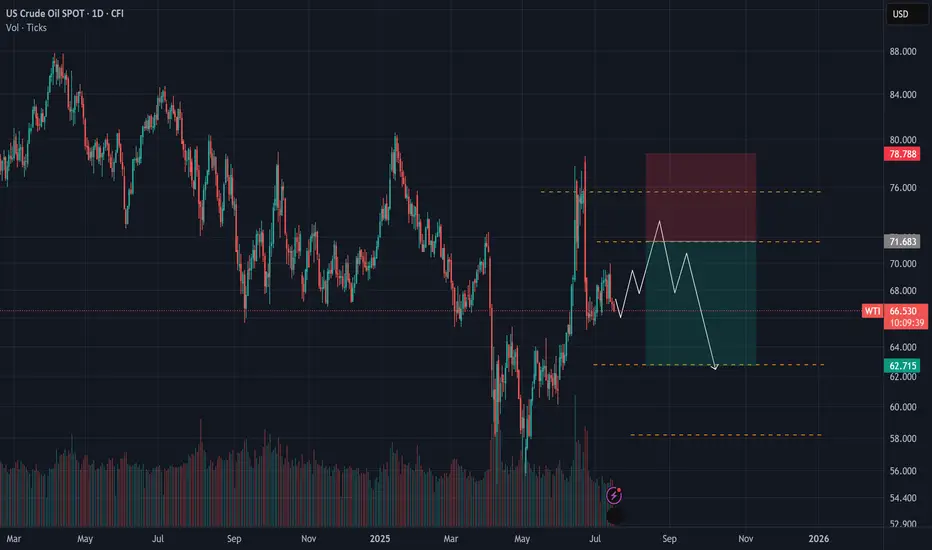
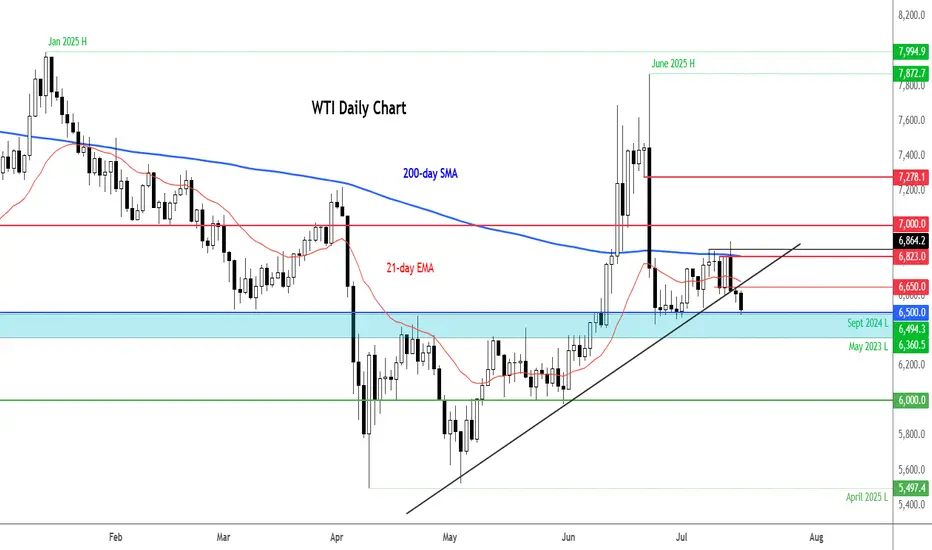
WTI Crude corrective pullback testing support at 6500Trade Tensions & Inflation Impact on WTI Crude
Tariff Announcement: The US has imposed reciprocal tariffs on 22 nations, including major trade partners such as the EU, Japan, Canada, Mexico, and South Korea, after a failed trade agreement during the 90-day negotiation window.
EU Response: The EU is preparing retaliatory tariffs unless a deal is reached before the August 1 deadline, raising the risk of a trade war escalation.
Trump's Warning: The US President has threatened additional tariffs if retaliatory measures are enacted, compounding uncertainty in global trade flows.
Inflation Spike: US June CPI rose to 2.7% YoY, in line with expectations. The increase was driven by higher prices of imported goods, as tariffs begin affecting consumer costs.
Fed Policy Impact: Rising inflation weakens the case for a Fed rate cut in September, dampening liquidity expectations and investor risk sentiment.
Conclusion for WTI Crude Trading
The combination of rising inflation, tariff-driven cost pressures, and a potential stall in Fed easing is bearish for WTI crude in the near term.
Additionally, intensifying trade tensions threaten global demand outlooks, which may further weigh on oil prices.
Traders should expect near-term downside pressure on WTI crude unless there is a clear de-escalation in trade rhetoric or a surprise dovish pivot from the Fed.
Bias: Cautiously Bearish on WTI Crude near term.
Key Support and Resistance Levels
Resistance Level 1: 6830
Resistance Level 2: 6940
Resistance Level 3: 7045
Support Level 1: 6500
Support Level 2: 6435
Support Level 3: 6370
This communication is for informational purposes only and should not be viewed as any form of recommendation as to a particular course of action or as investment advice. It is not intended as an offer or solicitation for the purchase or sale of any financial instrument or as an official confirmation of any transaction. Opinions, estimates and assumptions expressed herein are made as of the date of this communication and are subject to change without notice. This communication has been prepared based upon information, including market prices, data and other information, believed to be reliable; however, Trade Nation does not warrant its completeness or accuracy. All market prices and market data contained in or attached to this communication are indicative and subject to change without notice.

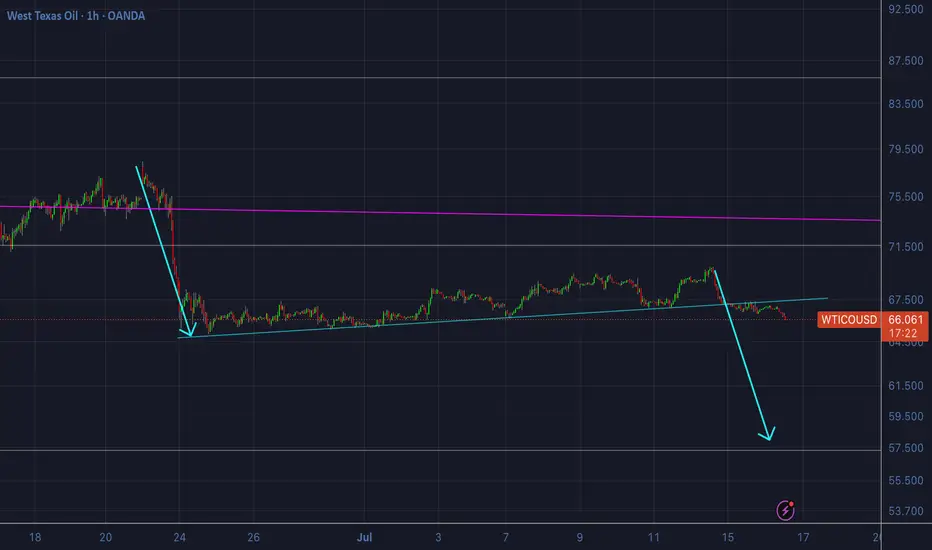
WTI Crude Oil Analysis – July 15, 2025Following recent Middle East tensions, WTI crude oil briefly surged to around $77.
However, the price quickly retraced back to its previous range and seems to have resumed its prior downward trajectory — characterized by a gradual bearish slope.
🔍 It’s important to remember that before the geopolitical events, analysts were eyeing the $52 level as a potential target.
Now, with liquidity being absorbed around the $70 area, that bearish scenario remains valid.
📉 Unless oil decisively breaks above key resistance levels, the outlook continues to favor a slow, downward trend.
CRUDE OIL Bearish Flag Breakout 📉CRUDE OIL Bearish Flag Breakout!
⭕Sell!
__
#USOIL is trading in a local
Downtrend and formed a bearish
Flag pattern and now we are
Seeing a bearish breakout
So we are bearish biased
And we will be expecting
A further bearish move down
Sell!🔽
—

WTIThe final big bear bar can be a potential exhaustion of sellers. It probably gonna have a smaller second leg, then rising up.

WTI Crude Oil Analysis – 4-Hour TimeframeWTI Crude Oil Analysis – 4-Hour Timeframe
At the moment, the price is trading below a key resistance zone (marked in red), which has previously triggered multiple pullbacks. The current price behavior near this area reflects market hesitation to break through this level.
🔴 Bullish Scenario:
If the price manages to break above this resistance zone and holds above it, we can expect the upward movement to continue toward higher resistance levels. This move may unfold in a step-by-step trend, accompanied by intermediate pullbacks. The next resistance zones could act as potential targets for the bullish wave.
🔴 Bearish Scenario:
If the price reacts negatively to the current resistance area and fails to break through, a bearish correction may follow. In this case, the nearby short-term support levels could be the first targets for sellers. If those supports are also broken, the likelihood of a deeper decline and continuation of the downward trend increases.


WTI USOIL As of July 19, 2025, the WTI crude oil price is hovering around $67.342 to $68.83 per barrel after attempting 77.52$ per barrel on Israel Iran conflict in the middle east. As a trader Make out time to look into OPEC WORLD OIL OUTLOOK(WOO) REPORT,SPR REPORT , this woo report provide comprehensive industry forecast and strategic petroleum reserve gives insight into united state energy status.
OPEC meetings are usually held in Vienna and involves discussions and agreement on oil production quotas affecting the global crude oil supply and prices.
oil sharply rose during Israel and Iran geopolitical tension and on the supply roof rejected AT 77.52$ PER BARREL ..
Supply remains cautiously controlled because price is influenced by demand and supply system , but global economic uncertainties and trade tensions, especially involving tariffs and sanctions, continue to influence oil demand expectations.
the US Strategic petroleum reserve (SPR) is the united states emergency crude oil stockpile managed by department of energy ,it act as a buffer to protect against significant supply disruption of oil market, the SPR holds hundreds of millions of barrels of crude oil stored in the underground salt caverns along the gulf coast.it can be tapped to stabilize the market during supply crises or emergencies .
the U.S government occasionally release oil from the SPR to ease supply shortage or control fuel prices coordinated with other countries through the international energy agency if need be.the status and release are regularly monitored as they affect global oil prices and energy security
Am holding WTI OIL low buy and will continue until the break of demand floor and might add more buy if the sentiment holds buy idea.
Trading OIL AND GAS is 100% probability , No one can tell the next crisis and global energy supply disruption.
Manage your risk.

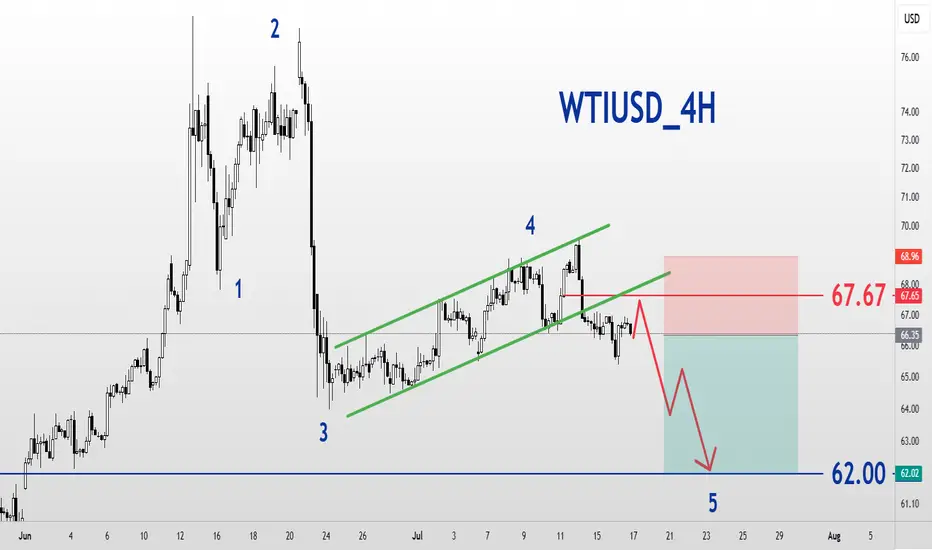
WTIUSD_4H_SellWest Texas Intermediate Oil Analysis
Short-term Time Frame
Elliott Wave Analysis Style
The market can only continue to decline by holding the resistance at 67.67 and moving towards the target of wave 5 at $62.
USOILBullish senaorio
"BUY Call / Long – Strong upside trend across most timeframes, supported by disrupted supply, elevated oil prices due to real production losses, and renewed geopolitical risk."

Crude oil extends fallsThe crude oil market has entered a fragile and uncertain phase, with prices retreating from recent highs. While WTI crude is still holding above the critical $65 mark on a closing basis, it was below this handle at the time of writing. So, the overall tone remains cautious, with a bearish tilt expected to persist in the near term.
Technical Outlook: WTI Breaks Key Support
The WTI crude chart shows a breakdown of a short-term bullish trend line, and lower lows. The price failed to reclaim the 200-day moving average and found strong resistance since. Currently, it is testing support around $65.00. A daily close below this level could trigger further bearish momentum, with the next support zones seen at $64, and then the next round handles below that. $60 per barrel could be reached if the macro backdrop doesn't improve.
Geopolitical Factors: Trump’s Tariff Threats Dismissed
Donald Trump’s threats of 100% tariffs on countries buying Russian oil sparked initial concern but were ultimately shrugged off by the market. Traders interpreted the 50-day delay in enforcement and Trump’s historical pattern of backing off such threats as signs that immediate supply disruptions were unlikely.
OPEC+ Strategy: Supply Returning to the Market
OPEC+ has announced a larger-than-expected production increase of 548,000 bpd for August, with another 550,000 bpd potentially coming in September. This roll-back of earlier voluntary cuts aims to recapture market share, especially as U.S. shale production slows. However, the added supply may cap price gains, particularly as demand is expected to ease after the peak U.S. driving season.
By Fawad Razaqzada, Market Analyst with FOREX.com
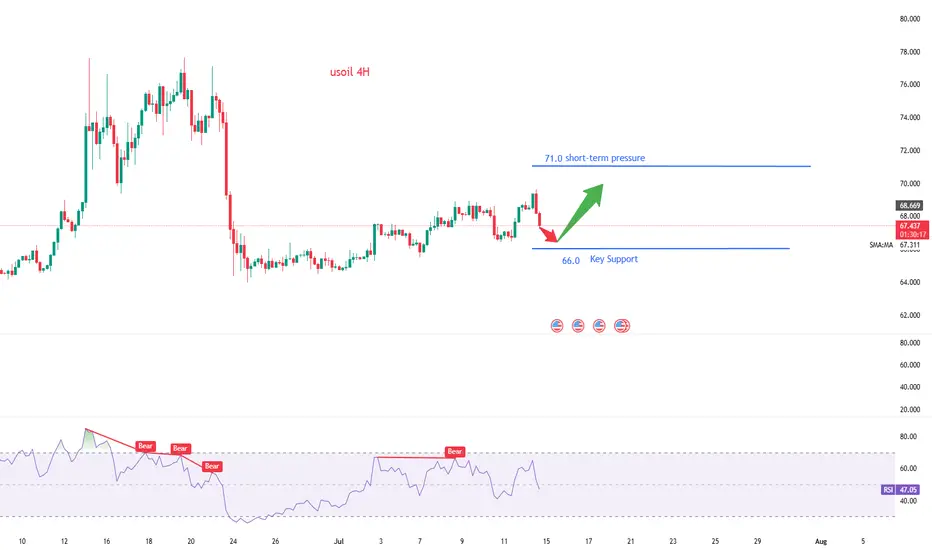
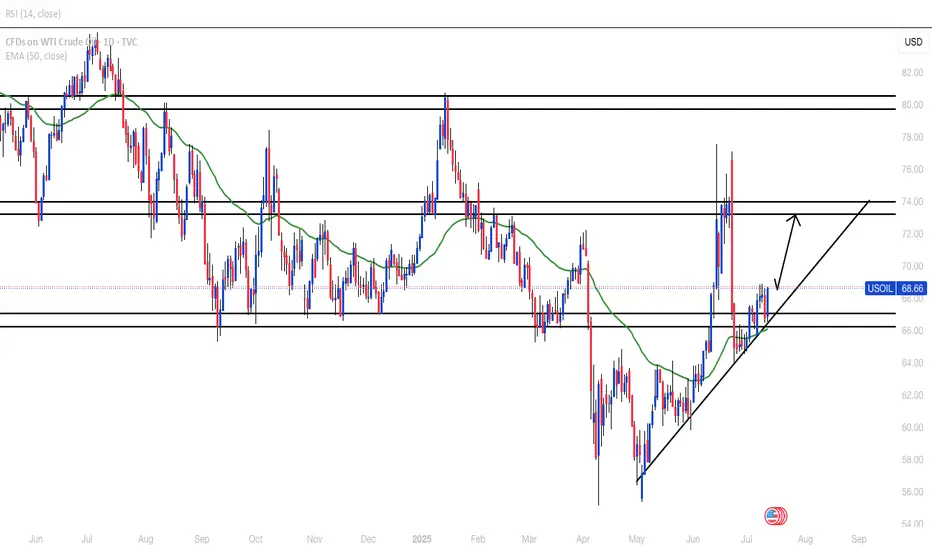
Crude oil awaits upward breakthrough
💡Message Strategy
Inventory data provides short-term support, but it is difficult to change the trend
Although oil prices are under pressure overall, inventory data released by the U.S. Energy Information Administration (EIA) show that as of last week, U.S. gasoline and distillate inventories have dropped significantly, while gasoline consumption has increased by 6% month-on-month to 9.2 million barrels per day, indicating that the summer driving peak has brought short-term positive factors.
In addition, global aviation demand has also become an important variable to boost market sentiment. JPMorgan Chase pointed out in a client report: "In the first eight days of July, the global daily number of flights reached an average of 107,600, a record high, among which aviation activities in Asian countries have recovered to the peak in nearly five months."
The bank also expects that the average daily global crude oil demand growth this year will be 970,000 barrels, which is basically consistent with its forecast of 1 million barrels at the beginning of the year, indicating that although the consumption end is under pressure, it has not yet experienced a cliff-like decline.
📊Technical aspects
The short-term (4H) trend of crude oil breaks through the upper resistance of the range and runs in an upward trend. The moving average system is arranged in a bullish pattern, and the short-term objective trend direction is upward. The MACD indicator opens upward above the zero axis, and the bullish momentum is sufficient. The oil price fluctuates in a narrow range, and it is expected that the crude oil will continue to rise.
In terms of operation, crude oil is mainly long at a low level. If it rises to the target point, the direction will be selected according to the pattern and continued attention will be paid.
💰Strategy Package
Long Position:65.50-66.50,SL:64.00,Target:69.00-70.00

USOILBroke below strong daily support zone for about two months but came back above and looks to have retested the zone properly. Minor H4/H1 resistance around 66.70 that needs to be broken before possibly moving higher.
CRUDE OIL BEARISH BREAKOUT|SHORT|
✅CRUDE OIL broke the rising
Support line which is now a resistance
And the price made a retest an a pullback
So we we are bearish biased and we
Will be expecting a further
Bearish move down
SHORT🔥
✅Like and subscribe to never miss a new idea!✅
Disclosure: I am part of Trade Nation's Influencer program and receive a monthly fee for using their TradingView charts in my analysis.

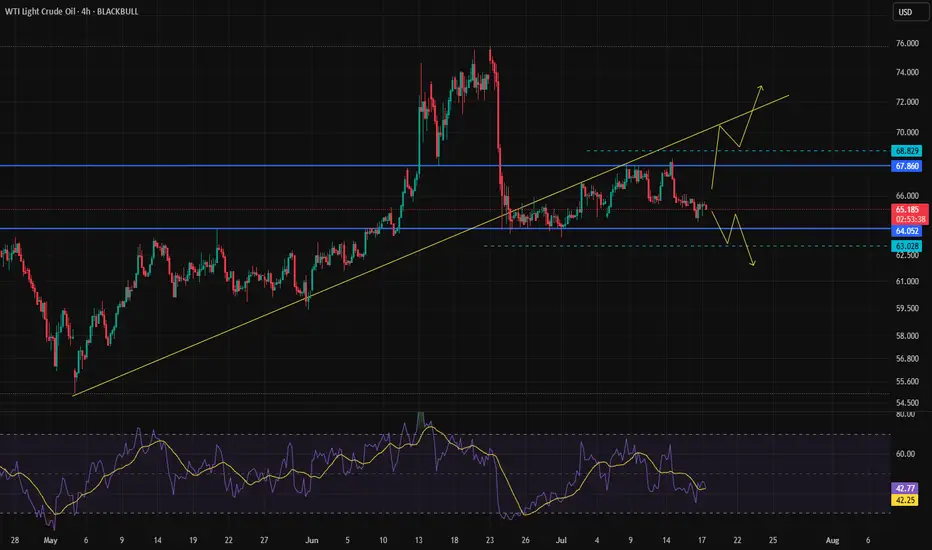
BRENT CRUDE OIL FORMED A BEARISH WEDGE. ANOTHER POSSIBLE DECLINEBRENT CRUDE OIL FORMED A BEARISH WEDGE. ANOTHER POSSIBLE DECLINE?📉
USOIL has been trading bullish within the last couple of days, supported by prospects of tighter supply and an improved demand outlook. US crude inventories dropped last week, which indicates firm demand despite the rising output.
Still, technically, oil looks bearish. It has formed a bearish wedge and is currently testing the former trendline from below. The most probable scenario is that wee see the bearish impulse towards 6,500.00 with further decline. Another option is that the rise will continue towards 6,900.00 level.

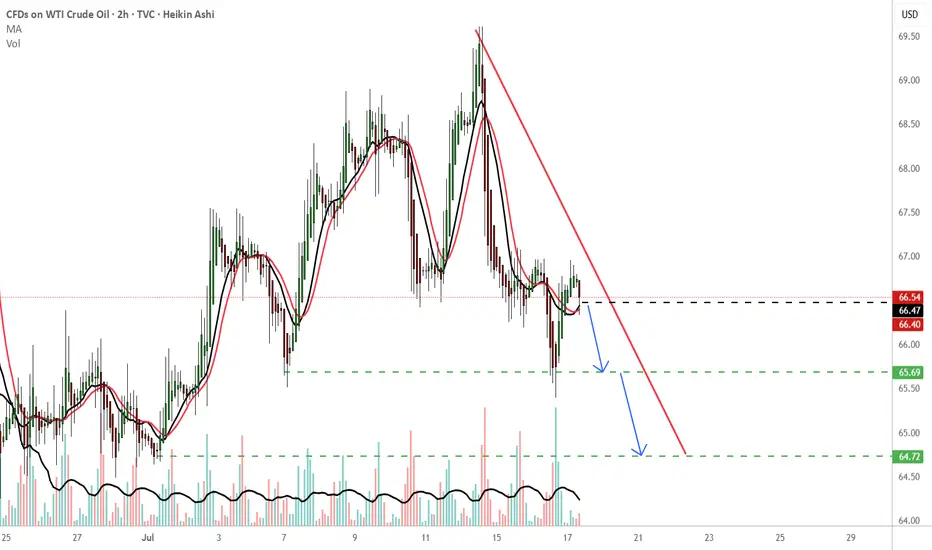
USOILShort short short !!!
-65.69 TP
-64.72 TP2
As long as it's bearish and doesn't close above the red line, assume bearish. The green dotted lines also can suggest demand zones which could suggest a change in direction (bullish soldiers) will enter the battlefield. Trade with focus and follow your trading plan.
THOUGHTS???????