The price has a strong bearish momentum, could it drop further?WTI Oil (XTI/USD) is rising towards the pivot, which acts as an overlap resistance and could reverse to the 1st support, which is a pullback support.
Pivot: 65.43
1st Support: 55.63
1st Resistance: 71.37
Risk Warning:
Trading Forex and CFDs carries a high level of risk to your capital and you should only trade with money you can afford to lose. Trading Forex and CFDs may not be suitable for all investors, so please ensure that you fully understand the risks involved and seek independent advice if necessary.
Disclaimer:
The above opinions given constitute general market commentary, and do not constitute the opinion or advice of IC Markets or any form of personal or investment advice.
Any opinions, news, research, analyses, prices, other information, or links to third-party sites contained on this website are provided on an "as-is" basis, are intended only to be informative, is not an advice nor a recommendation, nor research, or a record of our trading prices, or an offer of, or solicitation for a transaction in any financial instrument and thus should not be treated as such. The information provided does not involve any specific investment objectives, financial situation and needs of any specific person who may receive it. Please be aware, that past performance is not a reliable indicator of future performance and/or results. Past Performance or Forward-looking scenarios based upon the reasonable beliefs of the third-party provider are not a guarantee of future performance. Actual results may differ materially from those anticipated in forward-looking or past performance statements. IC Markets makes no representation or warranty and assumes no liability as to the accuracy or completeness of the information provided, nor any loss arising from any investment based on a recommendation, forecast or any information supplied by any third-party.
SPOTCRUDE trade ideas

US-Oil will further push upside After Testing TrendlineAt present, the price of crude oil is above the key technical level, and the geopolitical sentiment has also become more favorable, so the short-term outlook for crude oil is bullish. If the upcoming Sino-US meeting leads to a relaxation of trade tensions, the upward momentum is likely to accelerate. Unless OPEC+ unexpectedly increases the supply, the target for the next few trading days may be set at $63 and higher. Crude oil opened lower this week and then rebounded. The weekly candlestick closed as a large positive candlestick, approaching the resistance of the 5-week moving average. On the daily chart, after the second pullback, the price rebounded upwards without breaking the low point. $64.80 is a key watershed. Below this level, there is still a possibility of a bearish trend. In the short term, the trend is bullish. Overall, it is expected to rise first and then fall next week. Pay attention to the resistance at $63.50 and go short, and set the stop-loss with the position of $64.80 for a bearish outlook.
you are currently struggling with losses, or are unsure which of the numerous trading strategies to follow, at this moment, you can choose to observe the operations within our channel.

WTI - Technical Setup Points to April HighsThe US Light Crude chart is displaying promising bullish momentum after establishing a significant double bottom at the $56 support zone. Following a sharp recovery from recent lows, the price has broken above key resistance levels and is currently trading around $61,27 with the green arrow indicating potential continuation to the upside. Technical patterns suggest there is a higher probability that crude oil prices will extend this rally toward the local top formed on April 23rd near $65, completing a broader recovery pattern. With strengthening momentum indicators and improved market sentiment, this upward move appears well-supported, especially if crude can maintain position above the current consolidation range and continue forming higher lows on the daily timeframe.
Disclosure: I am part of Trade Nation's Influencer program and receive a monthly fee for using their TradingView charts in my analysis.

USOIL What Next? SELL!
My dear subscribers,
This is my opinion on the USOIL next move:
The instrument tests an important psychological level 60.99
Bias - Bearish
Technical Indicators: Supper Trend gives a precise Bearish signal, while Pivot Point HL predicts price changes and potential reversals in the market.
Target - 58.63
My Stop Loss - 62.11
About Used Indicators:
On the subsequent day, trading above the pivot point is thought to indicate ongoing bullish sentiment, while trading below the pivot point indicates bearish sentiment.
Disclosure: I am part of Trade Nation's Influencer program and receive a monthly fee for using their TradingView charts in my analysis.
———————————
WISH YOU ALL LUCK

USOIL GROWTH AHEAD|LONG|
✅CRUDE OIL made a bullish
Breakout of the key horizontal
Level around 60.00$ and the
Breakout is confirmed so we
Are bullish biased and we
Will be expecting a further
Bullish continuation
LONG🚀
✅Like and subscribe to never miss a new idea!✅
Disclosure: I am part of Trade Nation's Influencer program and receive a monthly fee for using their TradingView charts in my analysis.

US-Oil will further push upside After Testing TrendlineHello Traders
In This Chart XTIUSD HOURLY Forex Forecast By FOREX PLANET
today XTIUSD analysis 👆
🟢This Chart includes_ (XTIUSD market update)
🟢What is The Next Opportunity on XTIUSD Market
🟢how to Enter to the Valid Entry With Assurance Profit
This CHART is For Trader's that Want to Improve Their Technical Analysis Skills and Their Trading By Understanding How To Analyze The Market Using Multiple Timeframes and Understanding The Bigger Picture on the Charts

WTI on high time frame
"Hello traders, focusing on WTI, the price is currently at a critical level of $62.
Candle formations on high time frames indicate a higher probability of the price declining to $53.
Given the influence of political and geopolitical news, there may be increased volatility in the price. This analysis will be updated accordingly."
If you have any more details to add or need further assistance, please feel free to let me know!

USOIL: Target Is Up! Long!
My dear friends,
Today we will analyse USOIL together☺️
The in-trend continuation seems likely as the current long-term trend appears to be strong, and price is holding above a key level of 60.99 So a bullish continuation seems plausible, targeting the next high. We should enter on confirmation, and place a stop-loss beyond the recent swing level.
❤️Sending you lots of Love and Hugs❤️

CRUDE OIL Bullish Breakout! Buy!
Hello,Traders!
CRUDE OIL is making a bullish
Correction from the lows and
The price made a bullish
Breakout of the key horizontal
Level of 60.10$ then made a
Retest and a rebound so we
Are bullish biased and we will
Be expecting a further bullish
Continuation on Monday
Buy!
Comment and subscribe to help us grow!
Check out other forecasts below too!
Disclosure: I am part of Trade Nation's Influencer program and receive a monthly fee for using their TradingView charts in my analysis.

USOIL: Expecting Bearish Movement! Here is Why:
The charts are full of distraction, disturbance and are a graveyard of fear and greed which shall not cloud our judgement on the current state of affairs in the USOIL pair price action which suggests a high likelihood of a coming move down.
Disclosure: I am part of Trade Nation's Influencer program and receive a monthly fee for using their TradingView charts in my analysis.
❤️ Please, support our work with like & comment! ❤️

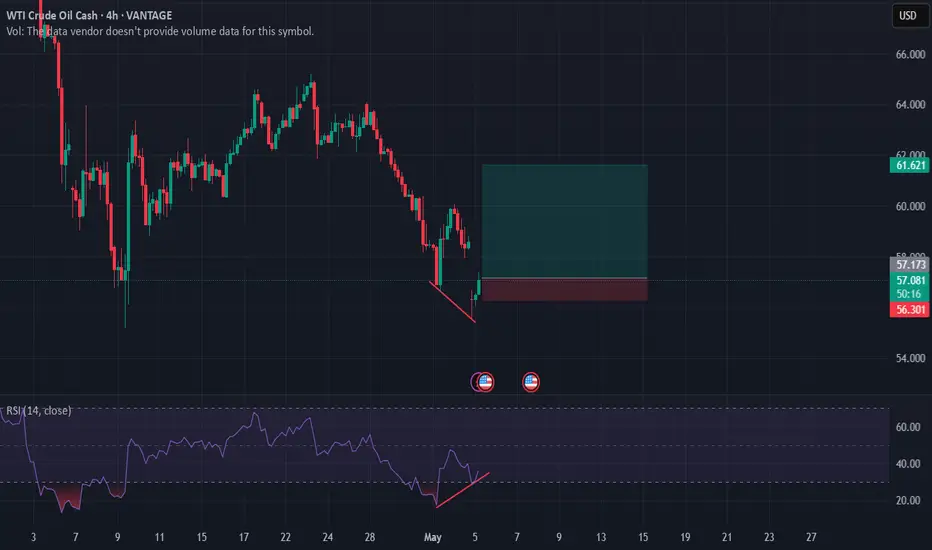
WTI crude (USOUSD) short continuation .. the week of 12 MayWill price retest the support/resistance zone one more time? That is what I am hoping for. Note that we have been seeing consistently lower highs. Price then broke below the zone, did one retest already and seems to be trying to retest it once again. I am looking for price to enter the zone and then give me some bearish evidence.
Stop – above the zone
1st target can be at 57.00 with the possibility to take this down to 52.00
This is not a trade recommendation; it’s merely my own analysis. Trading carries a high level of risk, carefully manage your capital and risk. If you like my idea, please give a “boost” and follow me to get even more.
It’s not whether you are right or wrong, but how much money you make when you are right and how much you lose when you are wrong – George Soros

Oil Price Decline Using the Shark Harmonic PatternBased on the Shark Harmonic pattern, there’s a potential for a decline in oil prices. Traders and analysts, stay alert for market shifts and adjust strategies accordingly.
The Shark harmonic pattern offers a structured approach to identifying potential price reversals in the oil market. By analyzing Fibonacci ratios and price movements, traders can assess the probability of a decline in oil prices and position themselves accordingly.
However, as with any technical tool, it is crucial to use the Shark pattern as part of a broader analysis framework to account for market complexities and external influences.

Thursday 5/8 Oil LONG ENTRY 12pm Thursday Oil Long,
retest of 78.6 Fib retracement level
Early close Friday before Market close
Oil could possibly hold bullish momentum
initial TP: 62,000

Oil Analysis: WTI Approaches the $60 Level AgainOver the past two trading sessions, oil has gained more than 4.5%, and is once again approaching the psychological barrier of $60 per barrel. This recent bullish movement persists despite OPEC+’s clear stance on increasing supply in June and the International Energy Agency’s (IEA) cautious outlook on global oil demand for the remainder of the year. As such, it appears that oil prices are currently benefiting from improving market sentiment, particularly as investors await the outcome of the upcoming U.S.–China trade negotiations.
Persistent Bearish Trend
Since mid-January, oil has maintained a steady downtrend, and so far, minor bullish retracements have not been strong enough to signal a meaningful reversal. Therefore, this downward technical formation remains the dominant structure to monitor in upcoming trading sessions.
RSI
The Relative Strength Index (RSI) continues to hover around the 50 level, indicating a sustained balance between bullish and bearish momentum. As long as this equilibrium remains, a neutral bias could dominate short-term price movements.
ADX
The Average Directional Index (ADX) remains close to the 40 mark, though the line has recently begun to flatten. This could be interpreted as a sign of weakening trend strength in the short term, likely due to the price currently testing a significant resistance zone.
Key Levels to Watch:
$60 – Nearby resistance: A short-term psychological level. A break above this zone could reactivate a bullish bias and potentially lead to the formation of a new short-term uptrend.
$63 – Main resistance: Aligned with the 50-period moving average. Sustained price action above this level could challenge the prevailing long-term bearish structure.
$57 – Nearby support: A zone that matches recent multi-week lows. A drop below this level could reinforce bearish momentum and provide more room for the current downtrend to extend.
Written by Julian Pineda, CFA – Market Analyst

WTI Wave Analysis – 9 May 2025
- WTI reversed from support area
- Likely to rise to resistance level 62.00
WTI crude oil recently reversed up from the strong support area between the support level 54.90 (which stopped wave 3 at the start of April) and the lower daily Bollinger Band.
The upward reversal from this support area stopped the previous impulse waves 5 and (3).
WTI crude oil can be expected to rise to the next resistance level 62.00 (former minor support from the middle of April).

Bearish Look for potential Reversal bearish candlestick Pattern formation upon the retest of daily supply zone.

USOIL SENDS CLEAR BEARISH SIGNALS|SHORT
USOIL SIGNAL
Trade Direction: short
Entry Level: 61.08
Target Level: 55.63
Stop Loss: 64.68
RISK PROFILE
Risk level: medium
Suggested risk: 1%
Timeframe: 8h
Disclosure: I am part of Trade Nation's Influencer program and receive a monthly fee for using their TradingView charts in my analysis.
✅LIKE AND COMMENT MY IDEAS✅

USOILOPEC+ decisions have a significant and multifaceted impact on oil prices in the near future:
Short-Term Impact
Supply Increases Lead to Price Drops:
Recently, OPEC+ agreed to increase oil production by about 411,000 barrels per day in May 2025, with plans to accelerate output hikes further in June and beyond, potentially adding up to 2.2 million barrels per day by November. This surge in supply amid weakening global demand, especially due to escalating U.S.-China trade tensions, has already caused oil prices to plunge to multi-year lows
Market Surplus Pressure:
The increased production is expected to exacerbate an existing surplus, putting downward pressure on prices in the near term unless demand recovers.
Medium to Long-Term Impact
Market Stability Through Gradual Adjustments:
OPEC+’s cautious, phased approach to increasing production aims to reduce volatility and stabilize the market over time. By managing supply carefully, OPEC+ attempts to balance between preventing sharp price drops and avoiding excessive shortages.
Dependence on Global Demand Trajectory:
The effectiveness of OPEC+’s strategy heavily depends on global demand, which faces headwinds from the energy transition toward renewables and climate policies like the Paris Accord. If demand declines faster than expected, OPEC+ may need to adjust production cuts or increases accordingly.
Geopolitical and Strategic Considerations:
OPEC+ decisions also have geopolitical implications, influencing relations between member states and global powers. For example, Saudi Arabia’s recent moves to discipline overproducing members like Iraq and Kazakhstan reflect internal dynamics that affect production policies. Additionally, OPEC+ output decisions are intertwined with U.S.-Saudi relations and broader energy security considerations.
Market Reaction Dynamics
Volatility Around Announcements:
OPEC+ meetings typically trigger immediate price volatility, with oil prices moving 3-7% depending on the size of production adjustments and market expectations.
Trading Algorithms and Futures Positioning:
Automated trading and futures market positioning amplify price swings around OPEC+ announcements.
Hedging and Seasonal Effects:
Consumer industries adjust hedging strategies based on OPEC+ signals, and seasonal demand (e.g., summer driving season) also influences price sensitivity
In essence:
OPEC+’s near-future decisions to accelerate oil output hikes are currently driving prices lower by increasing supply amid fragile demand. However, their gradual and flexible approach aims to stabilize the market over time. The ultimate impact on prices will depend on how global demand evolves, geopolitical dynamics within OPEC+, and the broader energy transition.

USOILCurrent USOIL Price Drop (May 2025)
WTI crude oil (USOIL) has declined sharply in early May 2025, Key drivers include:
OPEC+ Surprise Supply Increase: OPEC+ announced plans to raise output in June, reversing earlier production cuts and flooding the market with additional barrels.
Tariff-Driven Demand Fears: U.S.-China trade tensions and retaliatory tariffs threaten global economic growth, reducing oil demand forecasts.
Dollar Strength: The U.S. dollar (DXY) has rebounded due to delayed Fed rate cuts and safe-haven demand, pressuring dollar-denominated oil prices.
EIA/Goldman Sachs Forecasts: The U.S. Energy Information Administration (EIA) and Goldman Sachs revised 2025–2026 oil price forecasts downward, citing oversupply risks and weaker demand.
Shifting Dollar-Oil Correlation
Historically, oil and the dollar were inversely correlated (strong dollar = lower oil prices). However, this relationship is weakening due to:
U.S. as a Net Oil Exporter: The U.S. is now the world’s largest crude producer. Higher oil prices improve the U.S. trade balance (vs. worsening it when the U.S. was a net importer).
Petrodollar Dynamics: As the U.S. exports more oil, revenue from oil sales strengthens the dollar, creating a positive correlation in certain scenarios.
Geopolitical and Policy Shocks: Tariffs, OPEC+ decisions, and Fed policy now dominate price action, overshadowing traditional correlations.
Future Directional Bias
Bearish Factors
OPEC+ Supply Surge: Increased production (post-June 2025) could push prices toward $50–$55/barrel (Goldman Sachs base case).
Recession Risks: Weak demand from China/Europe and U.S. tariff impacts may trigger a global slowdown, further depressing oil prices.
Dollar Strength: Fed rate cuts delayed until July 2025 or later could sustain dollar strength, capping oil’s upside.
Bullish Catalysts
Supply Disruptions: Escalating Middle East tensions or OPEC+ policy reversals could tighten supply.
Weaker Dollar: If the Fed signals rate cuts or tariffs ease, dollar weakness could lift oil prices.
Outlook:
USOIL faces downside risks in the near term due to oversupply and demand concern
Exogenous Shocks: Exogenous shocks to the U.S. real interest rate can cause a modest and short-lived decline in the real price of oil. Although there is a higher opportunity cost of holding inventories, oil inventories may increase, reflecting the decline in global real activity associated with higher U.S. real interest rate

USOIL Bulls Eye Breakout – Can Momentum Carry It to $64The 4-hour chart of USOIL shows a market that has recently experienced a sharp decline, followed by a consolidation phase near a key support level. This key support zone is clearly defined at 55.21 USD, where the price found strong buying interest and bounced back up. From there, the market started to climb, attempting to form a potential short-term bottom.
The price is now approaching a previous trendline, which used to act as support during the uptrend and is now being retested as resistance. This retest area overlaps with horizontal resistance at around 60.00 USD, making it a critical decision zone. The two red arrows in the image mark failed attempts to break higher, indicating sellers are still active at this level.
If the price manages to break through this resistance with strength, the next likely objective is Target 1, set at 64.76 USD. This level coincides with the prior support that was broken during the selloff and could now act as a strong resistance. Beyond that, Target 2 at 72.44 USD marks a major resistance zone from which the last downtrend began.
From a trade setup perspective, the chart suggests a bullish opportunity:
The entry is near 59.98 USD, just above the short-term consolidation area, ideally after a breakout.
The stop loss is placed just below the recent swing low, at around 57.82 USD, providing room for volatility without exposing the trade to unnecessary risk.
The take profit is positioned at 64.76 USD, giving this trade a clear structure with a risk-to-reward ratio of about 1:3.75, which aligns well with strong risk management principles.
Additionally, the MACD indicator at the bottom supports the bullish bias. It shows a recent crossover of the MACD line above the signal line, with a rising histogram—indicating building upward momentum.
In summary, this chart presents a well-structured bullish setup with a favorable risk-to-reward ratio, clear entry and exit levels, and supporting momentum signals. However, the region around the trendline retest remains crucial. A strong close above this zone would confirm the breakout, while another rejection could signal the need for caution or reevaluation.

USOIL:Strategic Analysis on ThursdayThe Ministry of Energy of Kazakhstan stated that the country has no plans to cut oil production in May. The country has continuously exceeded production limits, creating tensions within OPEC+. The Ministry of Energy in Astana said that the largest oil-producing country in Central Asia will have an average daily production of crude oil and condensate of 277,000 tons in May, remaining the same as in April, while the average daily production in March was 260,000 tons. OPEC+ has agreed to significantly increase production for two consecutive months, surprising traders and pushing down oil prices. This move is largely driven by Saudi Arabia, the leader of OPEC, which hopes to punish member states such as Kazakhstan that have continuously exceeded production limits. Crude oil has shown a trend of stabilizing and rebounding at a low level today, stabilizing and rising around $57.7, and showing a volatile upward trend. The key today is whether the upward trend of crude oil can continue to break above the level of $60.6.
you are currently struggling with losses, or are unsure which of the numerous trading strategies to follow, at this moment, you can choose to observe the operations within our channel.

Short term correction.If within the next hour we close above the previous candle, there will be a good opportunity to go long.
A CLEAR SELL SET UP ON USOILUSOIL is currently on down trend , it break a structure and retested it the first time , it is about to retest it the second time for a potential sell(distribution)
