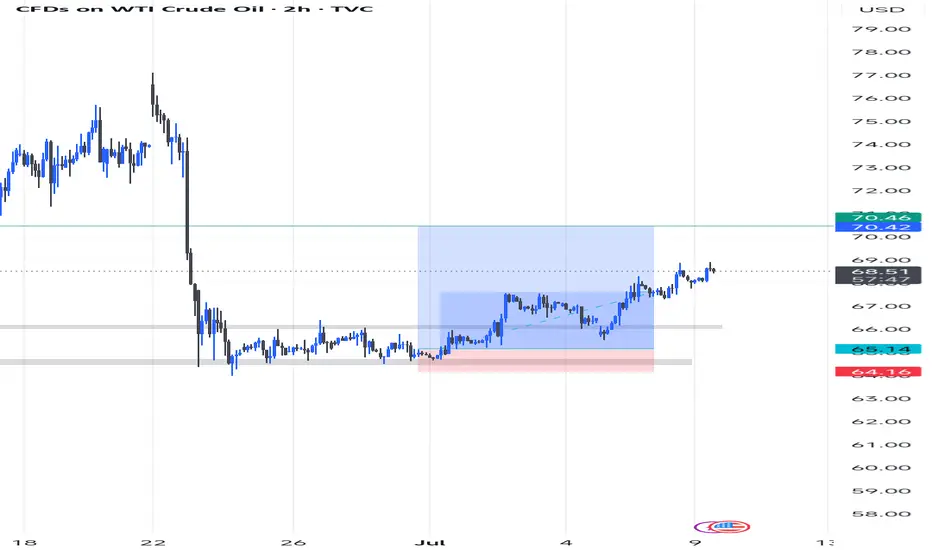
CRUDE OIL (WTI): Move Up Ahead!
Last week, I already shared a bullish setup on WTI Crude Oil
on a daily time frame.
I see a strong intraday bullish confirmation today.
After a test of an underlined blue support area,
the price went up strongly and violated a resistance line
of a bullish flag pattern on a 4H time frame.
The market is going to rise more.
Goal - 68.2
❤️Please, support my work with like, thank you!❤️
I am part of Trade Nation's Influencer program and receive a monthly fee for using their TradingView charts in my analysis.
SPOTCRUDE trade ideas

Crude Oil Eyes Bullish Breakout – Demand Zone Holding StrongCrude Oil (USOIL) is forming a potential bullish reversal structure on the 1H timeframe, supported by repeated bounces from a well-respected demand zone. Price currently consolidates below the key resistance level with a visible expanding channel, hinting at possible volatility and breakout.
🔹 Trade Idea:
I’m waiting for a clear break and close above 66.50 for a valid long entry. The setup remains invalid unless price confirms this breakout.
🔹 Technical Highlights:
- Strong demand zone held price multiple times
- Formation of higher impulses with retracements aligning well with Fibonacci levels
- Market structure suggests a continuation toward upper targets if 66.50 is broken with momentum
🔹 Trade Plan:
- Buy Above: 66.50 (breakout confirmation)
- Stop Loss: 64.40 (below demand zone and structure support)
- Target: 69.00 (near 2.272 Fibonacci extension)
⚠️ Note: No entry unless 66.50 is broken convincingly. Setup favors disciplined execution only on confirmation.

Usoil buy trade am holding since last week📈 USOIL Trade Update – Long Position Holding Strong Since Last Week 🔥
Guess I didn't post this last week...
Caught this buy from the demand zone around $64.16, with a clean structure shift and bullish momentum confirmation.
The market is respecting structure with higher highs and higher lows forming beautifully. As price approaches my target zone, I’m locking in profits and managing risk. Trade has been running smoothly for days 💪🏽
SL at break even now, Holding patiently for that final push to the $70+ area. Let's see how the market reacts at that key zone.
Crude oil shock trend direction
💡Message Strategy
During the European trading session on Monday, the West Texas Intermediate (WTI) crude oil futures on the New York Mercantile Exchange recovered the previous losses and rebounded to around $67.50 per barrel. Although OPEC+ confirmed that the increase in oil production in August will be higher than expected, oil prices still rebounded.
From the daily chart level, the medium-term trend of crude oil fluctuated upward and tested around 78. The K-line closed with a large real negative line, which has not yet destroyed the moving average system and is still supported. The medium-term objective upward trend remains unchanged. However, from the perspective of momentum, the MACD indicator crosses downward above the zero axis, indicating that the bullish momentum is weakening. It is expected that the medium-term trend of crude oil will fall into a high-level oscillating upward pattern.
📊Technical aspects
The short-term (1H) trend of crude oil failed to continue to hit a new low and showed a rebound rhythm. The oil price crossed the moving average system, and the short-term objective trend entered a transition period. From the perspective of momentum, the MACD indicator crossed the zero axis, and the red column indicated that the bullish momentum was sufficient. At present, the price is running in a wide range, with a range of 65.50-67.80. It is expected that the trend of crude oil will repeatedly test the upper edge of the range within the range.
💰Strategy Package
Long Position:67.00-67.50,SL:65.50,Target:70.00

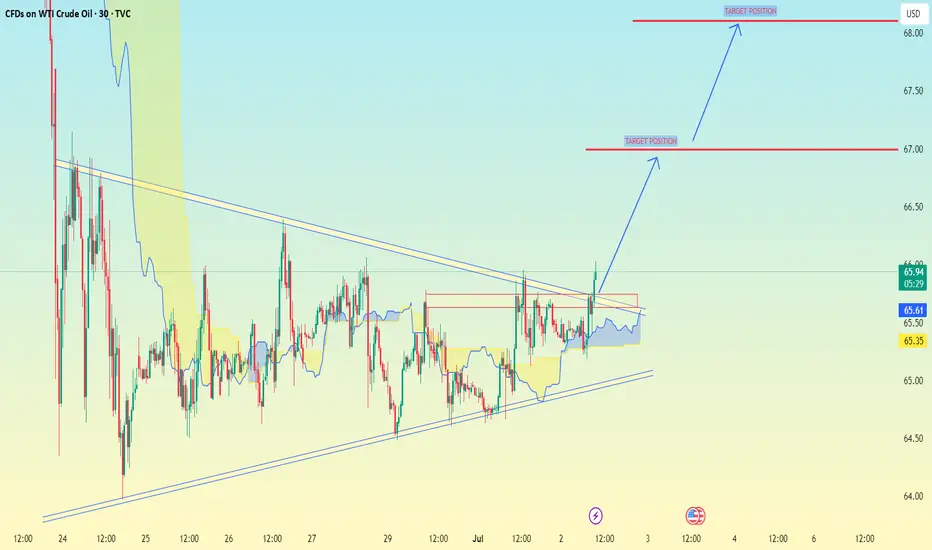
(WTI Crude Oil) on the 30-minute timeframe:(WTI Crude Oil) on the 30-minute timeframe:
You have a clear triangle breakout happening.
The chart shows two bullish target positions marked with blue arrows.
Based on your chart:
Current Price Zone: Around 66.20 - 66.25
Target Levels:
✅ First Target: 67.00
✅ Second Target: 68.00 - 68.10
---
Summary Trading Idea:
Breakout above resistance trendline confirmed.
First resistance and partial target at 67.00
Final target near 68.00 - 68.10, where the next significant resistance lies.
Let me know if you want stop-loss suggestions or a detailed entry strategy.
Momentum Cools as Oil Eyes Reentry From $67.6FenzoFx—Crude Oil bounced from $66.2, a support backed by the volume profile point of interest, but lost momentum after hitting the bearish FVG.
Currently trading near $68.2 with Stochastic overbought. A pullback to $67.6 can offer a low-risk reentry. The bullish bias remains intact above $65.2, with $70.3 as the next target.

Sell oil here after decrearse tension in middle east I Can see notable price action for going to sell on oil

Crude oil continues to fluctuate upward
💡Message Strategy
OPEC+, led by Asian countries, announced on Saturday that it would increase production by an additional 548,000 barrels per day from next month, more than 30% higher than market expectations of 411,000 barrels per day, accelerating the pace of resumption of production after the production cuts in 2023.
In addition to supply-side factors, demand prospects are also affected by trade concerns. U.S. Commerce Secretary Howard Lutnick said that the country-specific tariffs that the Trump administration intends to implement will officially take effect on August 1, later than the previously scheduled July 9, leaving trading partners with a short breathing space.
Market concerns about the impact of this policy on crude oil consumption have intensified, especially among importing countries, mainly Asian countries.
Confidence in the Asian market remains, and Saudi Arabia raises prices to Asia
Despite the increase in supply, OPEC+ still emphasized in its statement that "the global economic outlook is stable and the market fundamentals are healthy." As a signal of confidence, Saudi Arabia has raised the prices of major crude oil varieties for Asian customers, indicating that it believes that the Asian market has the ability to absorb additional supply.
According to OPEC+ representatives, the alliance will consider whether to increase supply by another 548,000 barrels per day in September at its next meeting on August 3, thereby fully restoring the 2.2 million barrels per day quota cut last year.
📊Technical aspects
From the daily chart level, crude oil fluctuates upward and tests around 75 in the medium term. The K-line closes with a large real negative line, which has not yet destroyed the moving average system and is still supported. The medium-term objective trend remains upward. However, from the perspective of momentum, the MACD indicator crosses downward above the zero axis, indicating that the bullish momentum is weakened. It is expected that the medium-term trend of crude oil will fall into a high-level oscillation pattern.
After the short-term (4H) trend of crude oil fluctuates and consolidates, it turns into an upward rhythm. The moving average system is arranged in short positions, and the short-term objective trend is upward. The MACD indicator fast and slow lines cross the zero axis, and the bullish momentum is full. It is expected that the crude oil trend will continue to rise after a slight rebound during the day.
💰Strategy Package
Long Position:66.00-67.00,SL:65.00,Target:69.00-70.00

USOIL:Today's Trading Strategy
Oil prices have signs of upward breakthrough at present, yesterday's trend broke the short - term narrow range of shock range, on the idea of retracting to do more. The more appropriate long point is 66-66.3, if short, the more appropriate point is 67-67.4, but the short position is recommended not to be too heavy, not to do less than the point.
Trading Strategy:
SELL@67-67.4
TP: 66-66.3
BUY@66-66.3
TP: 67.5-68
More detailed strategies and trading will be notified here ↗↗↗
Keep updated, come to "get" ↗↗↗

US Oil - July WK#2 ExpectationsNYSE:TVC :
USOIL Last trade close @ $66.5.
Expected to start the week @ $68.xx.
The formation of cup & handle shape lead to continuous increase to start hitting 1st Target @ $70.
Trump will announce Tariffs implementation will support increasing prices.

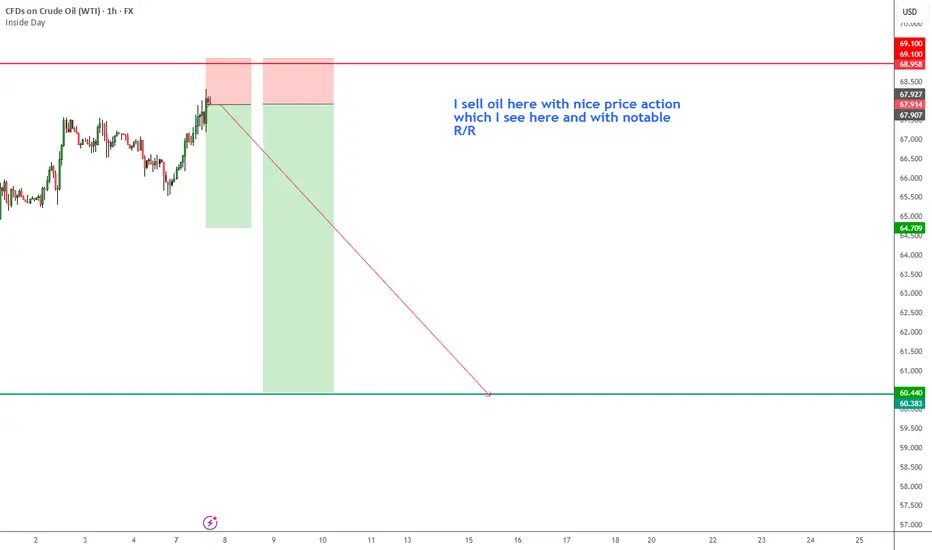
USOIL Technical Analysis! BUY!
My dear followers,
This is my opinion on the USOIL next move:
The asset is approaching an important pivot point 66.40
Bias - Bullish
Safe Stop Loss - 65.78
Technical Indicators: Supper Trend generates a clear long signal while Pivot Point HL is currently determining the overall Bullish trend of the market.
Goal - 67.32
About Used Indicators:
For more efficient signals, super-trend is used in combination with other indicators like Pivot Points.
Disclosure: I am part of Trade Nation's Influencer program and receive a monthly fee for using their TradingView charts in my analysis.
———————————
WISH YOU ALL LUCK
WTI Support & Resistance Levels🚀 Here are some key zones I've identified on the 15m timeframe.
These zones are based on real-time data analysis performed by a custom software I personally developed.
The tool is designed to scan the market continuously and highlight potential areas of interest based on price action behavior and volume dynamics.
Your feedback is welcome!
USOIL: Bearish Continuation & Short Trade
USOIL
- Classic bearish setup
- Our team expects bearish continuation
SUGGESTED TRADE:
Swing Trade
Short USOI
Entry Point - 68.66
Stop Loss - 69.40
Take Profit - 67.23
Our Risk - 1%
Start protection of your profits from lower levels
Disclosure: I am part of Trade Nation's Influencer program and receive a monthly fee for using their TradingView charts in my analysis.
❤️ Please, support our work with like & comment! ❤️

USOIL🛢️ USOIL (WTI Crude Oil) – Technical Outlook & Forecast
Current Price: $64.55
Bias: Bullish Only
Forecast Levels: $82.00 → $85.00 → $90.00+
🔍 Market Overview:
Crude oil (USOIL) is currently trading around $64.55, showing early signs of a potential bullish reversal from multi-month lows. Despite recent volatility and macroeconomic uncertainties, the technical structure indicates the formation of a solid accumulation base, potentially preparing for a significant upward move.
📈 Technical Perspective:
Price Action: Oil is attempting to reclaim key support zones that have held historically during large-scale recoveries.
Momentum: Oscillators (like RSI/MACD) may be turning up from oversold territory (subject to chart confirmation), further supporting the bullish scenario.
Volume Profile: Accumulation at lower levels hints at smart money interest around the $60–$65 zone.
🎯 Bullish Targets:
$82.00 – Psychological and technical resistance
$85.00 – Previous swing high / Fib extension zone
$90.00+ – Medium-term projection if momentum sustains
🧭 Conclusion:
The bias for USOIL remains bullish only while the $60–$62 zone holds firm as support. Breakout above near-term resistances could open the way for a strong move toward $82, $85, and even $90+. Keep an eye on macro events and inventory data for short-term volatility.
🟢 Trade Setup Idea (For Reference Only):
Long bias above $64–$65 support zone, targeting $82–$90 over the coming weeks/months. Use proper risk management.

Crude Oil Eyes 3-Year Resistance Once AgainWTI has rebounded cleanly from the neckline of an inverted head-and-shoulders pattern—formed ahead of the June Middle East conflict—establishing a strong support zone above $63.40.
Prices are currently trading above $67. A sustained hold above this level could target $69 and $72, aligning with the upper edge of the 3-year declining channel. A confirmed breakout above $72 may extend gains toward $78, $80, $84, and $88 respectively.
On the downside, a close below $63.80 may trigger renewed selling pressure toward $60, $58, and $56—within the mid-zone of the broader down trending channel.
- Razan Hilal, CMT

WTI crude oil Wave Analysis – 8 July 2025- WTI crude oil reversed from the support zone
- Likely to rise to resistance level 70.00
WTI crude oil recently reversed up from the support zone located between the key support level 64.55 (former resistance from the end of April), the lower daily Bollinger Band and the 61.8% Fibonacci correction of the upward impulse from May.
The upward reversal from this support zone started the active medium-term ABC correction (2).
WTI crude oil can be expected to rise to the next round resistance level 70.00 (target price for the completion of the active impulse wave i).

CRUDE OIL WTI LONG TRADE PLANThe instrument is trading in a global bull trend. It recently retested a strong confluence area. From this zone I expect the bullish rally to continue.
Please do your own analysis before placing any trades.
Cheers and Happy Trading !!!

OIL Bouncing at SupportLooking for a short bounce on US Oil here after a massive sell off earlier this week when the ceasefire was announced in the middle east. Again this is a short, countertrend bounce trade . Once you get a few percent, take your profits and get out.

WTI Oil H4 | Heading into a pullback resistanceWTI oil (USOIL) could rise towards a pullback resistance and potentially reverse off this level to drop lower.
Sell entry is at 68.28 which is a pullback resistance.
Stop loss is at 70.90 which is a level that sits above the 50% Fibonacci retracement and a pullback resistance.
Take profit is at 63.86 which is a pullback support that aligns closely with the 161.8% Fibonacci extension.
High Risk Investment Warning
Trading Forex/CFDs on margin carries a high level of risk and may not be suitable for all investors. Leverage can work against you.
Stratos Markets Limited (tradu.com ):
CFDs are complex instruments and come with a high risk of losing money rapidly due to leverage. 63% of retail investor accounts lose money when trading CFDs with this provider. You should consider whether you understand how CFDs work and whether you can afford to take the high risk of losing your money.
Stratos Europe Ltd (tradu.com ):
CFDs are complex instruments and come with a high risk of losing money rapidly due to leverage. 63% of retail investor accounts lose money when trading CFDs with this provider. You should consider whether you understand how CFDs work and whether you can afford to take the high risk of losing your money.
Stratos Global LLC (tradu.com ):
Losses can exceed deposits.
Please be advised that the information presented on TradingView is provided to Tradu (‘Company’, ‘we’) by a third-party provider (‘TFA Global Pte Ltd’). Please be reminded that you are solely responsible for the trading decisions on your account. There is a very high degree of risk involved in trading. Any information and/or content is intended entirely for research, educational and informational purposes only and does not constitute investment or consultation advice or investment strategy. The information is not tailored to the investment needs of any specific person and therefore does not involve a consideration of any of the investment objectives, financial situation or needs of any viewer that may receive it. Kindly also note that past performance is not a reliable indicator of future results. Actual results may differ materially from those anticipated in forward-looking or past performance statements. We assume no liability as to the accuracy or completeness of any of the information and/or content provided herein and the Company cannot be held responsible for any omission, mistake nor for any loss or damage including without limitation to any loss of profit which may arise from reliance on any information supplied by TFA Global Pte Ltd.
The speaker(s) is neither an employee, agent nor representative of Tradu and is therefore acting independently. The opinions given are their own, constitute general market commentary, and do not constitute the opinion or advice of Tradu or any form of personal or investment advice. Tradu neither endorses nor guarantees offerings of third-party speakers, nor is Tradu responsible for the content, veracity or opinions of third-party speakers, presenters or participants.

USOIL : What will happen to the price of oil?Hello friends
As you can see, we had support in the past, which has now become a strong resistance for the price after it was broken.
Now we need to see if the price will manage to break it at this moment when it is close to its key and sensitive resistance.
*Trade safely with us*

USOIL: Will Keep Growing! Here is Why:
The charts are full of distraction, disturbance and are a graveyard of fear and greed which shall not cloud our judgement on the current state of affairs in the USOIL pair price action which suggests a high likelihood of a coming move up.
Disclosure: I am part of Trade Nation's Influencer program and receive a monthly fee for using their TradingView charts in my analysis.
❤️ Please, support our work with like & comment! ❤️

OIL: Sideways - Waiting for R2/S2 BreakoutsOil has been in a clear sideways consolidation for several days, reflecting a period of indecision in the market. While this tight range holds, a patient approach to trading is warranted. A long position will be considered if a confirmed breakout and sustained price action above R2 occur, indicating strong bullish momentum. Conversely, if oil breaks down and holds below S2, a short position will be initiated, anticipating further bearish movement. This current consolidation phase suggests a significant directional move is likely imminent, and observation of these key resistance and support levels will be crucial for entry signals.
