oilprice.com/Latest-Energy-News/World-News/Houthi-Attacks-Trigger-Unpaid-Debt-Shutdown-of-Israels-Eilat-Port.html
WTI Cash (or Spot) Contract forum
oilprice.com/Latest-Energy-News/World-News/Houthi-Attacks-Trigger-Unpaid-Debt-Shutdown-of-Israels-Eilat-Port.html
Arhaan9787 this is what I mean…
+ I’ll leave beyond50 and mustafabeercan to be the judge of this as they have experience in similar situations lol
My post: OIL_CRUDE might be headed o 66.45
to 66.00 to 65.60 wait for confirmation
Your following post after sayingUSOILSPOT I guess we can see 67.8 today by NY session close. What say?: USOILSPOT Ready for reversal in sometime.
My post:OIL_CRUDE
Just a thought looking at the charts I think we might have a bullish gap down on Monday. Meaning we might see a gap down but buy orders could cover shorts leading to another bullish run. This is not a financial advice. I can see this happening as there is a bearish CRT on the 2D Timeframe and 12H timeframe and a bullish BOS fair value gap around 65.80 on the 12 hour timeframe frame.
We tested the opening of previous 12H bearish candle (67.60) and rejected so it might drop further on Sunday evening ahead of Monday session towards the Bullish order block also around 65.40-65.80 before it loads up for another run
If you want to adjust pricing toUSOIL add 90-95 cents onto the values shown above.
Have a great weekend and Happy Friday!! 🙏🏽
Your post:USOILSPOT I was scanning the chart on the 1-hour TF. I found some interesting patterns. As per my analysis, it could again fall to the 64 level and then rise towards 75.
Or else we are done with 64 levels, and it's gradually moving towards 75. We can probably see it in the coming days.
What does your analysis say?
Only difference:
I haven’t spoken about crazy speculation of 75.
You mentioning 64 level when you replied to my post saying I do not think it will go below 66.00
I just see a lot of inconsistencies…
+ I’ll leave beyond50 and mustafabeercan to be the judge of this as they have experience in similar situations lol
My post:
to 66.00 to 65.60 wait for confirmation
Your following post after saying
My post:
Just a thought looking at the charts I think we might have a bullish gap down on Monday. Meaning we might see a gap down but buy orders could cover shorts leading to another bullish run. This is not a financial advice. I can see this happening as there is a bearish CRT on the 2D Timeframe and 12H timeframe and a bullish BOS fair value gap around 65.80 on the 12 hour timeframe frame.
We tested the opening of previous 12H bearish candle (67.60) and rejected so it might drop further on Sunday evening ahead of Monday session towards the Bullish order block also around 65.40-65.80 before it loads up for another run
If you want to adjust pricing to
Have a great weekend and Happy Friday!! 🙏🏽
Your post:
Or else we are done with 64 levels, and it's gradually moving towards 75. We can probably see it in the coming days.
What does your analysis say?
Only difference:
I haven’t spoken about crazy speculation of 75.
You mentioning 64 level when you replied to my post saying I do not think it will go below 66.00
I just see a lot of inconsistencies…
Or else we are done with 64 levels, and it's gradually moving towards 75. We can probably see it in the coming days.
What does your analysis say?

Just a thought looking at the charts I think we might have a bullish gap down on Monday. Meaning we might see a gap down but buy orders could cover shorts leading to another bullish run. This is not a financial advice. I can see this happening as there is a bearish CRT on the 2D Timeframe and 12H timeframe and a bullish BOS fair value gap around 65.80 on the 12 hour timeframe frame.
We tested the opening of previous 12H bearish candle (67.60) and rejected so it might drop further on Sunday evening ahead of Monday session towards the Bullish order block also around 65.40-65.80 before it loads up for another run
If you want to adjust pricing to
Have a great weekend and Happy Friday!! 🙏🏽
If there's a continued move down by the bears to cross the trendline, then the market bias would flip from bullish to bearish with the most profitable moves being to the downside.
*Side Note:
To make it official that the Hourly is in Bearish Market Bias, the current candle forming would first need to break the trendline, then another bearish candle in the new hour has to "clear" past it, which means it no longer touches the trendline in going down.
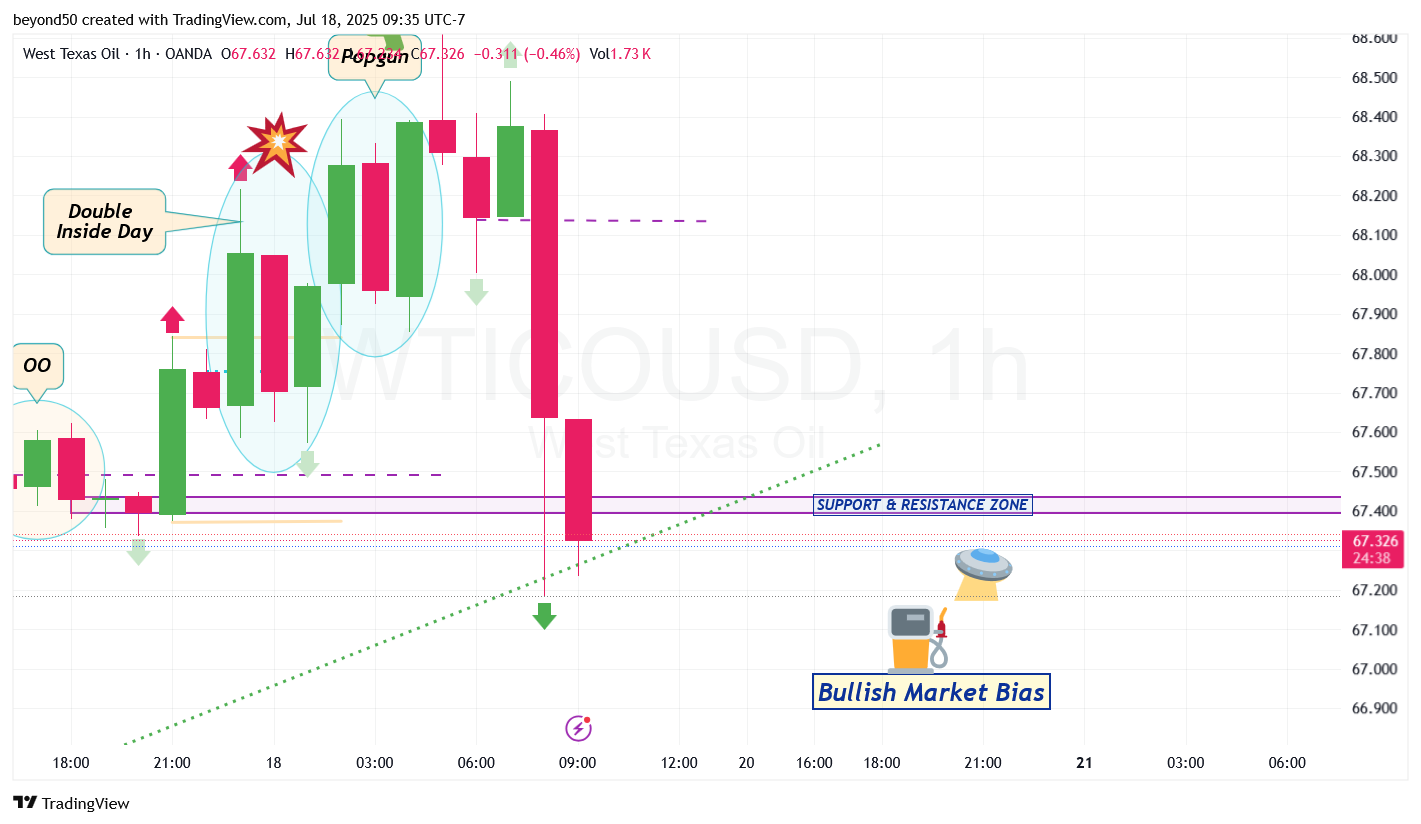
BULLISH ENERGY. MACRO STILL WINS.
$USOILTrump is playing his cards to keep oil prices low — for now. But oil is a global commodity, not a market that can be controlled forever. He may be manipulating short-term moves, but the world will have to pay the price sooner or later. High oil prices are inevitable. This setup is BULLISH.