Weekly Forex Outlook Sun.April.27.2025 - Fri.May.2.2025Like and Comments would be appreciated :D Not Financial Advice, Just my outlook/opinion
DJI trade ideas

Market Digesting Trade War Fears — But Risks RemainSimilar to the early stage of Trump's previous administration, escalating trade tensions and tariff threats have once again rattled market sentiment, triggering a broad-based correction in equity indices down to key support levels.
Over the past two weeks, extreme trade war rhetoric shocked the market, causing the index to break below the 40,000-point support, reaching a low of 36,439 — near the 200-day moving average on the weekly chart. As this level coincides with a significant technical support zone, buying interest emerged, prompting a rebound back above the 40,000 mark.
This suggests that the market has begun to digest the trade war narrative, with investors gradually positioning in tranches around the 40,000 level. However, ongoing uncertainty surrounding trade policies may continue to weigh on sentiment. Should the index revisit 36,439 and fail to hold, further downside toward the next major support at 34,969 could be expected.


DOW JONES MONTHLY | Pullback in Motion
After tagging the $45,071 previous high, the Dow is now reacting sharply — down over 4.5% and sitting right on the 0.236 Fib level at $41,080.
⚠️ Momentum shift confirmed by this monthly candle.
Next key levels:
0.382 at $38,692
0.5 at $36,762
0.618 at $34,832 — the golden zone
This move could be a healthy correction within an uptrend — or the start of something deeper.
🔍 Watch price reaction around these fib zones closely.

DOW JOUNS RANG TRENDDOW JOUNS RANG TREND
Dow Jones Industrial Average (DJIA) has been fluctuating within a broad range recently. As of April 21, 2025, the index stood at 38,170.41. Over the past year, it has seen highs of 44,882.13 and lows of 37,645.59

Navigating Trump Tariffs on the Dow JonesNavigating the movements of the **US30 (Dow Jones Industrial Average)** can be challenging, especially amid shifting economic policies. The Dow, which tracks 30 major U.S. companies, is highly sensitive to trade policies, corporate earnings, and geopolitical risks. Trump’s plan to impose **10% across-the-board tariffs** and **60%+ tariffs on Chinese goods** has sparked concerns about inflation, supply chain disruptions, and retaliatory trade measures. Investors are closely watching how these policies could impact multinational companies within the index, particularly those reliant on global trade, such as **Boeing, Apple, and Caterpillar**.
For everyday Americans, higher tariffs could mean **rising prices on imported goods**, from electronics to household items, worsening inflation. While tariffs aim to protect domestic industries, they often lead to **higher production costs** for businesses that rely on foreign materials, potentially triggering job cuts or reduced consumer spending. The stock market’s reaction—volatility in the US30—reflects these uncertainties, as investors weigh the risks of slower growth against potential benefits for U.S. manufacturers.
Traders navigating the US30 must monitor **Fed policy, corporate earnings, and trade war developments**. If tariffs escalate, defensive stocks (utilities, healthcare) may outperform, while industrials and tech could face pressure. Long-term investors might see dips as buying opportunities, but short-term traders should prepare for turbulence. Ultimately, Trump’s tariff policies could reshape market dynamics, making adaptability key for those trading the Dow.

Trade Idea: US30 Long ( BUY LIMIT )Technical Justification:
1. Daily Chart:
• Price has recently bounced strongly from a significant support zone around 37,675, confirming a bullish rejection.
• RSI is rising from oversold levels (currently around 48), showing momentum is shifting upwards.
• MACD is still negative but starting to converge, signaling a potential reversal in the mid-term.
2. 15-Minute Chart:
• Strong bullish move, breaking through previous structure highs.
• MACD and RSI are both in bullish territory, RSI ~63, not yet overbought.
• Price consolidating around 40,090, suggesting possible continuation.
3. 3-Minute Chart:
• Micro trend is clearly bullish.
• Minor consolidation after a push upward — ideal for breakout or pullback entry.
• RSI at ~49, healthy for continuation, MACD slightly bullish.
⸻
Fundamental Backdrop (as of now):
• Earnings season in the US is ongoing with strong reports from major companies.
• Rate cut expectations later in the year are improving market sentiment.
• Recent data suggests soft landing scenario, supporting risk-on assets like equities.
⸻
Trade Setup:
• Direction: Long (Buy)
• Entry: 40,050 (pullback entry)
• Stop Loss (SL): 39,750 (below recent breakout base)
• Take Profit (TP): 40,650
FUSIONMARKETS:US30


US340 H9 IdeaPotential for a bullish pullback on the US30 1D which could lead to a price movement towards the resistance level at 42200. BUY levels from 39600

correctionGiven the behavior of the index in the current resistance range, it is expected that the upward trend will continue.Otherwise, the correction trend will continue to the specified support levels.

US30?
Hi,
Discussion with Treasury Sec & Finance Minister KATO...
BESSET: Please don't sell our bonds anymore.
KATO: No will have to sell.. our Yen is weak
If we don't sell.. anyone else would..
BESSET: We will maintain interest rates as is.. what say you?
KATO: Okay... but you will inform us when you make changes
BESSET : ( *wink*)...
So that is the made up conversation. Do you think it's a possibility?
But biz is biz...
Japan would balance it's treasury.. It will sell as balancing act. That's my my 2c.
IF Yen is weak by another 5-10% (up on USDJPY).. Kato will not hesitate to unload again
Hehe.. This is just a story.
All the best
For now, I think Japan.. halting it's selling.. US30 up 10% (my prediction to 44000 for now)

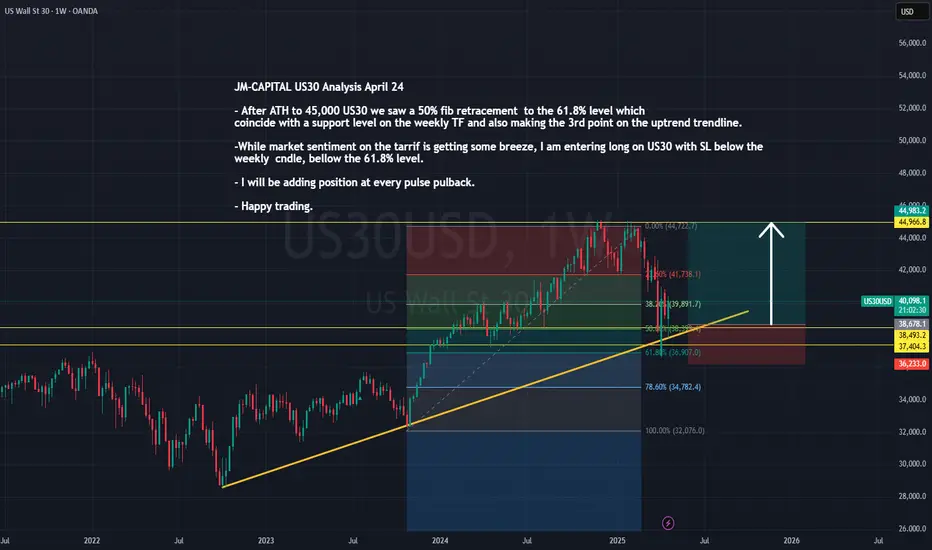
JM-CAPITAL US30 Analysis April 24After reaching an all-time high of 45,000, US30 experienced a pullback, retracing to the 61.8% Fibonacci level—aligning perfectly with a key support zone on the weekly timeframe and forming the third touchpoint on the ascending trendline.
With market sentiment beginning to ease around the tariff discussions, I’m taking a long position on US30. My stop loss is set just below the weekly candle and beneath the 61.8% Fibonacci level for added protection.
I plan to scale into the trade by adding positions on each corrective pullback in line with the bullish structure.
Wishing you all a profitable trading session. Stay sharp!
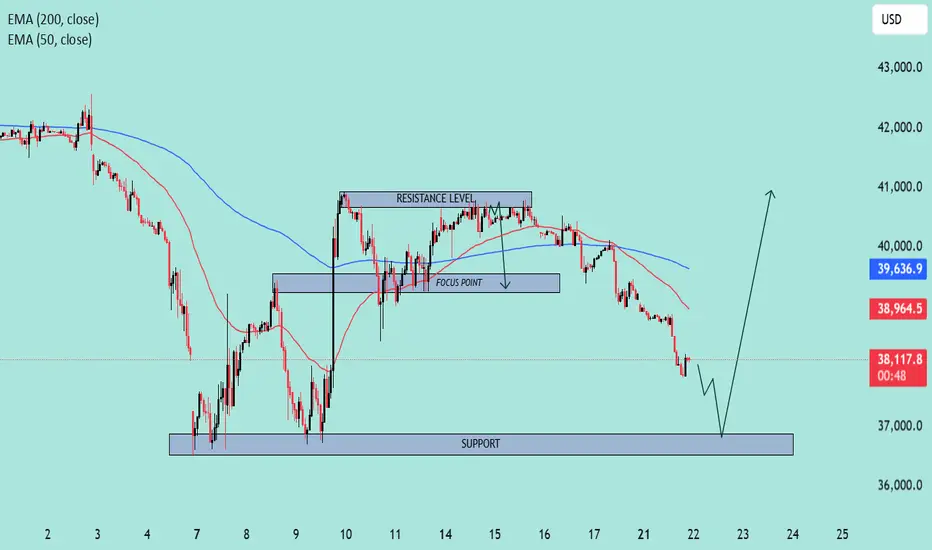
US30 Approaching Key Support Zone – Potential Reversal Ahead?📊 Chart Overview:
Timeframe: Looks like an intraday (maybe 1H or 2H).
Indicators:
EMA 50 (Red): 38,964.7
EMA 200 (Blue): 39,637.0
🔍 Key Levels & Structure:
🔵 Support Zone (Highlighted):
Around 36,800 – 37,200 range.
This is a well-tested support level where price previously bounced.
Current price action is approaching this zone again, which increases the chance of a potential bullish reaction.
🟣 Resistance Level:
Defined around 40,500 area.
Price has rejected multiple times from this zone.
Previously served as a consolidation/decision area.
📍 Focus Point (Previous Support Turned Resistance):
Near 38,700 – 39,000.
This level may act as a reaction point on the way back up.
📉 Current Price Action:
Strong downward momentum heading into the support zone.
Price is under both EMAs, suggesting short-term bearish trend.
However, the drawn arrow suggests a potential reversal bounce from the support.
🧠 Interpretation & Scenario Plan:
🅰️ Bullish Scenario:
Price touches or sweeps the support zone.
Bullish structure or reversal candle forms (e.g., hammer, bullish engulfing).
Break back above EMA 50 & Focus Point could confirm the shift.
Target: Revisit Resistance Zone (above 40,000).
🅱️ Bearish Scenario:
Support fails to hold.
Clean break below 36,800 with volume could lead to accelerated sell-off.
Watch for breakdown retests of support turned resistance.
🔔 Takeaway:
⚠️ Current move is bearish, but price is approaching a key demand zone. Bulls might step in if the zone holds. Confirmation is key before going long. Reclaiming EMAs would strengthen bullish bias.
DJI Long....A simple Supply Demand Logic trade. The price is well over Supply zone and is still holding the potential to move further up ahead.....
TP 40520
SL 39899

Trade Idea: US30 Short (SELL STOP)1. Technical Analysis
Daily Chart
• Trend: Still overall bullish long-term, but in a short-term pullback phase after peaking.
• MACD: Bearish crossover with widening histogram — indicating continued downside momentum.
• RSI: At 45.05 — neutral-bearish, room to fall to oversold.
• Price: Strong reaction at ~37675.05 area, bounced back to ~39562, forming a potential lower high.
15-Min Chart
• MACD: Recently crossed bearish after a sharp rally.
• Price Action: Approaching resistance zone (~39562), failed to make a new high.
• RSI: 44.78 — leaning bearish, but not oversold yet.
3-Min Chart
• MACD: Just flipped bullish but weak — suggesting possible micro pullback before continuation.
• RSI: 48.82 — very neutral, no extreme condition.
⸻
2. Fundamental Context (as of April 2025)
• Recent sharp pullback from all-time highs hints at risk-off sentiment returning.
• Likely driven by Fed rate uncertainty, inflationary stickiness, or geopolitical jitters.
• Earnings season volatility could also play a role.
• No strong bullish macro catalyst to support a fresh rally continuation yet.
⸻
3. Trade Setup: SHORT Position
Bias: SHORT
Reason: Price hit resistance at 39562, confirmed by 15M MACD cross and RSI weakness. Daily still bearish momentum. No major bullish catalyst.
⸻
ENTRY:
39550 (near current resistance, confirmed failure to break higher)
STOP LOSS (SL):
39800 (above recent minor high, above 15M key level)
TAKE PROFIT (TP):
38900 — Minor support zone, clean level from 15M + previous consolidation area
FUSIONMARKETS:US30

Us30 Upward or downward?In the 5-minute timeframe, you can sell at the top of the trading range and buy at the bottom of the trading range (by observing reversal candles and patterns).
Alternatively, you can wait for a breakout and enter in the direction of the breakout.
Be mindful of fake breakouts

Dow Jones INTRADAY capped at 40954Key Support and Resistance Levels
Resistance Level 1: 40954
Resistance Level 2: 41510
Resistance Level 3: 42216
Support Level 1: 39600
Support Level 2: 38534
Support Level 3: 37832
This communication is for informational purposes only and should not be viewed as any form of recommendation as to a particular course of action or as investment advice. It is not intended as an offer or solicitation for the purchase or sale of any financial instrument or as an official confirmation of any transaction. Opinions, estimates and assumptions expressed herein are made as of the date of this communication and are subject to change without notice. This communication has been prepared based upon information, including market prices, data and other information, believed to be reliable; however, Trade Nation does not warrant its completeness or accuracy. All market prices and market data contained in or attached to this communication are indicative and subject to change without notice.

US30: Potential Bullish BreakoutUS30: Potential Bullish Breakout
US30 hit a low of 36,500 on April 7th. Since then, the price has been climbing steadily, forming a triangle pattern.
While a breakout could happen in either direction, I’m focusing on the bullish potential.
If US30 breaks above the triangle pattern, a strong upward wave could follow, possibly pushing the price toward 44,000.
You may find more details in the chart!
Thank you and Good Luck!
❤️PS: Please support with a like or comment if you find this analysis useful for your trading day❤️

US30 Bullish Setup: Buy the Dip Opportunity
The market recently broke structure to the upside, creating a higher high. Price is now retracing towards a key demand zone between 38,750 - 39,000, which aligns with previous structure and demand confluence.
I’m watching for bullish confirmations within this zone to enter long, targeting the upper imbalance/zone around 41,500 - 42,000.
Bias: Bullish
Entry Zone: 38,750 - 39,000
Target: 41,500+
Invalidation: Clean break and close below 38,750
This setup presents a potential “buy the dip” opportunity, assuming bullish momentum holds after the retest.

US30 Rejected at Resistance – 24/04/2025 🧨 US30 Rejected at Resistance – 24/04/2025 🧨
📉 False Break Above 40k – Sellers Step In!
Price failed to sustain above the 40,000 psychological level and got rejected near 40,360, confirming that sellers are still active around the key 40,701 zone. We’re seeing a lower high forming after that pop 🚨.
🔍 Key Observations:
❌ Rejection at 40,360
📉 Lower high structure forming
🔻 Weak bounce and now pulling back under 39,500
📍 Support around 38,955 - watch closely
🎯 Trade Plan:
🔹 Bears in control short-term
⚠️ Watch 38,955 zone — if that breaks → 38,250 / 37,000 in play
💥 Short entries valid below 39,200 with tight risk
🚀 Bulls need a reclaim above 40,000 to regain control
🧠 Psych Tip: Don't FOMO into longs yet — wait for a reclaim or break structure short.

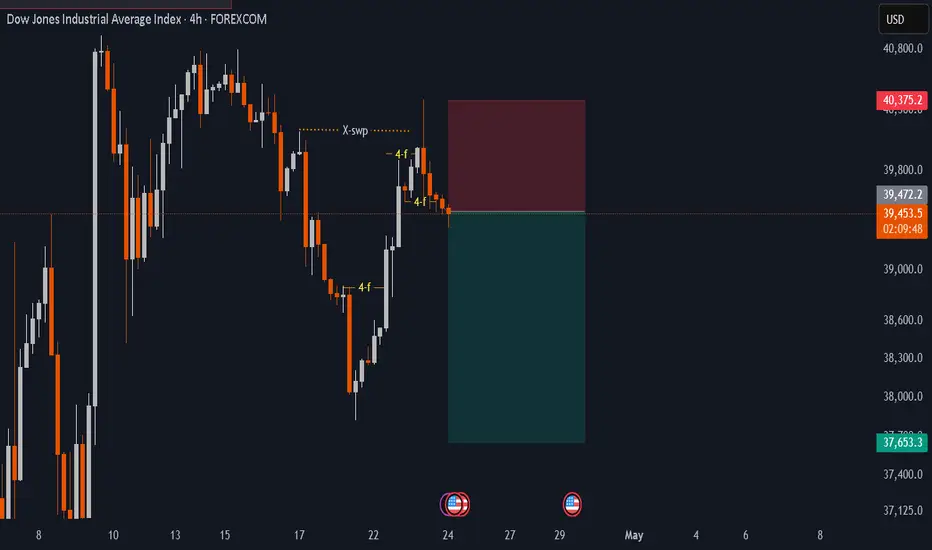
US30idea about the trade is very clear.
1d swing is bearish.
1d fractals is bearish.
4h price movementum gone up takan-out liquidity ,now gave 4h fractals shift towards downside . I m in a sell.
DOW JONES INDEX (US30): Another Gap to Watch
US30 is on its way to fill the gap up that was formed 2 days ago.
It looks like the market will reach a gap opening level soon.
I expect a bearish movement at least to 39285
❤️Please, support my work with like, thank you!❤️
I am part of Trade Nation's Influencer program and receive a monthly fee for using their TradingView charts in my analysis.

DOW JONES New long-term bottom being formed on the 1W MA200.Dow Jones (DJI) hasn't yet broken above its 1D MA50 (blue trend-line) following the April 07 Low, but is nonetheless consolidating and holding the 1W MA200 (red trend-line), which hasn't broken as Support since October 17 2022.
That was a few days after the bottom of the 2022 Inflation Crisis was formed and the current Channel Up started. In fact, the rallies that started on both Channel Up bottoms since, have been almost identical in range (+22.60% and +23.80% respectively) so technically we should be expecting at least 44800 (+22.60% from April's Low) on the medium-term.
-------------------------------------------------------------------------------
** Please LIKE 👍, FOLLOW ✅, SHARE 🙌 and COMMENT ✍ if you enjoy this idea! Also share your ideas and charts in the comments section below! This is best way to keep it relevant, support us, keep the content here free and allow the idea to reach as many people as possible. **
-------------------------------------------------------------------------------
Disclosure: I am part of Trade Nation's Influencer program and receive a monthly fee for using their TradingView charts in my analysis.
💸💸💸💸💸💸
👇 👇 👇 👇 👇 👇
