Same as always….📈 The Market Crashed. We Bought the Bottom. Again. 💥
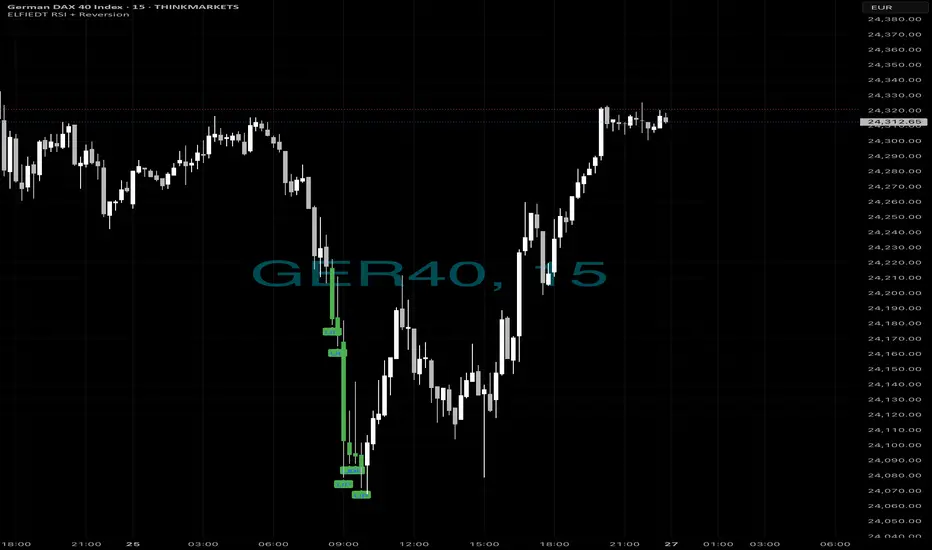
Just another 15-minute chart… or is it?
While panic hit the DAX this morning, ELFIEDT RSI + Reversion was calmly printing BUY after BUY at the dead low. No guessing. No hype. Just precision.
✅ 5 Buy signals within minutes
✅ Picture-perfect mean reversion
✅ Price soared right after
✅ ZERO lag. ZERO repaint.
If you missed this move, don’t worry — this is what my system does.
🧠 Want to learn the logic behind this?
💰 Want to use it live on your own charts?
👉 Drop a 🔥 below if you want access.
👉 DM me “ELFIEDT” to test it out.
👉 Follow for real, repeatable setups.
GDAXI trade ideas
DAX Bearichthe complete set up shoxs that Dax is ranging inside the internal zone , creating a double top on the 4H time frame, witing for the smal trigger to short the position
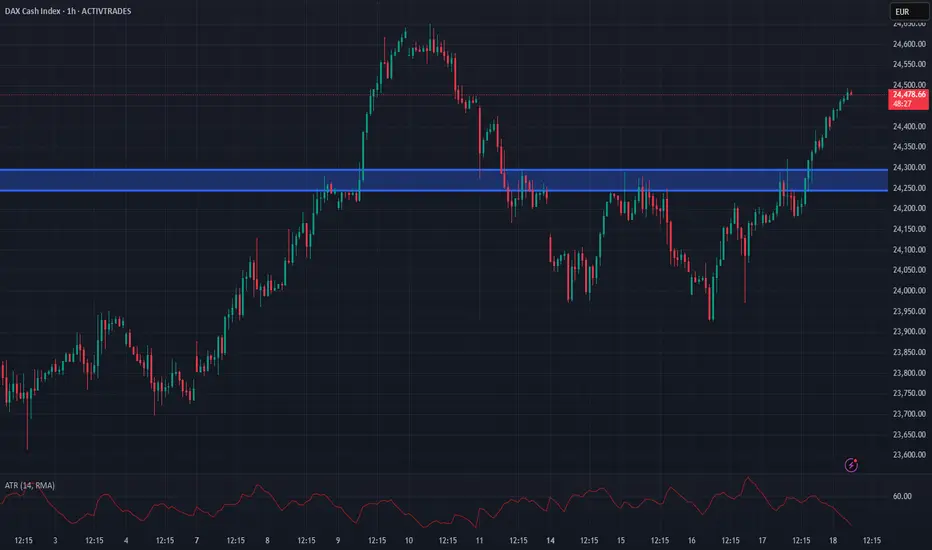
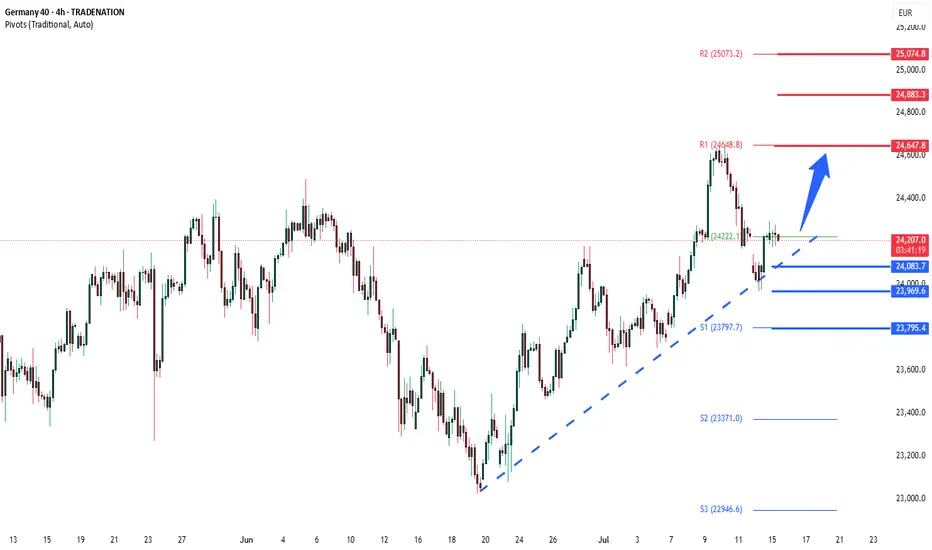
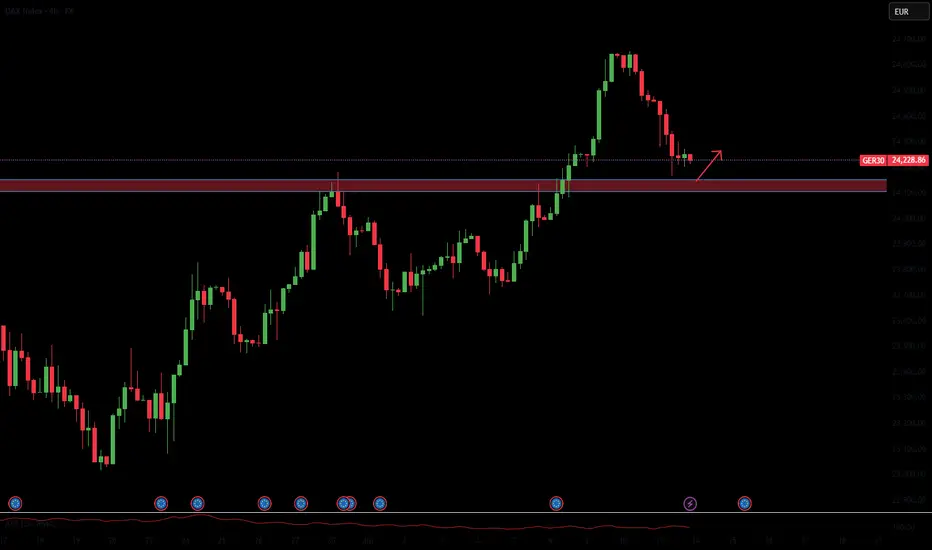
Dax Breaks Higher to keep the bullish toneDax has moved back above the 24245-24295 zone impulsively and we retain the overall bullish tone
Retests of this area can provide an opportunity to get long
Stops need to be below 24170
Targets can be back towards 24400 and even hold a runner back to the All time highs
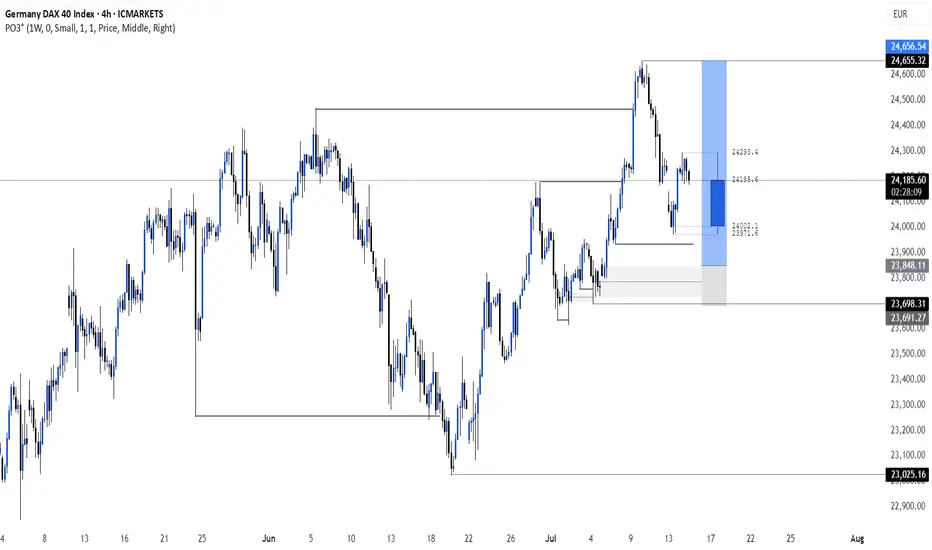
DE40 HTF DistributionI'm watching the DE40 closely here. It's putting in distribution over distribution, which simultaneously leads to the creation of a potential higher time frame distribution model. There are many other indices with a similar behaviour, but this one looks the cleanest so far. I'm waiting for invalidations/confirmations at the POI's.
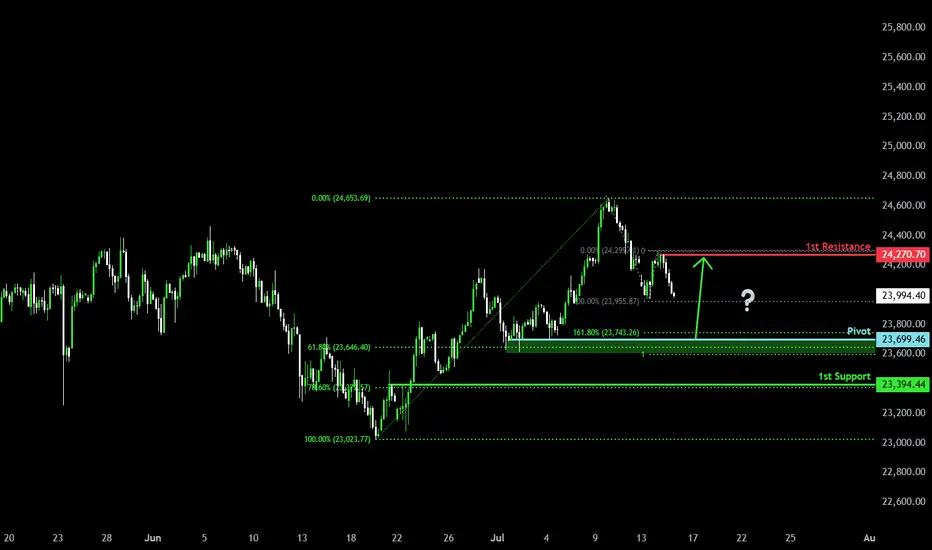
Falling towards Fibonacci confluence?DAX40 (DE40) is falling towards the pivot, which is a pullback support and could bounce to the pullback resistance.
Pivot: 23,699.46
1st Support: 23,394.44
1st Resistance: 24,270.70
Risk Warning:
Trading Forex and CFDs carries a high level of risk to your capital and you should only trade with money you can afford to lose. Trading Forex and CFDs may not be suitable for all investors, so please ensure that you fully understand the risks involved and seek independent advice if necessary.
Disclaimer:
The above opinions given constitute general market commentary, and do not constitute the opinion or advice of IC Markets or any form of personal or investment advice.
Any opinions, news, research, analyses, prices, other information, or links to third-party sites contained on this website are provided on an "as-is" basis, are intended only to be informative, is not an advice nor a recommendation, nor research, or a record of our trading prices, or an offer of, or solicitation for a transaction in any financial instrument and thus should not be treated as such. The information provided does not involve any specific investment objectives, financial situation and needs of any specific person who may receive it. Please be aware, that past performance is not a reliable indicator of future performance and/or results. Past Performance or Forward-looking scenarios based upon the reasonable beliefs of the third-party provider are not a guarantee of future performance. Actual results may differ materially from those anticipated in forward-looking or past performance statements. IC Markets makes no representation or warranty and assumes no liability as to the accuracy or completeness of the information provided, nor any loss arising from any investment based on a recommendation, forecast or any information supplied by any third-party.
DAX corrective pullback supported at 24085The DAX remains in a bullish trend, with recent price action showing signs of a resistance breakout within the broader uptrend.
Support Zone: 24085 – a key level from previous consolidation. Price is currently testing or approaching this level.
A bullish rebound from 24085 would confirm ongoing upside momentum, with potential targets at:
24650 – initial resistance
24880 – psychological and structural level
25000 – extended resistance on the longer-term chart
Bearish Scenario:
A confirmed break and daily close below 24085 would weaken the bullish outlook and suggest deeper downside risk toward:
23970 – minor support
23800 – stronger support and potential demand zone
Outlook:
Bullish bias remains intact while the DAX holds above 24085. A sustained break below this level could shift momentum to the downside in the short term.
This communication is for informational purposes only and should not be viewed as any form of recommendation as to a particular course of action or as investment advice. It is not intended as an offer or solicitation for the purchase or sale of any financial instrument or as an official confirmation of any transaction. Opinions, estimates and assumptions expressed herein are made as of the date of this communication and are subject to change without notice. This communication has been prepared based upon information, including market prices, data and other information, believed to be reliable; however, Trade Nation does not warrant its completeness or accuracy. All market prices and market data contained in or attached to this communication are indicative and subject to change without notice.
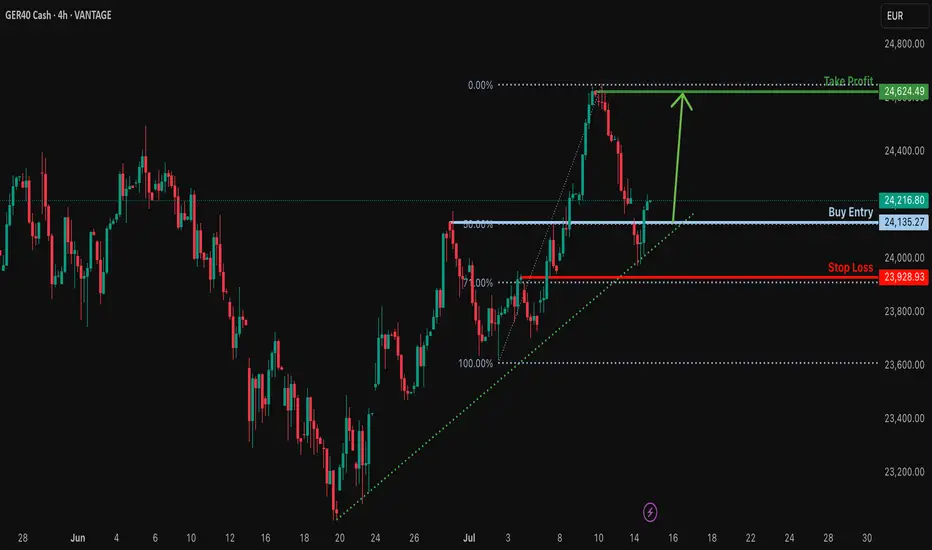
Bullish rise?GER40 has reacted off the support level which lines up with the 50% Fibonacci retracement and could potentially rise from this level to our take profit.
Entry: 24,135.27
Why we like it:
There is a pullback support that lines up with the 50% Fibonacci retracement.
Stop loss: 23,928.93
Why we like it:
There is a pullback support that aligns with the 71% Fibonacci retracement.
Take profit: 24,624.49
Why we like it:
There is a pullback resistance.
Enjoying your TradingView experience? Review us!
Please be advised that the information presented on TradingView is provided to Vantage (‘Vantage Global Limited’, ‘we’) by a third-party provider (‘Everest Fortune Group’). Please be reminded that you are solely responsible for the trading decisions on your account. There is a very high degree of risk involved in trading. Any information and/or content is intended entirely for research, educational and informational purposes only and does not constitute investment or consultation advice or investment strategy. The information is not tailored to the investment needs of any specific person and therefore does not involve a consideration of any of the investment objectives, financial situation or needs of any viewer that may receive it. Kindly also note that past performance is not a reliable indicator of future results. Actual results may differ materially from those anticipated in forward-looking or past performance statements. We assume no liability as to the accuracy or completeness of any of the information and/or content provided herein and the Company cannot be held responsible for any omission, mistake nor for any loss or damage including without limitation to any loss of profit which may arise from reliance on any information supplied by Everest Fortune Group.
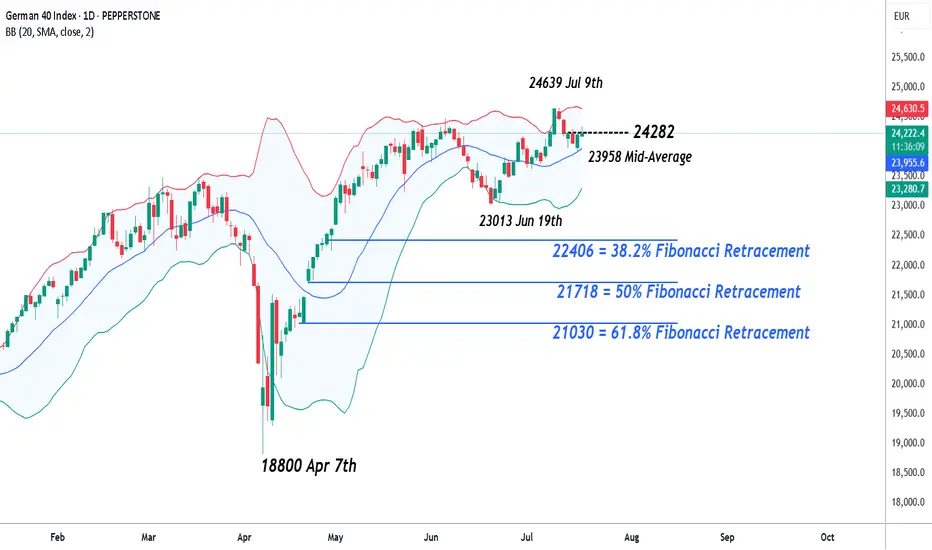
Germany 40 – Preparing For A Short Term Range BreakoutTariff worries, including new comments from President Trump stating that he is likely to impose fresh import charges on pharmaceuticals, have continued to dominate the thinking of Germany 40 traders this week. This has lead to some choppy price action for the index, which after opening on Monday at 24140, has bounced between a Tuesday high of 24293 and a Wednesday low of 23923, before settling back into the middle of that range.
Throw into the mix, the start of Q2 earnings season for European corporates and an upcoming ECB interest rate decision in a week's time and you can see how price action could become increasingly volatile moving forward into the end of July.
Earnings season has so far got off to a slow start in Europe and Germany 40 traders may have to wait until SAP, the company carrying the highest market capitalisation ($352 billion) and index weighting (14.5%), reports its results next Tuesday (after the close) for further insight into where prices may move next.
In terms of the ECB rate decision next Thursday (July 24th), market expectations may currently be indicating that another rate cut is unlikely, although it could be a close call. Traders seem to be focusing on recent commentary from policymakers which suggests the balance of power for the time being has shifted to the more hawkish committee members, who have stated that with inflation sitting on the central bank's target of 2% there is no need to cut rates further. Choosing instead to wait for more clarity on the outcome of trade negotiations with the US, which could decide whether a trade war between the world's first and third biggest economies may be something they need to navigate.
Technical Update: Assessing Current Pirce Action
Having posted a new all-time high at 24639 on July 9th the Germany 40 index has entered a corrective period in price. However, while much will depend on future market sentiment and price trends, traders may well be asking, whether current price declines can develop into a more extended phase of weakness, or if the downside move could be limited as buyers return once again.
Time will tell, but in the meantime, technical analysis may help pinpoint potential support and resistance levels which can aid traders in establishing the next possible trends and directional risks.
Potential Support Levels:
Having recently posted a new all-time high at 24639, it might be argued this is still a positive price trend, especially as the Bollinger mid-average is currently rising. The mid-average stands at 23954, so may mark the first support focus for traders over coming sessions.
However, if closing breaks of this 23954 level materialise, it might lead towards a further phase of price weakness towards 23013, the June 19th session low, even 22406, which is the 38.2% Fibonacci retracement of April to July 2025 price strength.
Potential Resistance Levels:
If the 23954 mid-average successfully holds the current price setback, it could prompt further attempts to extend recent strength.
The first resistance might then stand at 24282, which is equal to half of the latest weakness, with successful closing breaks above this level possibly opening scope back to the 24639 all-time high and maybe further, if this in turn gives way.
The material provided here has not been prepared accordance with legal requirements designed to promote the independence of investment research and as such is considered to be a marketing communication. Whilst it is not subject to any prohibition on dealing ahead of the dissemination of investment research, we will not seek to take any advantage before providing it to our clients.
Pepperstone doesn’t represent that the material provided here is accurate, current or complete, and therefore shouldn’t be relied upon as such. The information, whether from a third party or not, isn’t to be considered as a recommendation; or an offer to buy or sell; or the solicitation of an offer to buy or sell any security, financial product or instrument; or to participate in any particular trading strategy. It does not take into account readers’ financial situation or investment objectives. We advise any readers of this content to seek their own advice. Without the approval of Pepperstone, reproduction or redistribution of this information isn’t permitted.
Next week on GER40 The reason is that I am waiting for the price to reach the 50% PW level and form a 1-hour SMT + 5-minute CISD, then I will look for a buy opportunity. It is also possible that the market will consolidate above the HTF CISD, and after that, we will continue searching for a buy opportunity. Anyway, we will see what the market is doing INSHALLAH.

Technical Weekly AnalysisGermany 40 remains in a bullish trend but is currently undergoing a pullback phase. It is trading at 24,080, nearly matching its VWAP of 24,079. The RSI at 53 suggests moderate momentum. Support lies at 23,245, with resistance at 24,590.
The UK 100 continues its new bullish trend into all-time highs and is currently in an impulsive phase. With price at 8,962 above the VWAP of 8,813, it shows strong momentum. The RSI at 63 supports this outlook. Support stands at 8,652 and resistance is at 9,000.
Wall Street remains bullish but is in a pullback phase, trading at 44,192, slightly above the VWAP of 43,871. The RSI at 58 points to sustained buying interest. Support is at 42,404 and resistance is at 45,338.
Brent Crude is in a neutral trend within a ranging phase, trading at 7,058 just above the VWAP of 6,892. The RSI at 55 reflects a balanced market. Support is at 6,402, with resistance at 7,382.
Gold is also in a neutral trend and consolidating in a range. It is priced at 3,371, near its VWAP of 3,329. The RSI at 56 indicates mild bullish interest. Support sits at 3,269 and resistance is at 3,390.
EUR/USD maintains a bullish trend but is currently in a pullback phase. Trading at 1.1683, it is nearly aligned with the VWAP of 1.1690. The RSI at 55 indicates moderate strength. Support is at 1.1542 and resistance is at 1.1853.
GBP/USD is in a bullish trend but undergoing a correction. With price at 1.3485 below the VWAP of 1.3609, momentum appears to be easing. The RSI at 39 supports this softer tone. Support is at 1.3424 and resistance at 1.3793.
USD/JPY is testing the top of its sideways range. Currently at 147.33, it is above the VWAP of 145.41. The RSI at 64 suggests a potential new bullish phase is beginning. Support is at 142.91 and resistance at 147.92.
#DAX - 24640.70 or 23021.50 ?Date: 01-07-2025
#DAX Current Price: 24073
Pivot Point: 23831.10 Support: 23565.48 Resistance: 24098.19
#DAX Upside Targets:
Target 1: 24259.05
Target 2: 24419.90
Target 3: 24640.70
#DAX Downside Targets:
Target 1: 23403.89
Target 2: 23242.30
Target 3: 23021.50

buy projectionBullish structure(high,low,irl).
Liquidity: sweep and inducement
Point of interest: orderblock
trade with the trend The daily is going up, so we clearly should look for longs for better probabilities in our favor, and when the price approaches this level, I will buy
GER40 LongThere are multiple pattenrs on both H1 and M15
This is hitting target 2 of a short on H4
There is a lot of support at the level 24000
All timeframes are oversold with divergence
This is in a strong upward trend
Stop loss of 100 pips

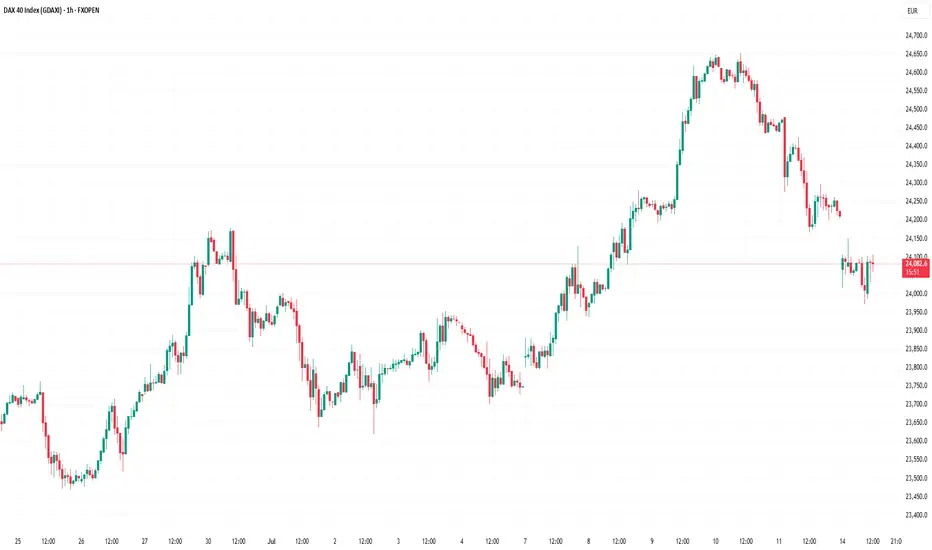
DAX Stock Index Declines Amid Trump Tariff ThreatDAX Stock Index Declines Amid Trump Tariff Threat
The German stock index DAX 40 (Germany 40 mini at FXOpen) is showing bearish momentum at the start of the week. This may be driven by a combination of factors, the most significant of which is the threat of tariffs on Europe from the United States.
According to Reuters, US President Donald Trump has announced a 30% tariff on most goods from the EU, set to come into effect next month. However, the decision is not yet final. Analysts caution against premature panic, suggesting that negotiations could still result in a trade agreement — nonetheless, the chart reflects a sense of unease among investors.
Technical Analysis of the DAX 40 Chart
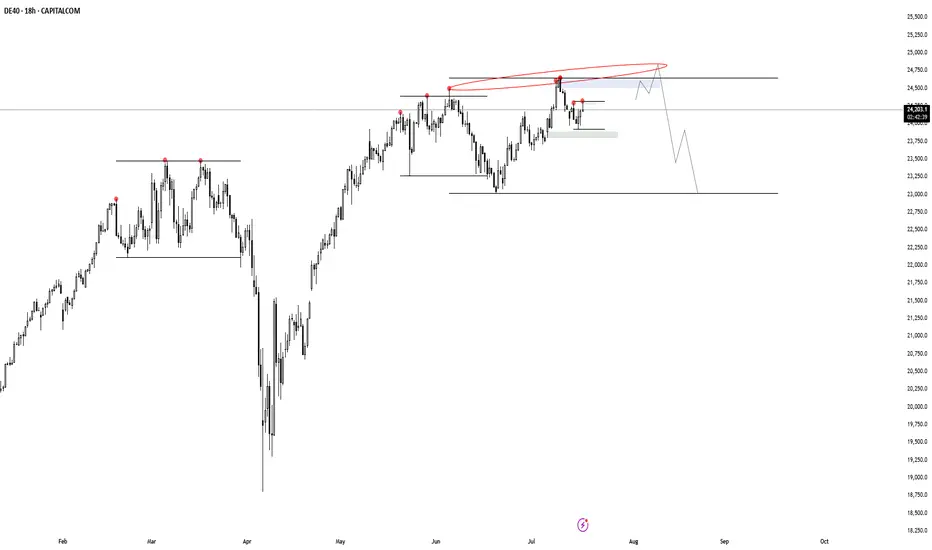
The price surge in July above the previous all-time high near the 24,500 level appears to be a false bullish breakout — a sign of market weakness.
Buyers may hope that the market will find support at the former resistance line (marked in red), drawn through the local highs of June.
However, if news surrounding the US–EU negotiations turns negative, the DAX 40 index could fall towards the 23,650–23,750 support area, which is reinforced by the lower boundary of the medium-term ascending channel.
This article represents the opinion of the Companies operating under the FXOpen brand only. It is not to be construed as an offer, solicitation, or recommendation with respect to products and services provided by the Companies operating under the FXOpen brand, nor is it to be considered financial advice.

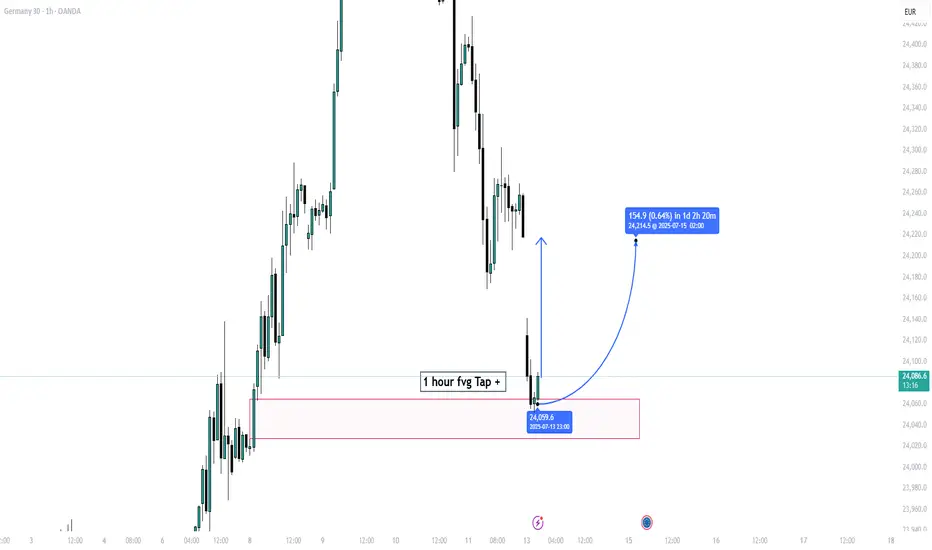
DE30EUR (German Index) Update – July 14, 2025📊 DE30EUR (German Index) Update – July 14, 2025
🕒 Time: 11:44 PM EST
💵 Current Price: 22,408.7
📍 Key Zone: 1-Hour Fair Value Gap (FVG) just tapped.
📈 Market Behavior:
Price has reacted strongly after filling the 1H FVG, showing early signs of bullish reversal. This aligns well with smart money concepts — we could be seeing the beginning of a move toward the upside.
🎯 Short-Term Target: 24,218
With confirmation from this FVG reaction, the move toward 24,218 looks promising.
“GER30 Bull Vault Heist: The Ultimate Loot Plan”💎“The Bull Vault Job: GER30 Heist Blueprint”💎
🌟Hi! Hola! Ola! Bonjour! Hallo! Marhaba!🌟
Welcome fellow Chart Raiders & Market Hackers 🧠💰—your next mission is here.
We’re pulling off a precision breakout plan on GER30 / DE30 "Germany30" — a market vault bursting with bullish loot. This isn’t just trading... this is Thief Trading Style™ — where smart analysis meets slick execution. 👨💻💎📊
💼 The Heist Plan:
📈 Entry: Market shows a wide open vault. Ideal long setups near the last swing low (15–30m for sniper entries). Don’t chase—wait for the retrace.
🛑 Stop Loss: Guard your getaway! Use recent swing lows on 4H (e.g. 24170). Customize based on your risk profile & lot sizes.
🎯 Target: Aim for 24720 or EXIT before the cops (a.k.a. reversal zones) show up. Always secure your gains.
📌 Scalpers’ Signal: Stay LONG-only. Follow swing traders if low on ammo (capital). Use trailing SLs like tripwires to protect your profits.
📊 Market Heat Check: The DE30 is radiating bullish pressure 💥—fueled by fundamentals, macro trends, COT positions, sentiment indicators, and intermarket clues. We read between the lines. You just follow the blueprint. 🧠
🚨 Pro Tips:
Avoid entering trades during high-impact news.
Manage risk like a vault door—solid, tested, and ready.
💖 Smash that Boost Button 💖 if you believe in the Art of Legal Market Extraction™ — it supports the plan, strengthens the crew, and keeps this hustle alive!
🎭 More blueprints & breakdowns coming soon. Stay locked in...
Until the next market hit, trade sharp, trade smart. 🐱👤📈💰

"Planning the Perfect DE40 Robbery? Here’s the Setup!"💥🔥Thief Trading Style: The Ultimate Market Heist Plan for DE40/Germany40🔥💥
"Steal the Trend, Escape the Trap, and Vanish with Profits!"
🌍🌟**Hola, Hallo, Marhaba, Bonjour, Ola, and Hey Traders!**🌟
Welcome to the Thief Trading Vault – where we don’t just trade, we plan market heists with precision and escape like professionals!
To all my fellow Profit Pirates, Smart Robbers, and Money Hunters – this one's for you. 🤑💸💼
🔐💹DE40/Germany40 Master Robbery Plan – Swing Trade Setup
Strategy Type: Swing & Scalp Friendly
Market Direction: Neutral ➜ Bullish Bias
Approach: DCA + Tactical Entry Zones + News-Conscious Trading
📍ENTRY (The Vault Is Open!)
Break in like a pro! We are eyeing a long entry setup.
Wait for price to dip near key pullback zones (within recent 15m or 30m swing highs/lows). Use buy limit orders to scale in.
🛠 Thieves love layering: DCA style entry strategy ensures lower average cost.
💡“Swipe smart, enter silently.”
📍STOP LOSS (Secure Your Exit!)
Our risk control is set at recent 4H swing low – around 23950.00.
However, your SL can vary based on risk profile, lot size, and number of entries.
Protect the stash! 💼🔒
📍TARGET (Getaway Point!)
🎯 Target: 24570.00 or exit early if resistance becomes tight.
We’re approaching a “Red Zone” – a high-risk area loaded with fake-outs, bear traps, and profit-takers.
🔁Scalpers' Goldmine Tips
Only scalp LONG SIDE ONLY.
Big accounts? Jump in anytime.
Small accounts? Tag along with swing setups.
Always use a trailing SL to secure gains and avoid traps.
🧠Technical + Fundamental Blend
This setup isn’t just chart-based.
We analyze:
🔍 Fundamentals & Macro Trends
🧾 COT Reports & Sentiment
🌐 Geopolitical Events
📊 Intermarket & Index-Specific Data
🧭 Trader Positioning & Future Price Bias
📎 Full outlook & premium research available – Klickk the Lnk🔗🧠
📢IMPORTANT REMINDERS:
⚠️ Major news releases = High risk.
Avoid fresh entries during those hours.
Use trailing SLs to lock profits during volatile sessions.
🚀Support The Thieves – Hit Boost!
Smash that 💥Boost Button💥 if this plan helped you plan your next profit heist.
More boosts = More strategies unlocked.
Join our elite robbers’ squad and conquer the market daily with the Thief Trading Style! 🏆💰❤️
📌DISCLAIMER:
This is a general swing trade strategy and not financial advice.
Always evaluate your own risk level and market understanding before entering trades.
Markets shift fast – adapt, stay sharp, and never trade blindly. 🎯
📅 Stay tuned – more robbery plans, more precision trades, and more fun ahead!
Follow & Boost if you want in on the next mission!
🕶️🐱👤 See you at the getaway spot!

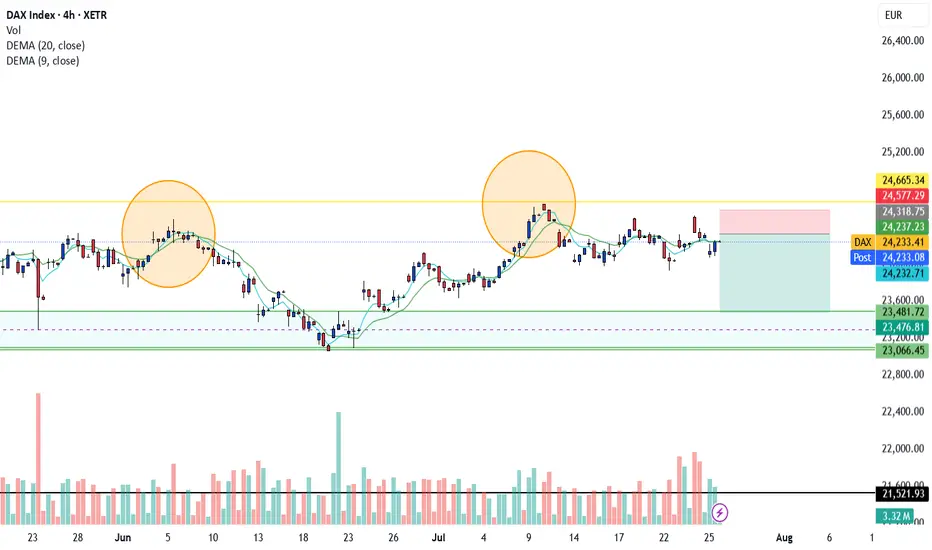
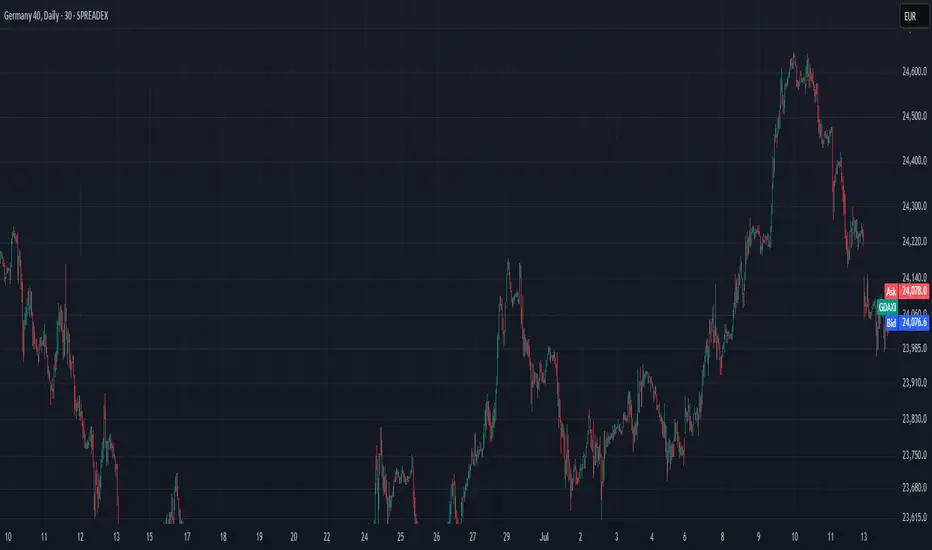
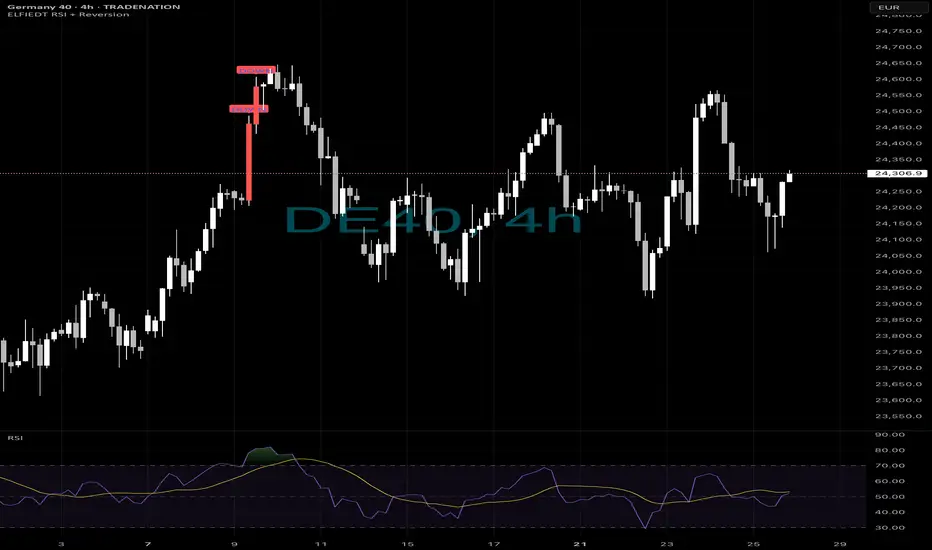
Long or short?📉 Everyone Bought the Dip… You Could’ve Sold the Top.
While most traders chased short-term bounces,
the ELFIEDT RSI + Reversion script called SHORT on the 4H — right at the peak.
🔻 Double confirmation:
1. Reversion SELL trigger
2. Bearish RSI divergence
Result? A massive unwind.
⸻
Why Swing Traders Win:
⚠️ Lower timeframes were printing BUYs inside this structure…
But smart money knows:
🧠 4H structure > 15m noise
This is the power of top-down confluence:
Trust the higher timeframe → avoid false longs → ride the move with confidence.
⸻
📍 ENTRY STRATEGY:
1. Watch 4H RSI diverge from price
2. Wait for ELFIEDT “DOWN” tag confirmation
3. Enter short on next candle break
4. SL = above signal high
5. Let the cascade unfold
This is how you avoid the trap — and catch the trend early.
⸻
💬 DM “DAX 4H SHORT” for the full system
📈 Follow for high-timeframe precision setups
🔒 No noise. No hype. Just structure + signals that deliver
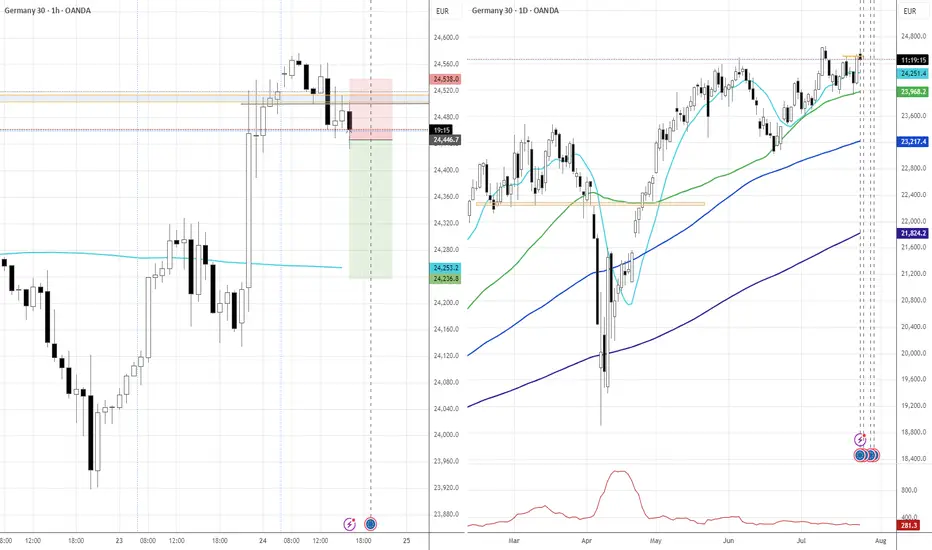
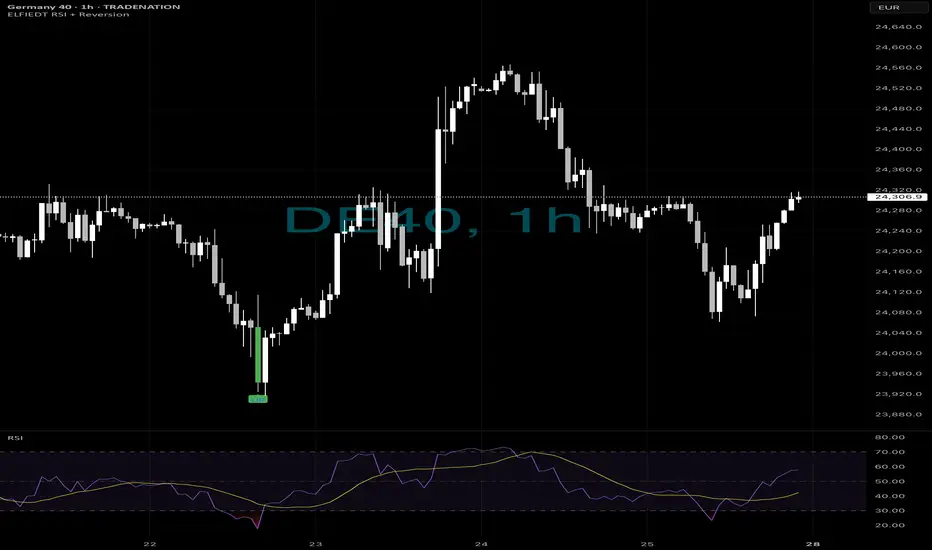
Home runs?📊 Swing Traders: This is Your Signal.
Big trades don’t need to be complicated.
You just need confluence — and a system that waits for the right moment.
Here’s the German DAX 1H chart.
👉 While others panicked, ELFIEDT RSI + Reversion waited.
At the absolute low, it fired a clean BUY — and the rally followed.
⸻
Why This Setup Works for Swing Traders:
🟢 Higher timeframe = stronger structure
🧠 RSI printed deep oversold + divergence
🎯 Reversion zone tagged cleanly
📈 Signal confirmed with “UP” — trade activated
✅ Follow-through into a multi-hour rally
⸻
You didn’t need to monitor every tick.
You just needed one clean trigger — backed by structure, RSI, and timing.
Hold it. Trail it. Scale it.
That’s the power of swing confluence.
⸻
🛠️ This isn’t a repainting indicator.
🧪 It’s been built and refined from real market structure and RSI logic.
📬 DM “DAX H1” for access
📲 Follow for high-conviction, low-stress trade setups
The edge is real. You just need to ride it.

DAX 24.07.2025~+ Post-trade deal risk-on seems to be subsiding
~+ Profit taking towards the ECB Rate decision