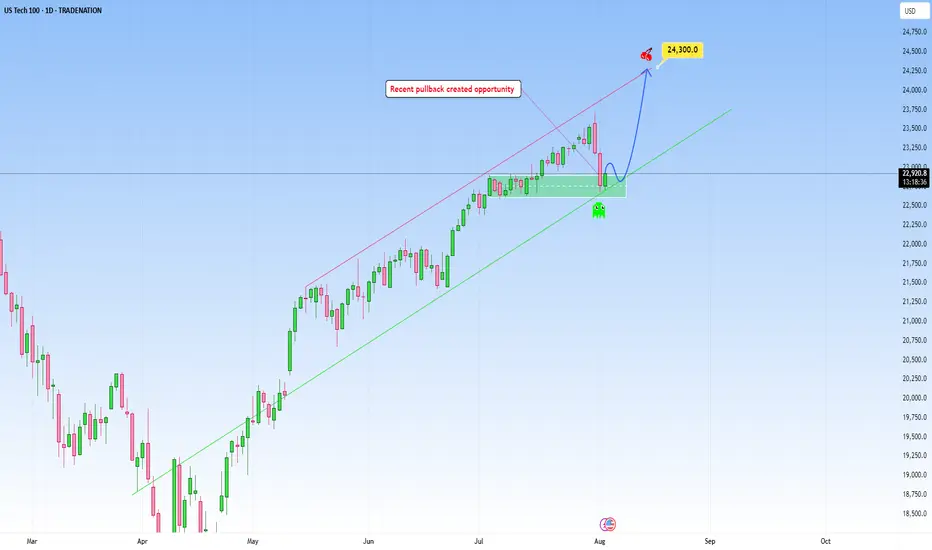
USTEC: Likely continuation following pullbackNAS100 climbed a steep uptrend and my expectation is for a continuation as marked on my chart, with an upside target at around 24,300.
This area here is where it can become a decision point, either price finds support and bounces, or it breaks below, and that’s when we might see the move start to e
About US Tech 100, Daily
The NASDAQ-100 is an index that is constituted by 100 of the largest companies listed on the NASDAQ stock exchange, which is the second largest in the world only after the New York Stock Exchange by market capitalization. The companies that are listed in this index range from a variety of industries like Technology, Telecommunications, Biotechnology, Media, and Services. The NASDAQ-100 was first calculated in January 31 of 1985 by NASDAQ and it is a modified capitalization-weighted index. This index has been of good reference to investors that want to know how the stock market is performing without financial services companies, this given that the index excludes financial companies.
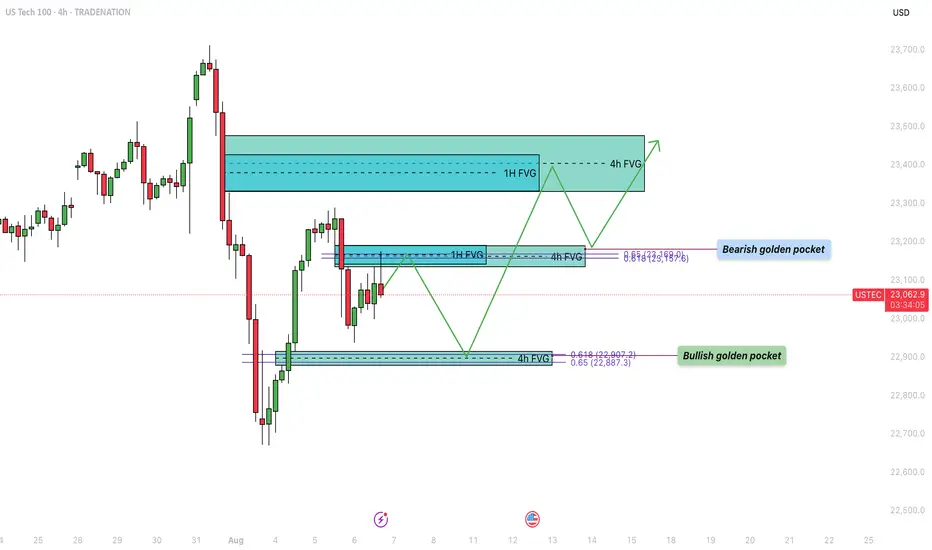
US100 - Bullish trajectory to fill the inbalance zones!Over the past week, the US Tech 100 (US100) experienced a sharp decline, dropping into a significant support zone. During this bearish move, several fair value gaps (FVGs) formed on both the 4-hour and 1-hour timeframes, which remain unfilled. Currently, price action is retracing upward, aiming to f
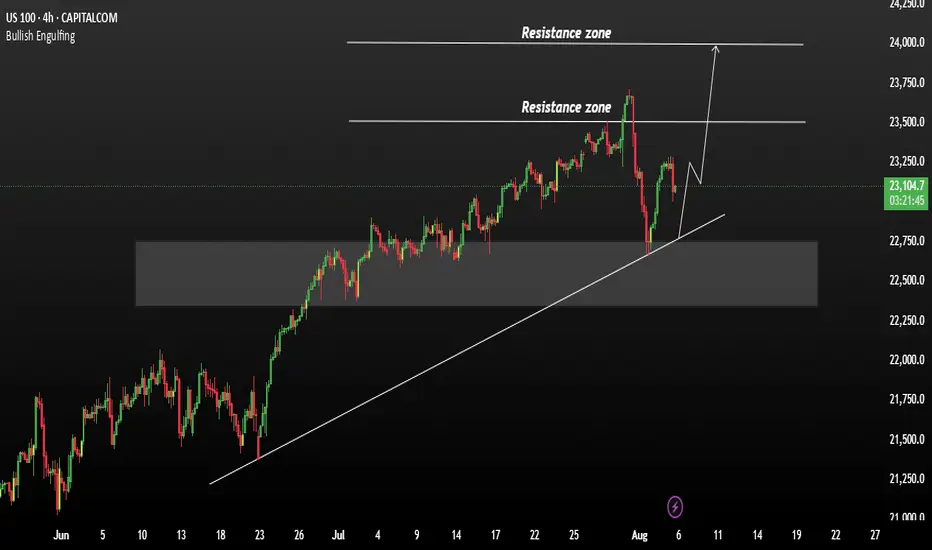
US100 Technically Move Up HeadThe US100 has seen multiple pullbacks of around 3.5% to 4% over the past week. However, each dip has been met with strong buying interest, leading to quick recoveries — indicating that these were bullish pullbacks, not trend reversals.
This kind of price action typically reflects underlying market
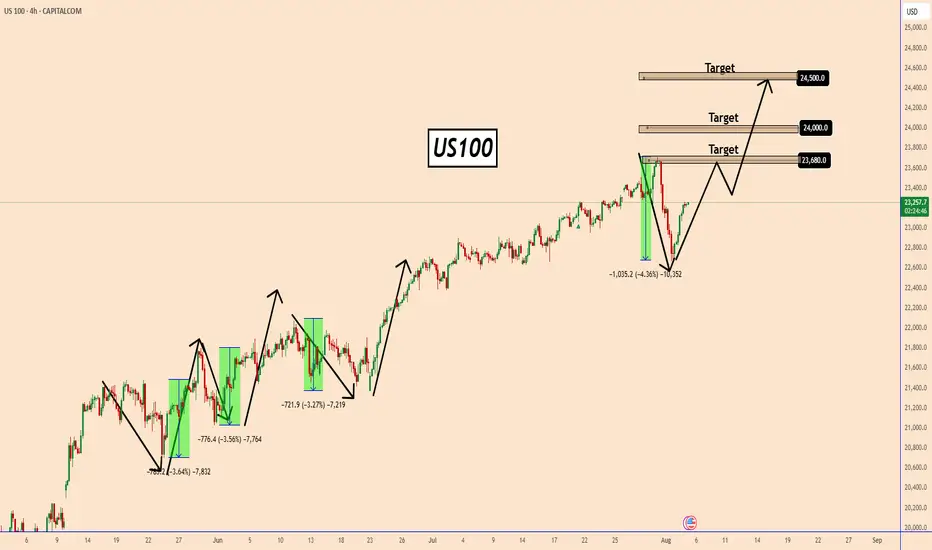
US100 Price Action InsightUS100 Price Action Insight
In recent analysis, we’ve seen the US100 drop multiple times last month by around 3.5% to 4%, but each time it quickly bounced back, showing that these moves were simply buying opportunities during deep pullbacks.
This time, the index fell by about 4.3% due to fears ove
USNAS100 Holds Bearish Below 23045USNAS100 – Overview
The index maintains a bearish momentum as long as it trades below the pivot zone between 22990 and 23045.
To confirm a bullish reversal, the price must break above 23045 and close a 1H candle above it.
On the downside, a break below 22875 would reinforce bearish pressure, open

NASDAQ price dropAfter the Nasdaq price reaches around 23642.2, a historic drop will occur and the target is to drop to 16308.
Whatever happens at the highest price, the final destination is towards 16308.
I have identified the price levels in the middle of this expected drop that can cause the price to correct.
I

NAS100 - Update Dear Friends in Trading,
How I see it,
I will be waiting for a clear and decisive break below the PIVOT.
Keynote:
I am not trading NASDAQ at all...just monitoring patiently!!
I will keep you in the loop as the stock market progress...
I sincerely hope my point of view offers a valued insight
Th

NASDAQ technical analyse.📉 NAS100 Technical Analysis – Potential Reversal Zone Identified (4H Chart)
Price has seen a strong bearish move, breaking through multiple support levels. Currently, it is approaching a key demand zone between 22,600 – 22,420, which previously acted as strong support in early July.
I'm watching t

Nasdaq 100: Institutional Move Toward 22,680 Unfolding📊 Nasdaq 100 Smart Money Breakdown
Current Price: 22,103
Target Price: 22,680
🔼 Upside Potential: +577 points
The market is currently positioned for a premium retracement move after a recent liquidity sweep below short-term equal lows, which likely triggered sell-side liquidity. This setup hints a

NASDAQ Channel Up to be rejected soon.Nasdaq (NDX) has been trading within a Channel Up since the start of the month. The primary Support level has been the 4H MA50 (blue trend-line), which hasn't closed a 4H candle below it since July 14.
Right now the index is on its latest Bullish Leg, which can technically extend by +2.35% (max suc

See all ideas
Displays a symbol's price movements over previous years to identify recurring trends.