NASDAQ LONG NOWDaily break of structure provided me a view of the daily support at 22,960.
My entry is also supported by the 50-MA at the left chart. Im targeting 23,800 with 1:6 risk reward.
NDX trade ideas

NAS - TIME FOR JUICYTeam, hope you all making a killing on SHORT tonight.
as we expected. Thank you for asking and be patience
TIME TO MAKE NAS100 GREAT AGAIN.
Sorry my entry was 23240, but now the market is 23332
you should entry small volume at the current price 23332 - if a little pull back below 23300 add more
STOP LOSS at 23230-50
TARGET 1 at 23385-23400
TARGET 2 at 23475-23515
LETS go - time to make ACTIVE TRADER ROOM GREAT AGAIN.!

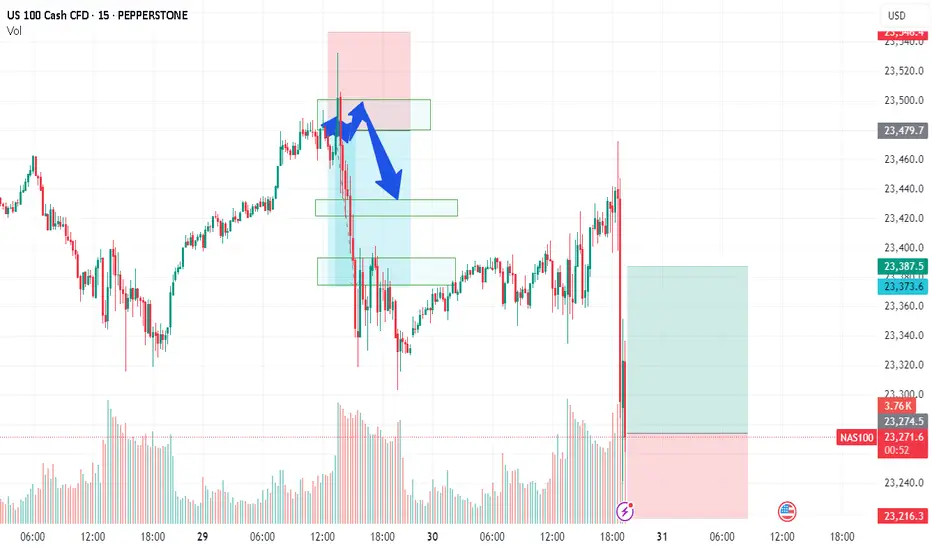
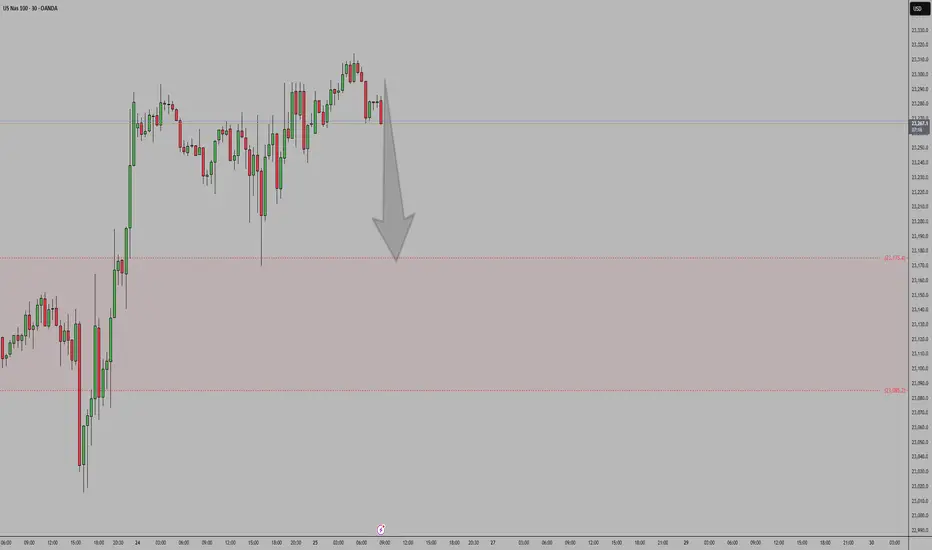
NAS100 - SHORTPrice hit TP after yesterday's long position. Created new all time highs into the asian/London session. We have a nice gap I will target as my potential full TP.
Nasdaq Short: Catching a rising knife. Stop loss at 23500.Hi everyone, here I am trying to catch the peak of Nasdaq again. As mentioned, the previous idea was stopped out at 23,320. Now, for this idea, I am attempting another short with a 30 points risk for Nasdaq. The stop for this idea is fixed at 23,500. The take profit is 22,650.
This is a positional trade and I will re-evaluate as the waves unfolds. So the strategy will mainly be trailing the stop periodically.
Thank you and good luck!

NAS100 - EXPECTING THE DUMPTeam, we got short well today with AUS200 - both target hit
we have set up the NAS entry , this is the entry price 23268 - 23200
STOP LOSS at 23100
Once it break above 23320 - bring stop loss to BE
Target 1 at 23320-60 - take 50%-70& partial
Target 2 at 23380-23400
LETS GO
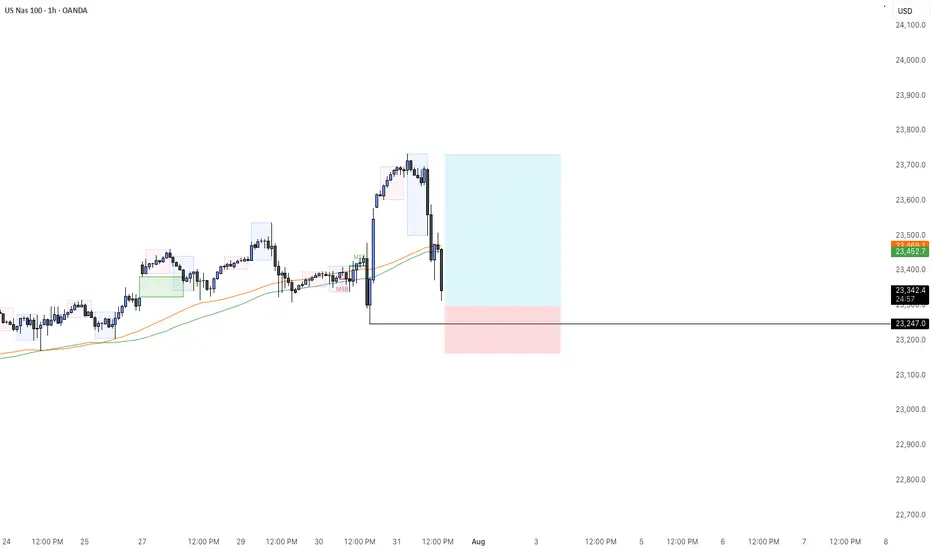
NAS100 - BUYHuge drop as expected today. Now that we are reaching its key level of interest, I will wait for a buy confirmation to take our last nights highs.
Fibonacci Retrace Strategy NAS100 Trade Idea📈 NASDAQ 100 (NAS100) is holding a strong bullish trend 🚀. After a weekend gap-up 🕳️➡️📈, price retraced back into the gap zone—exactly what you'd expect in a healthy trending market.
🔍 I'm applying my Fibonacci Expansion + Retrace Strategy 🔢, watching closely for a pullback into equilibrium ⚖️ within the previous price swing. That’s where I’ll be waiting for a bullish market structure break 🔓📊 to confirm my long bias.
🧠 Patience is key here—let the setup come to you.
📌 As always, this is not financial advice!

NextGenTraders81 NAS short swingI have my sell limit set at 23,500 as there is alot of sell limits set there, also at 23,550 hence the SL is above that zone.
I am pretty sure the position will be set on BE before it tries to return to these highs, how long it will take to hit TP, who knows.. a correction within the channel is due after numerous ATHs.
If you will follow, take partials on the way !
Good luck :)

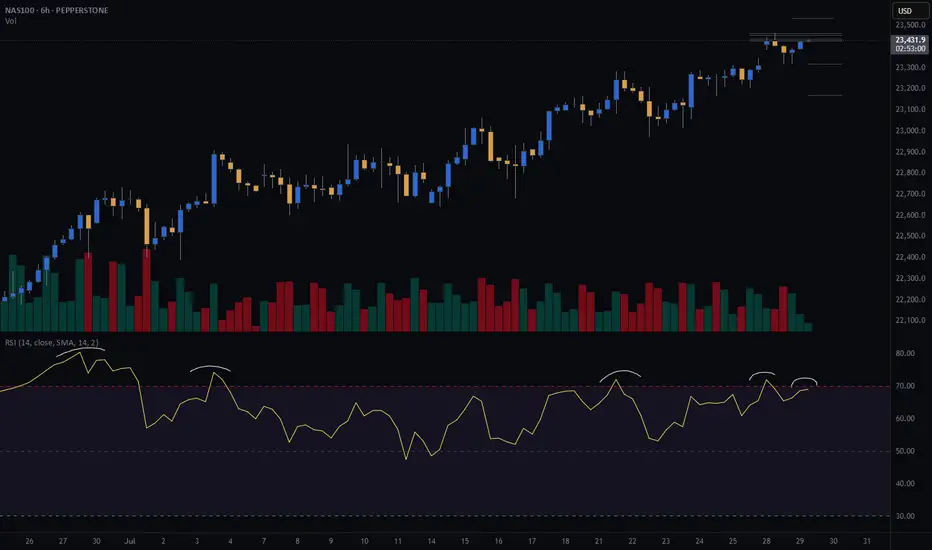
COULD THE NAS100 BREAKOUT THIS IMPORTANT FIB LEVEL?As examined similar to the SPX500, NAS100 has already reached the fib extension target of 0.618 and facing a resistance. There are indicator divergences on the weekly down to the 4H time frames suggestion a potential correction in likely soon. My thesis for this week is that NAS100 could briefly push through the resistance and clear liquidity above the fib resistance with a capitulation candle before a correction. Therefore the trade idea is caution to the upside as there are no major reversal candle yet on higher time frame but indicators are blowing warning horns so apply tight stop loss on the trade plan this week while watching for a reversal confirmation on the 4H or daily charts.

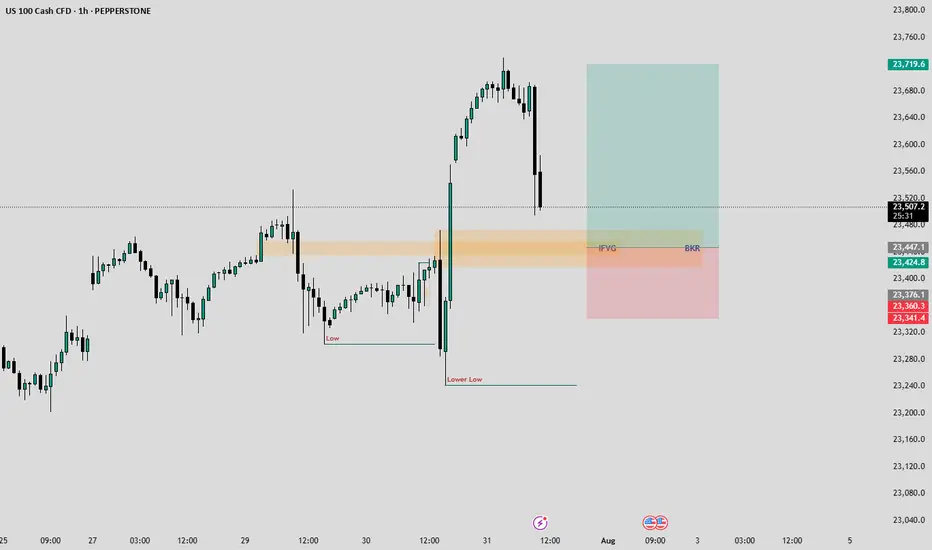
NASDAQ-Lets catch 250 Points togetherHello Fellow Traders,
Nasdaq has been wild since a time now. Today, I have spotted a rade to share with my fellow traders.
Yesterday closed with a good bullish candle. As the NY seesion has begun now, I am anticipating price to retrace to the highlighted breaker block that accurately aligns with an IFVG as well.
I am waiting for the price to fall into my area where I will monitor price's reaction, if we see signs of ejection from the highlighted areas, I wuld love to take a Buy Trade.
Entry= If rice enters the Breaker and IFVG and shows a good rejection.
SL= 23340
TP= Today's highs or 23700.
Manage your risk according toyour capital and only enter the trade if we happen to see a good rejection from the area. Be patient and don't hurry.
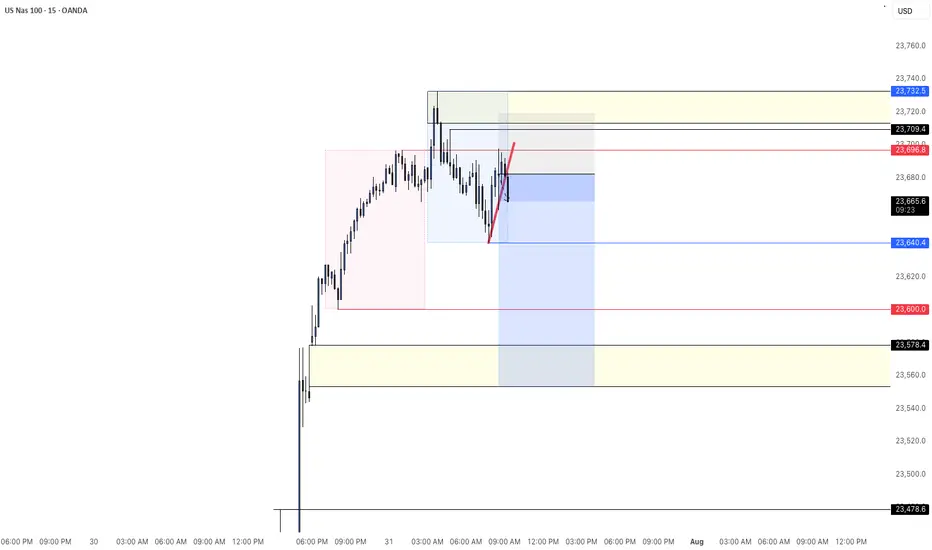
NAS/TEC100 - LETS GET NASTY ON NAS100Team, NAS currently sitting at 23480, before the US market open
however during the market open, please be aware of the volatility that may hit your stop loss
You have 2 options to trade on this NAS- NASTY
Option 1: wait for market open, if it hits 23500-23515 - then short with stop loss at 23580
Option 2: Short at the current market with small volume - and if the market open with volatile, you can take another advantage of shorting more volume as per option 1 instructed.
OK, pick your strategy! do NOT be shy.
I am going to have small short position and will consider adding more during US market opening after 5-10 minutes, much easier to see the direction of the market - we do LIVE trading everyday. Please note: if NAS fall below 23450-40 bring stop loss to BE (Break even)
1st TARGET range: 23435-23416 - make sure take 70% volume
2nd target at 23390 to 23376
Why do I short on NAS when tomorrow rate decision, i think this quarter report, market will not be the same as last quarter, even rate cut!
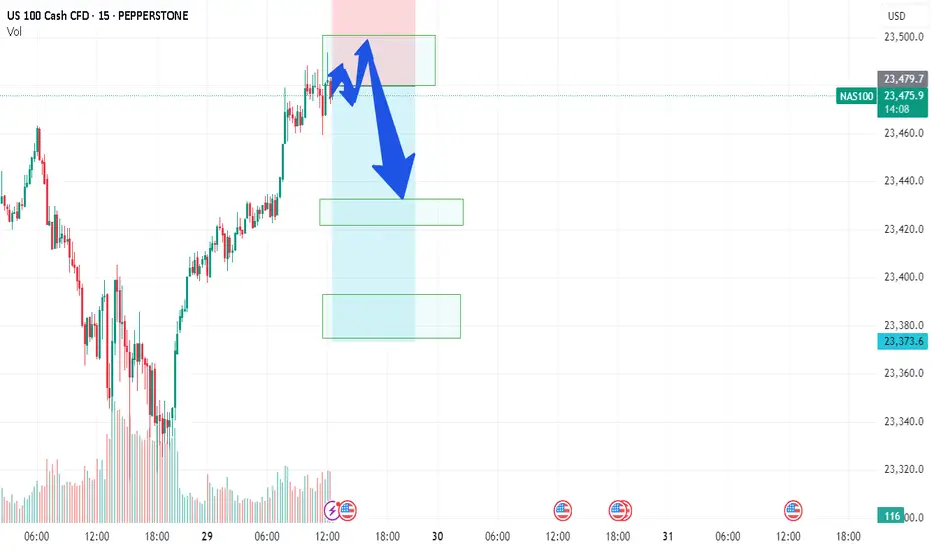
NAS100 Buy Setup – VSA & Multi-Zone Demand Analysis✅ Primary Entry Zone: Major support for current week (around 23,325–23,350)
✅ Secondary Entry Zone: Potential reversal zone if primary support is broken (around 23,200–23,230)
🎯 Target 1 (TP1): Previous swing high near 23,500
🎯 Target 2 (TP2): Extension above 23,550
🛑 Stop Loss (SL): Below 23,170 (beyond secondary reversal zone to avoid false breaks)
📊 Technical Insight (VSA & Price Action Structure)
Support Structure:
The current major support zone has been tested multiple times with no follow-through selling, indicating strong buying interest from larger players.
Volume Spread Analysis Observations:
On the recent decline into the major support zone, we see wider spreads on high volume followed by narrow range candles on lower volume, a classic sign of stopping volume and supply exhaustion.
Within the secondary reversal zone, historical reactions show climactic volume spikes leading to sharp reversals, suggesting this level is watched closely by smart money.
Any test back into the zone on low volume would confirm the No Supply (NS) condition.
Trade Pathways:
Scenario 1: Price respects the major support and begins to climb, confirming demand dominance → target TP1 then TP2.
Scenario 2: Support is temporarily breached, triggering a liquidity grab into the secondary reversal zone, followed by a bullish reversal bar on high volume → strong buy signal with potentially faster move toward TP levels.
📍 Bias: Bullish as long as price holds above the secondary reversal zone.
📌 Execution Tip: Wait for a wide spread up-bar on increased volume from either zone to confirm the start of the markup phase.
USNAS100 Correction in Play – Watching 23390 & 23440USNAS100
The price is undergoing a bearish correction while trading below 23440, with downside targets at 23300 and 23295, especially if a 1H candle closes below 23390.
A bullish scenario will be activated if price closes 1H above 23440, opening the path toward 23530 and potentially 23700.
At the moment, the market appears to be correcting toward 23295 before attempting a bullish rebound.
Support Levels: 23300 – 23210 – 23150
Resistance Levels: 23530 – 23700

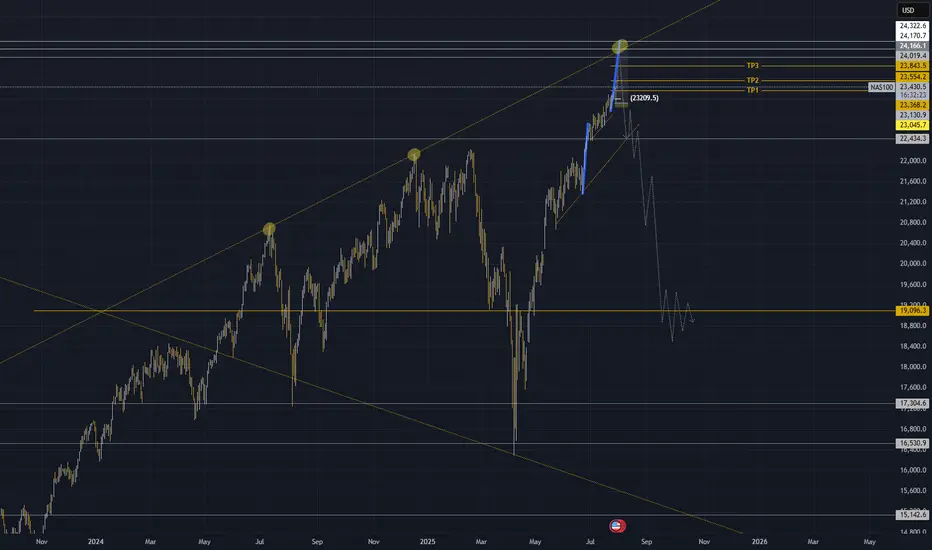
NAS100 Technical Outlook — Final Impulse Before the Fall?
The NAS100 has just completed its 5th touch on a long-term ascending trendline, forming a clear rising wedge pattern. Historically, each touch of this structure has triggered significant bearish reversals — and this time looks no different.
🔹 However, before the major drop, I'm expecting a final impulsive wave of around 1,000 pips— a last bullish move that could stretch toward the 24,300–24,400 zone. This would complete the wave structure and offer a strong sell opportunity.
🔻 After that, a deeper correction is likely, targeting the 19,000 area, which aligns perfectly with:
The midpoint of the wedge on the daily chart
A strong historical support zone
A potential area for medium-term consolidation
⚠️ As long as price remains below 24,400, the bearish scenario remains valid. Any daily close above that level would force a re-evaluation.
🧠 This setup reflects a classic distribution phase followed by a high-probability breakdown.
NAS100 - Potential TargetsDear Friends in Trading,
How I see it,
I know I'm posting the same old overbought pattern...
"I think I found a background I like at last - Just Testing"
1) A previously discussed we will notice a "SIGNAL" Type candle
2) It can be on 1HR-4HR-1D TF
3) Today is FOMC and Friday NFP
These two events will for sure give us the signals we need to clarify
the way forward
Let this very important week play out, I'll touch base again next week
I sincerely hope my point of view offers a valued insight
Thank you for taking the time study my analysis.

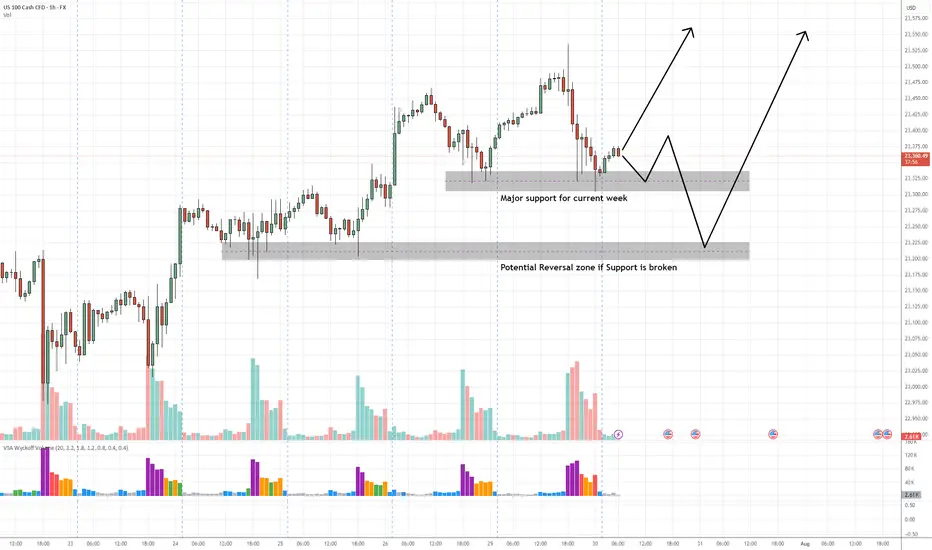
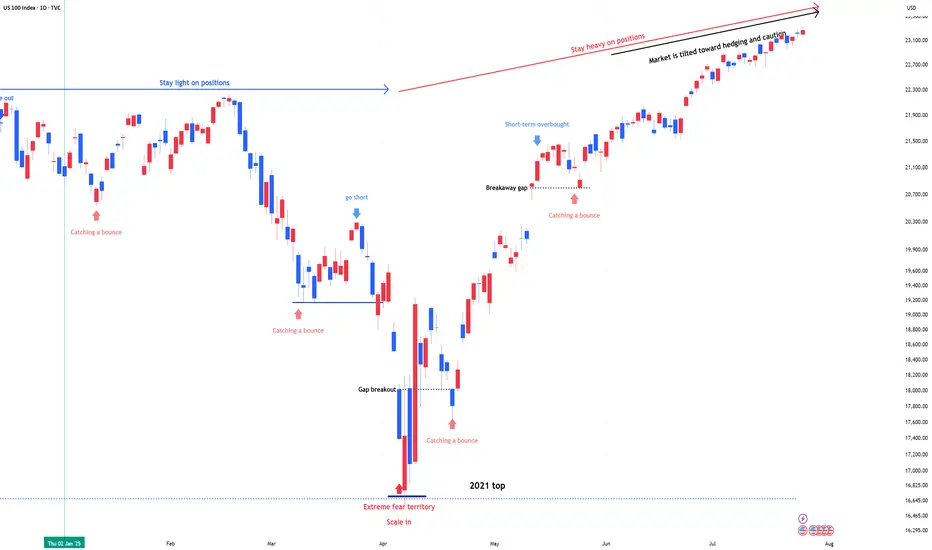
NDX & SPX , Stay heavy on positionsNDX & SPX , Stay heavy on positions (QLD, TQQQ)
Market sentiment is currently tilted toward betting on downside volatility, which ironically supports the case for the stock market to continue its upward trend.
NASDAQ (CASH100) SHORT - Double top H6Risk/reward = 4
Entry price = 23 463.1
Stop loss price = 23 534.2
Take profit level 1 (50%) = 23 169
Take profit level 2 (50%) = 23 169
All variables met. Now just need price to reach entry level and close back within range.
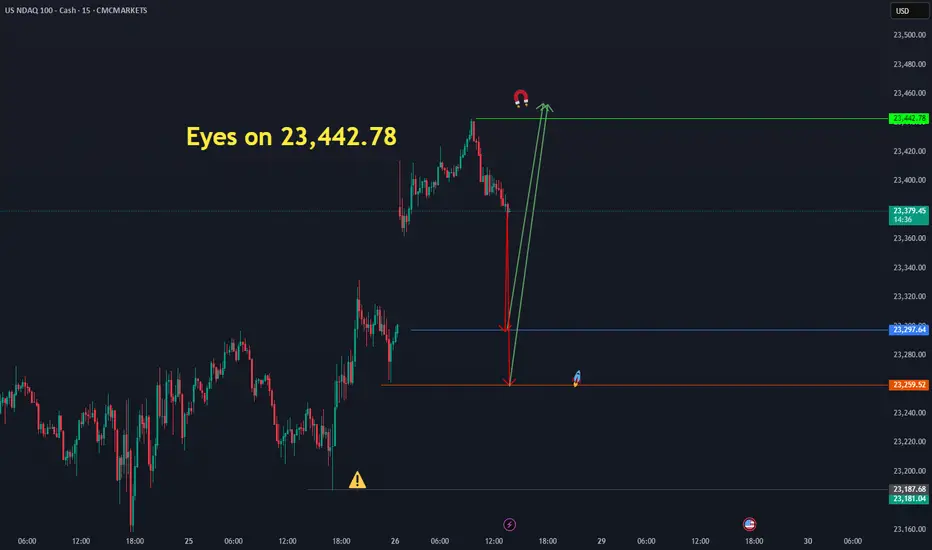
Eyes on 23,442.78 ( us 100 )The Nasdaq has the potential to move upward from the identified price levels of 23,297.64 and 23,259.52, targeting 23,442.78." CMCMARKETS:NDAQ100
Weekly UpdateBased on how the previous weeks have been running, closing bearish is my anticipation looking into the new Month. Today i will sit out and observe.
We Got The Deal - Time To Sell The NewsOkay, so we have the long-awaited deal between the US and the EU. After a large up-gap was announced last night, it now seems as if a “sell the facts” scenario is unfolding.
Such a wave of selling would also fit in well with the typical seasonal weakness that we often see in the markets from August onwards.

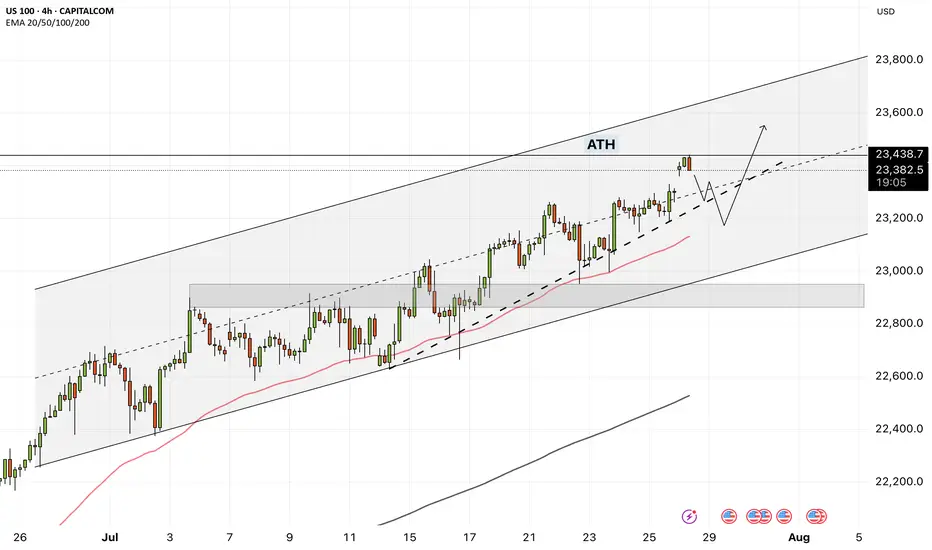
NAS100 - How will the stock market react to the FOMC meeting?!The index is trading above the EMA200 and EMA50 on the four-hour timeframe and is trading in its ascending channel. The target for this move will be the ceiling of the channel, but if it corrects towards the indicated support area, you can buy Nasdaq with better reward-risk.
As signs of easing global trade tensions begin to emerge, the Federal Open Market Committee (FOMC) is scheduled to meet this week. Analysts widely expect the Fed to hold interest rates steady for a fifth consecutive time. This anticipated decision comes as the U.S. President continues to push for rate cuts, persistently pressuring the Fed to adopt a more accommodative monetary stance.
So far, the Federal Reserve has kept its benchmark rate within a range of 4.25% to 4.5%. While some officials project two cuts by the end of the year, markets are waiting for the Fed’s patience to run out. According to the CME Group’s FedWatch tool, investors have priced in a 62% chance of a rate cut in the September meeting. By then, the Fed will have access to the July and August employment reports—key indicators of whether the labor market is weakening or remains resilient.
The upcoming week marks the peak of Q2 earnings season, with 37% of S&P 500 companies reporting results, including four major tech firms. In parallel, the August 1st tariff deadline for the EU and other countries is approaching, while legal challenges over existing tariffs remain ongoing.
According to a report by The Wall Street Journal, many large U.S. corporations have so far absorbed the bulk of tariff-related costs without passing them on to consumers. This strategy aims to maintain market share and avoid drawing criticism from President Trump. However, the question remains—how long can this continue?
Examples from the report include:
• General Motors paid over $1 billion in tariffs in Q2 alone without announcing any price hikes.
• Nike expects a $1 billion hit from tariffs this fiscal year and is planning price increases.
• Hasbro is working on a combination of price hikes and cost cuts to offset $60 million in tariff impacts.
• Walmart has made slight pricing adjustments (e.g., bananas rising from $0.50 to $0.54) and managed pressure through inventory reductions.
This week is shaping up to be one of the busiest on the economic calendar in recent months. A flood of key data on growth, inflation, and employment, alongside three major interest rate decisions, has markets on high alert.
On Tuesday, attention will turn to two significant reports: the Job Openings and Labor Turnover Survey (JOLTS) and the U.S. Consumer Confidence Index for July. These metrics will offer a clearer view of labor market dynamics and household sentiment heading into critical monetary policy decisions.
The most anticipated day is Wednesday. That day brings the ADP private payrolls report, the first estimate of Q2 GDP, and pending home sales data. Additionally, both the Bank of Canada and the Federal Reserve will announce rate decisions—events with the potential to simultaneously steer global market trajectories.
On Thursday, the July Personal Consumption Expenditures (PCE) price index will be released—a key inflation gauge closely monitored by the Fed. Weekly jobless claims data will also be published that day.
The week concludes Friday with two heavyweight economic indicators: July’s Non-Farm Payrolls (NFP) report, a crucial input for Fed policy decisions, and the ISM Manufacturing PMI, which offers insights into the health of the real economy.
Some economists argue that a September rate cut may be premature, and even suggest that no rate changes might occur in 2025. Analysts expect Fed Chair Jerome Powell to reiterate a data-dependent stance, consistent with previous meetings.
Still, beyond political dynamics, the July meeting holds independent significance.The Fed’s internal policy tone is gradually leaning more dovish, and subtle signals of this shift may emerge in the final statement. Given that only one meeting remains before September, if policymakers are leaning toward a rate cut then, it’s critical that the groundwork for such communication be laid now.
Nasdaq bearish nasdaq after taking out liquidity short term based and more bearish momentum can be expectected .
Nasdaq Index Analysis (US100 / NASDAQ):The Nasdaq index continues its medium- to long-term uptrend and has recently reached a new high at 23,466 USD.
1️⃣ A break and close below 23,200 USD could lead to a pullback toward 23,000, followed by 22,920 USD.
2️⃣ However, if the price holds above 23,330 USD, further bullish continuation is expected, potentially leading to a new all-time high.
⚠️ Disclaimer:
This analysis is not financial advice. It is recommended to monitor the markets and carefully analyze the data before making any investment decisions.
