S&P 500 - Medium Timeframe AnalysisAs illustrated, we appear to be in the final wave to the upside. At this stage, I’m treating Wave 5 as a standard impulse. However, given that Wave 4 retraced deeply, nearly to the termination point of Wave 1, there remains a modest possibility that this higher-degree Wave 5 in gray, which began in 2020, could ultimately unfold as an ending diagonal. That said, this scenario remains highly unlikely, as the internal structure of the preceding waves does not exhibit the characteristics of corrective price action.
SPX500 trade ideas

More upside after correction for SPX500USDHi traders,
Last week SPX500USD went a little more up (diagonal) just as I've said in my outlook.
Next week we could see the start of a bigger correction down (grey wave 4) and a break of the dotted trendline. Or the diagonal is a leading diagonal wave 1 and grey wave 3 extends more.
Let's see what the market does and react.
Trade idea: Wait to see if price breaks the dotted trend line (for shorts) or not (for longs).
If you want to learn more about trading FVG's & liquidity sweeps with Wave analysis, then please make sure to follow me.
This shared post is only my point of view on what could be the next move in this pair based on my technical analysis.
Don't be emotional, just trade your plan!
Eduwave

SPX GEO+ Cycle Update: "SPX: April Low Called, Target 8000+"SPX GEO+ Cycle Update: April Low Called Precisely (Next Target: 8000)
On January 5th, 2025, when SPX was trading at 5942, I published an analysis in Italian using my GEO+ Cycle methodology that made two specific projections:
📉 A low around 5000 in April 2025
📈 Then an advance targeting 8000 by 2026
Update: April delivered exactly as projected.
The geometric patterns suggested April would mark a significant turning point, and the market found strong support right in the anticipated zone and timeframe.
About GEO+ Cycles:
After 15 years studying market geometry, I've developed a framework that identifies multi-decade structural patterns. These aren't traditional technical indicators—they're mathematical relationships that help project major turning points with remarkable precision.
Current Phase:
We're now in the advancing phase of this cycle. Based on geometric projections, the target window for 8000 remains January 2026.
Important Context:
This represents cycle analysis for educational purposes, not trading advice. The methodology focuses on identifying major structural turning points rather than short-term movements.
What's Next:
I'll continue tracking this cycle's development and provide updates as we approach key geometric levels.
For those interested in learning more about geometric market analysis, feel free to follow for updates on this and other cycle progressions.
The mathematics of market geometry continue to unfold...
Note: Originally published in Italian, now sharing these insights with the global TradingView community.

Macroeconomic analysis of the American marketHello investor friends,
today I bring an update on the macro economic state of the American economy which generally moves markets around the world.
From the graph we can see the S&P 500 index on which 4 lines have been superimposed which coincide with:
- FED interest rate
- FED balance sheet
- US inflation rate
- US unemployment rate
The vertical line on the graph coincides with the date of the last update I made 5 months ago.
The central bank decides interest rates and the injection of money with the aim of keeping inflation low and avoiding too much unemployment.
At the moment we have:
- Unemployment rate at 4% (remained unchanged)
- Inflation at 2.4% (decreased compared to 5 months ago)
- The balance / release of printed money (continues to fall)
- The interest rate remained unchanged (current 4.33%)
Compared to 5 months ago the situation seems to have improved and is quite stable. The FED has decided to keep rates unchanged due to political issues as it would like to see clearly before making cuts.
In general we can say that the situation seems quite good as, unemployment is low, inflation is at optimal levels, we see that the budget/money injection is decreasing and therefore leads to maintaining regular inflation and finally the interest rates being stable maintain a low level of unemployment.
Given these factors we see that since the last update 5 months ago (i.e. in February), in the following weeks there was a collapse due to Trump's policies but that it was certainly an excellent opportunity to increase positions given that the macroeconomic situation was positive as it currently is.
From today we could certainly expect further declines due to other monetary policies or other news, but as long as the macro situation is positive we have no reason to worry.
👍 Like if you want more macro updates in the future
🙋♂️ Follow me so you don't miss my future analyses
⚠️ Disclaimer: This post is for informational purposes only and does not constitute financial advice. Always do your research before making investment decisions.
SP:SPX FRED:SP500 VANTAGE:SP500 AMEX:SPY VANTAGE:DJ30 AMEX:DIA CME_MINI:NQ1! FX:NAS100 NASDAQ:QQQ FX:EUSTX50 FOREXCOM:GER40 FX:AUS200

S&P 500 Daily Chart Analysis For Week of July 11, 2025Technical Analysis and Outlook:
During this trading week, the S&P 500 Index has shown a predominantly downward/upward course of action and created a new Key Resistance at 6280. Currently, the index exhibits a bullish bias, with the Outer Index Rally objective set at 6420. However, it is crucial to note that the current price action may cause prices to see in a new light from their current fluctuation to push toward the Mean Support at 6200 before resuming their upward movement.

Possible Wyckoff top on US500I'll be looking for this wyckoff formation on US500.
Of a new ATH is forming in the next few days and we have a stong sell off, I'll be taking the short on the Test of the Spring.

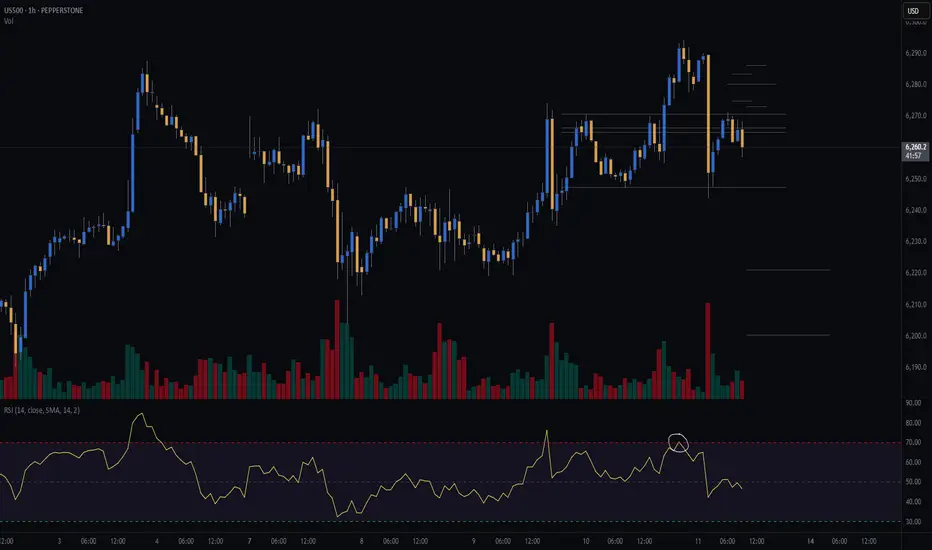
SP500 TECHNICAL ANALYSIS 30 MINUTE TIME FRAME 📊 Technical Analysis – SP500 CFD (30-Minute Chart)
✅ 1. Overall Market Trend:
The market is currently in a range-bound structure after a sharp upward move toward the 6,296 level.
Price entered a clear supply zone and reversed sharply.
Multiple BOS (Break of Structure) and CHoCH (Change of Character) events indicate clear shifts in price behavior.
📌 2. Key Structure Zones:
🟩 Demand Zones:
6,240–6,250: First active demand zone — could trigger bullish reactions.
6,180–6,200: Deeper liquidity zone within the Discount area, ideal for long setups if tested.
Price is approaching equilibrium and preparing for a potential reaction.
🟥 Supply Zones:
6,290–6,300: This premium zone caused the recent rejection and is currently acting as short-term resistance.
📈 3. Price Action & Candles:
Price created a rising wedge near the highs, which broke down.
Strong bearish candles followed, breaking key short-term structure levels.
Price is now heading into the equilibrium zone and testing demand.
📌 4. Possible Scenarios:
🔻 If Price Falls:
Watch for a reaction at the 6,240–6,250 demand zone.
If this area breaks, the next downside target is 6,180–6,200 — a high-probability liquidity zone.
🔺 If Price Rebounds:
A bullish reaction from the current zone could send price back toward 6,270+.
A confirmed break of 6,296 would open the door to higher highs.
🧠 Summary Table:
Condition Analysis
Current Status In corrective phase after bullish impulse
Short-Term Trend Bearish structure active (BOS, CHoCH present)
Key Support 6,245 → 6,180
Key Resistance 6,290–6,300
Buy Opportunity Bullish confirmation at demand zones
Sell Opportunity Weak reactions or breakdowns below BOS
⚠️ Disclaimer:
This analysis is for educational purposes only and does not constitute financial advice or a buy/sell signal.
Always trade based on your personal strategy and risk management plan.
VANTAGE:SP500

S&P 500 - Micro Count Ew AnalysisThis is my lower timeframe analysis. Price has now reached the ideal target area for Wave 3, suggesting that a corrective phase may soon follow. This potential retracement could also align with broader market reactions to a possible announcement from Trump regarding new tariffs on Russia this coming Monday.
P.S. The macro count and higher timeframe outlook will be shared later.

The S&P 500 Is Hitting New Highs, But Its Charts Look MixedThe S&P 500 SP:SPX has made a series of new all-time closing and intra-day highs in recent days as Wall Street staged a remarkable comeback from the April lows that followed President Donald Trump's announcement of "Liberation Day" tariffs. Does fundamental and technical analysis say the key index could go higher from here ... or pull back?
Let's check it out:
The S&P 500's Fundamental Analysis
The SPX fell more than 21% intraday in less than seven weeks between its Feb. 19 peak and its April 7 low as Trump rolled out his plan for big tariffs on foreign imports.
Many investors feared that high import duties -- coupled with foreign retaliatory tariffs on American exports -- would boost U.S. inflation and unemployment at the same time, creating "stagflation."
But about a week after Trump rolled out the "Liberation Day" tariffs on April 2, the president paused much of the plan for 90 days to allow for trade talks with other countries.
Risk-on assets quickly started to come back as Wall Street began to think deals with trading partners might blossom. So far, only the United Kingdom, China and Vietnam have played ball, but that's been good enough for many investors.
Meanwhile, consumer-level U.S. inflation has largely been beaten back (at least for now), and Trump has had other economic victories as well.
For example, his "Big, Beautiful Bill" of tax cuts and spending changes recently passed into law, offering what many see as multiple pro-growth provisions.
True, the Congressional Budget Office warned that the Big, Beautiful Bill could add some $3.3 trillion to the U.S. government's already huge deficits over the next decade. However, the agency's projections didn't include $2.8 trillion of expected revenues over the next 10 years from Trump's tariffs.
The CBO also chose to model almost no economic growth over the next decade, which probably isn't very realistic.
Of course, it's still unclear whether Wall Street has already priced in all of the "Big, Beautiful Bill" potential positives, or whether the measure's tax cuts and deregulation will have their desired economic effects.
Similarly, we don't know whether there are any more bilateral trade deals around the corner, or whether the Federal Reserve will soon cut interest rates -- which could boost stocks by making bond and money-market yields less attractive.
The S&P 500's Technical Analysis
Now let's look at the SPX's chart going back some four months and running through midday Tuesday:
Readers will see that the S&P 500 has been in a clear uptrend for the past three months, as denoted by the orange- and purple-shaded areas above.
The index has colored neatly within the lines, finding support at the lower trendline in mid-June. Additionally, support came at the S&P 500's 21-day Exponential Moving average, or "EMA, marked with a green line above.
More recently, the S&P 500 also enjoyed the benefits of what we call a "golden cross." That's when the index's 50-day Simple Moving Average (or "SMA," marked with a blue line) crosses above a rising 200-day SMA (marked with a red line). That's historically a bullish technical signal for the index.
The S&P 500 also experienced "Day One" bullish reversals on May 27 and June 23. Those "Day Ones" were then confirmed on June 3 and June 26, respectively.
A "Day One" reversal occurs when an index reversed direction up or down on increased trading volume, followed by a "Confirmation Day" that moves the market in the same direction as the reversal on increased volume as well. That combination typically signifies changes in an index's short-term trend.
Now, astute readers might notice that the S&P 500's June 23 "Day One" reversal occurred on decreased day-over-day trading volume.
However, that's misleading because the market day just prior to June 23 was a "triple-witching" day, which technical analysts therefore discard.
Readers should also understand that there must be at least a one-day pause between a "Day One" reversal and a "Confirmation Day." Otherwise, technical analysts will consider both days to represent one move, and we wouldn't have a volume-based technical confirmation.
Next, let's look at the SPX's chart going back to January and running through midday Tuesday:
This chart shows that the S&P 500 is in danger of putting in what's called a "Double Top" pattern of bearish reversal, denoted with the red boxes above marked "Top 1" and "Top 2." With all that's going on politically and geopolitically, that's a concern.
On top of that, Q2 earnings season begins next week, and analysts' consensus is for rather paltry 5% year-over-year earnings growth for the S&P 500 component companies as a whole.
In addition, the S&P 500 has a conflicting Relative Strength Index ("RSI") and Moving Average Convergence Divergence indicator (or "MACD").
The index's RSI, marked with gray lines at the above chart's top, is practically at technically overbought levels.
But at the same time, the daily MACD (marked with black and gold lines and blue bars at the chart's bottom) is showing signs of weakness.
The histogram of S&P 500's 9-day EMA (the blue bars) is now below the zero-bound, which is historically a short-term bearish technical signal.
On top of that, the 12-day EMA (the black line) is threatening to cross under the 26-day EMA (the gold line). This hasn't happened yet, but would be a short-term bearish signal if it did.
Add it all up and the S&P 500 is showing a mixed technical picture right now despite trading at or close to all-time record highs.
(Moomoo Technologies Inc. Markets Commentator Stephen “Sarge” Guilfoyle had no position in S&P 500-related ETFs or mutual funds at the time of writing this column.)
This article discusses technical analysis, other approaches, including fundamental analysis, may offer very different views. The examples provided are for illustrative purposes only and are not intended to be reflective of the results you can expect to achieve. Specific security charts used are for illustrative purposes only and are not a recommendation, offer to sell, or a solicitation of an offer to buy any security. Past investment performance does not indicate or guarantee future success. Returns will vary, and all investments carry risks, including loss of principal. This content is also not a research report and is not intended to serve as the basis for any investment decision. The information contained in this article does not purport to be a complete description of the securities, markets, or developments referred to in this material. Moomoo and its affiliates make no representation or warranty as to the article's adequacy, completeness, accuracy or timeliness for any particular purpose of the above content. Furthermore, there is no guarantee that any statements, estimates, price targets, opinions or forecasts provided herein will prove to be correct.
Moomoo is a financial information and trading app offered by Moomoo Technologies Inc. In the U.S., investment products and services on Moomoo are offered by Moomoo Financial Inc., Member FINRA/SIPC.
TradingView is an independent third party not affiliated with Moomoo Financial Inc., Moomoo Technologies Inc., or its affiliates. Moomoo Financial Inc. and its affiliates do not endorse, represent or warrant the completeness and accuracy of the data and information available on the TradingView platform and are not responsible for any services provided by the third-party platform.

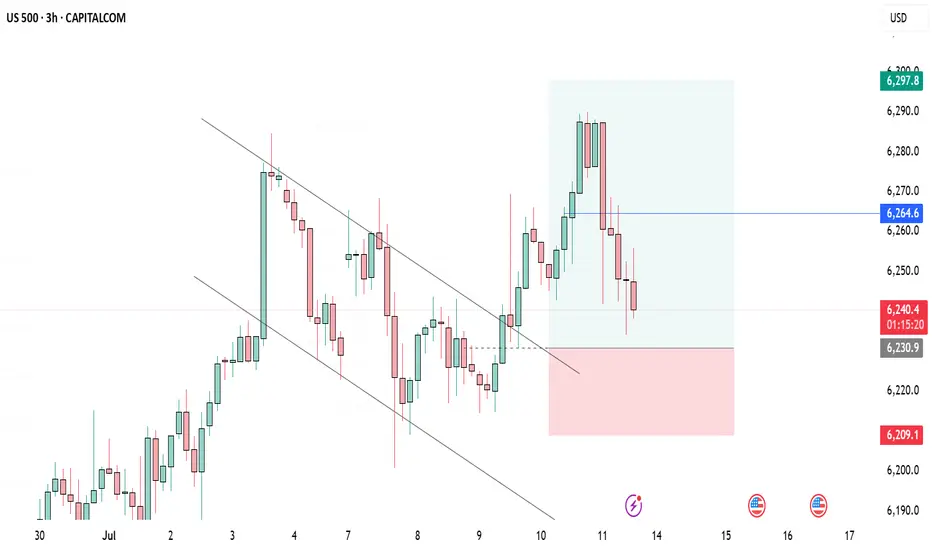
S&P 500 (CASH500) Short - Head and shoulders H1Potential short on S&P 500.
Risk/reward = 3.4
Entry = 6264.9
Stop loss = 6280.3
TP level 1 = 6221.7 (50%)
TP level 2 = 6200.5 (50%)
Need current candle to close back in range at 10.00 for all variables to be met.
Volume exception applied since current candle is the open of European markets.
Short Term Risk On S&PMomentum is slowing on the S&P 500.
HT still looking nice.
Short term chance of a correction to around 6140 - conservative, potentially to 6070 if we see a deeper sell off.
Wouldn't want to be a buyer until we see a pullback like this or some strength.

Gap down is likely a bear trap - SPYSo the gap down looked bearish but the technicals are not confirming it. One more high is likely today or Monday. Gold is at resistance here. OIl found support and looks like a long. BTC rallied and can go higher but it's putting in daily bearish divergences. Natural Gas looks like it will bounce.

$SPX Today’s Trading Range and everything in it /// 7.11.25
Beautiful start here right at the bottom of the expected move. 6245/6230 bull put spreads right at open filled. Just look at the chart to see how I came up with that.

Quick take on the S&P500From the very short-term perspective, the SP:SPX is currently stuck in a tight range. Waiting for a little breakout.
Let us know what you think in the comments below.
Thank you.
75.2% of retail investor accounts lose money when trading CFDs with this provider. You should consider whether you understand how CFDs work and whether you can afford to take the high risk of losing your money. Past performance is not necessarily indicative of future results. The value of investments may fall as well as rise and the investor may not get back the amount initially invested. This content is not intended for nor applicable to residents of the UK. Cryptocurrency CFDs and spread bets are restricted in the UK for all retail clients.

SPX500 Bearish Below 6246 – Eyes 6223 and 6195SPX500 Analysis
SPX500 stays under bearish pressure below 6246, targeting 6223 and possibly 6195 if the decline continues.
Recent tariff escalation by President Trump is adding weight to downside momentum across indices.
Pivot: 6246
Support: 6223, 6195, 6143
Resistance: 6268, 6291

20% in 60 daysSince the 90's we have seen many times where the broader market (SPX) has seen a pretty significant pull back, more than 10% and then a rally. Almost every time the market rose more than 20% in 60 days or less has been a good place to take profits. Clearly everything is super bullish right now, and I am not saying this will be the top, I am simply saying, we could experience a correction driven by profit taking. In an uptrend, you want to be a buyer on pull backs, so a pull back could give us another longer term opportunity

S&P 500 - Sell in May, return anther day. The truth - 2025No doubt everyone has heard a variation of the phrase:
“Sell in May, return another day.”
In Wikipedia it is written:
“Sell in May and go away is an investment strategy for stocks based on a theory (sometimes known as the Halloween indicator) that the period from November to April inclusive has significantly stronger stock market growth on average than the other months. In such strategies, stock holdings are sold or minimised at about the start of May and the proceeds held in cash”
A public comment from last year:
“Over 100 years ago, the (practical) reason to sell in May and September, was to pay seasonal workers to seed the field (May) and to harvest (September). Caravans of landlords and farm owners went to New York to sell stocks and withdrew money from the banks to do payrolls
so for people without agricultural business, i'll say it's okay to hold in May”
If we are to take all this at face value then we should be unwinding our long term positions until the Autumn?
What does the chart say?
On the above monthly chart of the S&P 500 each vertical line marks the month of May going back to 2012. That is a dataset of 13 points.
The facts:
1) From the month of May onwards, 11 from 13 periods returned positive price action of not less than 10%. Selling in May was a bad choice.
2) 2015 and 2022 saw corrections of 15% from May onwards. However in both examples the correction was erased within 12 months as the index continued the uptrend.
In summary, 86% of the time a minimum return of 10% was seen before the year end. Amazing odds.
Furthermore, corrections up and until the end of April (like we’re now seeing) represented some of the best long opportunities.
Sell in May go away? I suggest it should be: Buy in June and watch it boom!
Ww

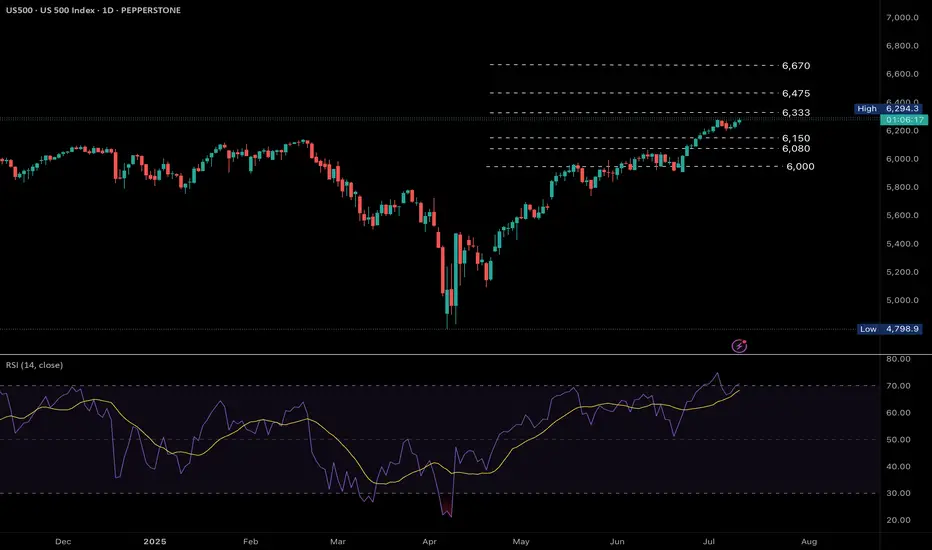
US500 trending higher as the US earnings season gains momentum. Fundamental
US500 is pushing higher as the US 2nd quarter earnings season gains momentum under President Trump's second administration amidst tariffs. Big tech earnings will have a significant impact on the index price action.
Technical
Bullish momentum is gaining as the uptrend remains strong. The RSI is approaching the overbought region however a break above the 6,333 key resistance level sees the index trading at all time highs with resistance levels at 6,475 and 6,670. A move below 6,230 sees a possible move towards supports at 6,150, 6,080 and subsequently 6,000.
by Terence Hove, Senior Financial Markets Strategist at Exness
SP500 Bullish Momentum Amid Trade DevelopmentsThe US stock index continues to trade higher as overall market sentiment remains bullish, driven by optimism despite Donald Trump's aggressive tariff stance and ongoing global trade negotiations.
Currently, the index is consolidating within a narrow range around 6260. A confirmed breakout from this zone is essential to determine the next directional move. then Upside Target will be :6,250 and 6,300
If you like this idea if you Have on Opinion about this analysis share in comments.

S&P 500 (SPX) – Gann & Market Timing Outlook!We're currently leaning towards a bullish melt-up scenario into August 2025, supported by both price structure and Gann time analysis.
🔹 Key Gann Time Clusters:
11th July 2025
14th July 2025
These dates may act as pivotal turning points. The ideal scenario for bulls would be a short-term pullback into the 15th–16th July window, which could then confirm the next major leg up.
📈 Price action is riding strongly above the 1/1 and 2/1 Gann angles – a clear sign of accumulation and strength. The setup aligns well with a continued rally targeting August 2025 as a significant cycle top before any serious correction unfolds.
🎯 Watch the coming days closely. If we get a healthy dip, it may be your best buy-the-dip opportunity ahead of a major move.

SPX possible B wave almost finishedmarket goes higher but I still think a larger correction down is coming. Gold is sideways still. OIl rejected from 68.50- so far. NG looks like it may go a bit higher. BTC is at the top of it's range.

Congress passes H.R 1 into law. About the new bill.🔵 In what's been an eventful last few weeks congress passed H.R 1 which is essentially Trump's 900 page mega bill Act. Both Democrats and Republicans ultimately united against each other over the bill with Vice President Vance casing the tiebreaking vote giving Senate Republican's the large legislative victory.
🔵 To note is that independent-minded Republican Lisa Murkowski, senator of Alaska had some concerns with the bill before GOP negotiators we're able to acquire her vote for the 50-50 votes. Murkowski's primary issue was with the legislation's changes to Medicaid and federal food assistance funding which she was concerned would hurt her home state understandably. Republican's originally tried to sway her vote by adding language to shield Alaska from the full effect of the legislation's Medicaid and SNAP cuts.
🔵 Parliament opposed that as it violated the Byrd Rule which is there to determine the legislation that can go into a budget reconciliation package as well as passing with only GOP votes. Least to say the amendment was reworked many times in order for the waivers for the SNAP funding cuts to apply more broadly than just Alaska and Hawaii. Parliament rejected the prior amendment and language which targeted just the two states understandably.
🔵 With the rework the new SNAP provisions are planned to reduce food assistance funding more slowly in about 10 states with the number ultimately being decided by a formula and based on the error rate in delivering food assistance benefits in a year. After an arduous process the amendment was passed and Republican's secured the vote with Murkowski saying it was an agonizing process.
🔵 When speaking with reporters afterwards Murkowski noted that the process was stressful with them operating under an artificial timeline in reference to the pressure Trump put on the Senate to pass the bill.
🔵 Her concern was as follows: “Rather than taking the deliberative approach to good legislating, we rushed to get a product out. This is important. I want to make sure that we’re able to keep in place the tax cuts from the 2017 Jobs Act,” said Murkowski when asked about her support for the bill and why it was hard for her to come around to giving her vote.
🔵 “I struggled mightily with the impact on the most vulnerable in this country when you look to the Medicaid and the SNAP provisions,” said Murkowski. This point highlights just how the effort to push the bill through was met with haste and pressure notably.
🔵 The bill itself is projected to add $2.8 trillion to the federal deficit by 2034. Main reason for that would be thanks to a reduction in revenues as well as interest cost which could have the deficit rise by a potential $5 trillion if some temporary provisions become permanent. Interest payments on the national debt are also expected to increase significantly by 2034.
🔵It should be noted that these numbers and estimates are based on a "current law" baseline and are largely thanks to tax cuts in the bill with Economist having differing opinions on the economic impact of the bill. Time will tell us how estimates go but least to say this is a large turnaround from what many we're expecting with even DOGE's Elon Musk opposing the Bill and forming a new party in strong opposition.
🔵 The tax and spending bill will see spending increase and phase in a cut to Medicaid of an estimated $1 trillion over the next decade with the CBO projecting roughly 11.8 million more American's t hat would become uninsured within the next 10 years compared to the current law. This could lead to many losing healthcare services due to medical cost with states as well likely needing to adjust their own programs and having to take on a larger share of the cost whether that means reducing services or even closing some facilities.
🔵 The bill has many key changes but in summary it solidifies many tax breaks from Trump's first term with an estimated $4.5 trillion in tax cuts alongside tax deductions on tips, overtime and auto loans with deductions for adults that make under $75,000 and a boost to the child tax credit from $2,000 to $2,200 though millions of families at lower income levels would still not receive the full credit as one of the credit's, requirements is a minimum earned income of $2,500. In 2022 alone an estimated 18 million children under age 17 (26 of all children) were ineligible for the full child Tax credit because the family income was not high enough as reported by Columbia University's Center on Poverty and Social Policy.
🔵 To say in the least the new bill has many implications for the country and the next few months and years will definitely represent those changes and how the country shifts and adjusts to this with many having differing opinions understandably. I'll definitely keep you guys posted through it all but definitely a lot to see so much happen so quick and only time will tell and show us just how things play out simply put. The market itself is still continuing within this ascending channel, especially since we got that convergence with the 200 EMA and broke that $6,130 resistance. $6,300 is what I'm expecting resistance to hit the strongest so definitely gonna keep an eye there as traders process the news and changes.
🔵 Have to go but grateful as always for the support, definitely a long idea here but wanted to focus on some important points though the bill itself has so many changes it's hard to go over every one but you get the point. This is a big changes and we'll definitely see things shift a lot over the next few months and years and as always we'll keep posted with things. Thanks as always and all the best.
Best regards,
~ Rock'
