update TP for NASDAQ i see more ups for NASDAQ .The Nasdaq index touched strong support, so I think it will rise further, as shown.
SPX500 trade ideas

-(update)- Opportunity for buying NASDAQ After careful observation and relying on support and resistance, I see an upward movement from the support represented in front of you.


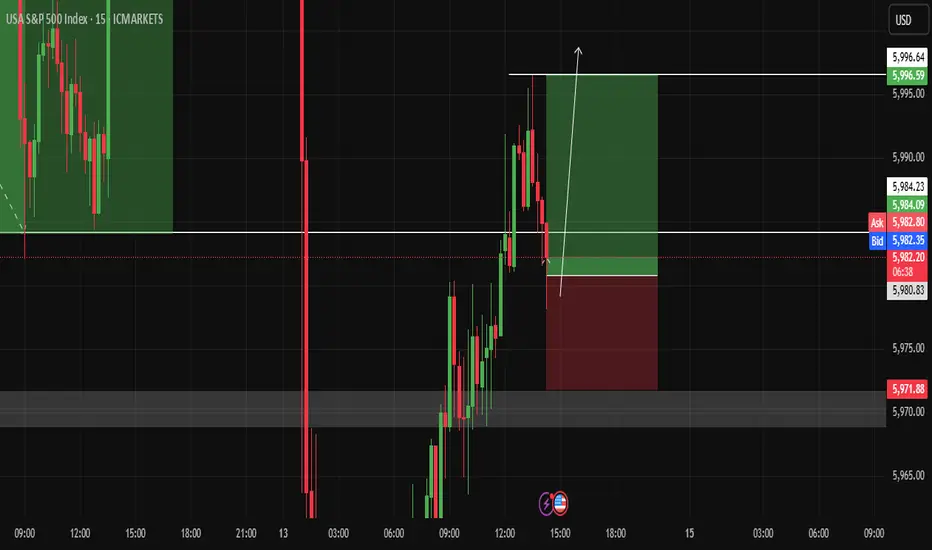
Opportunity to buy NASDAQBy combining support and resistance, I see NASDAQ rising to 5996 before reaching to 5971
SPX500 | Bearish Below 6010 Amid Rising Geopolitical TensionsSPX500 | OVERVIEW
The index remains under bearish pressure due to escalating geopolitical tensions, particularly the ongoing conflict.
As long as these conditions persist, the market is likely to maintain a downward bias.
Technical Outlook:
As long as the price trades below the 5990–6010 pivot zone, the bearish trend is expected to continue toward 5938.
A confirmed stability below 5938 may lead to further downside toward 5902 and 5858.
A bullish reversal is only likely if hostilities cease or negotiations begin between the conflicting parties.
Pivot Zone: 5990 – 6010
Support Lines: 5938, 5902, 5858
Resistance Lines: 6041, 6098, 6143
previous idea:

S&P500Both COT data and price action indicate the start of bearish momentum, making this a high-probability setup for a downside move Short Entry: Enter a short position due to the bearish setup.

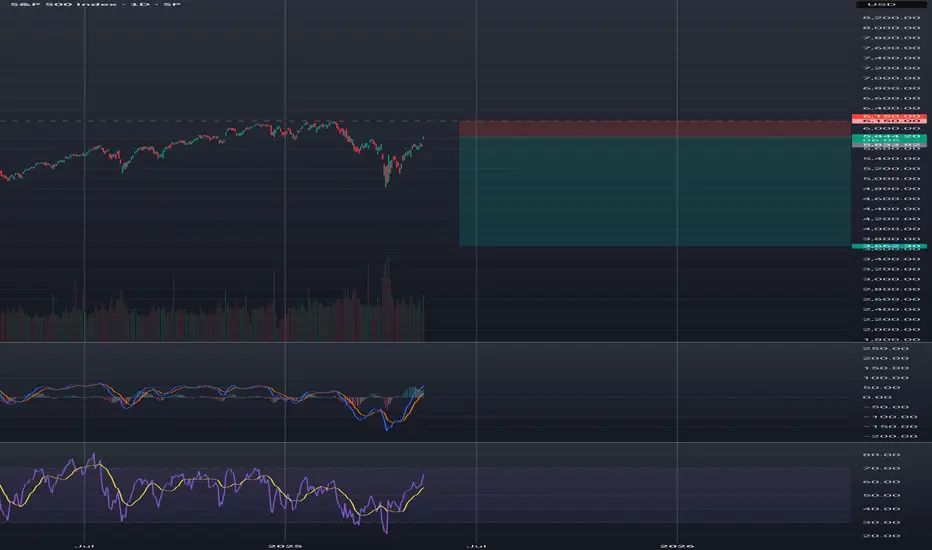
The sell moment is coming? SP500Market is greed as of now, and the chart is showing a potential reversal pattern. I expect a quick short liquidation first and a big short next. I expect the market to retrace till the 5700 level in the coming weeks.
If you are a scalp trader, check my accounts page!
[06/09] [GEX] Weekly SPX OutlookLast week’s outlook played out quite well — as anticipated, SPX hit the 6000 level, closing exactly there on Friday. This was the realistic target we highlighted in last week's idea.
🔭 SPX: The Bigger Outlook
It's difficult to say whether the rising SPX trend will continue. We're still in the "90-day agreement period" set by the administration, and so far, the market has shown resilience, avoiding deeper pullbacks like the one we saw in April.
With VIX hovering around 17–18, we’ve reached a zone where further SPX upside would require volatility. For the index to continue rising meaningfully, it needs to reverse the current bearish macro environment, and that can only happen with strong buying momentum — not a slow grind.
The parallel downward channel drawn a few weeks ago is still technically valid. Even a short 100-point squeeze would fit within this structure before a larger move down unfolds.
GEX levels give us useful clues heading into Friday. We're currently in a net positive GEX zone across all expirations, giving bulls a structural advantage, just like last week.
As of Monday’s premarket, SPX spot is at 6009.The Gamma Flip zone is between 5975–5990, with a High Volume Level (HVL) at 5985.
🔍 Let’s zoom in with our GEX levels — this gives us a deeper view than our GEX Profile indicator for TradingView alone.
🐂 🟢 If SPX moves higher, the following are logical profit-taking zones:
6050 (Delta ≈ 33)
6075 (Delta ≈ 25)
6100 (Delta ≈ 17)
🎯 Targeting above 6100 currently feels irrational — for instance, the next major gamma squeeze zone is at 6150, but that corresponds to a delta 6 level (≈94% chance the price closes below it), so I won’t aim that high yet.
🐻🔴 In a bearish scenario:
5975 and 5950 are the first nearby support zones (Deltas 30 and 38).
If momentum picks up, 5900 becomes reachable quickly, even if it's technically a 17-delta distance — because that’s deep in the negative GEX zone.
📅 Don’t forget: On Wednesday premarket, we’ll get Core Inflation Rate data — a key macro risk that could shake things up, regardless of TSLA drama fading.
📌 SPX Weekly Trading Plan Conclusion
Whatever your bias, keep cheap downside hedges in place. We've been rising for a long time, and even if SPX breaks out of the descending channel temporarily, resistance and the gamma landscape may pull price back swiftly.

S&P 500 Breaks UptrendS&P 500 Breaks Uptrend
Only yesterday we questioned the sustainability of the stock market’s upward trend amid alarming news from the Middle East and the evacuation of the US embassy in Iraq — and today, the S&P 500 chart (US SPX 500 mini on FXOpen) shows a break below the lower boundary of the ascending trend channel.
According to media reports:
→ Steve Witkoff, US President Donald Trump’s special envoy to the Middle East, was expected to meet Iran’s Foreign Minister in Oman on Sunday.
→ Friday the 13th became the date when Israel launched strikes on Iran’s nuclear facilities, dramatically altering the outlook for a potential US-Iran nuclear agreement.
→ Secretary of State Marco Rubio stated that the US was not involved in the operation, while Israel’s state broadcaster reported that Washington had been informed ahead of the strikes.
Technical Analysis of the S&P 500 Chart
Yesterday morning, we noted that the Q-line, which divides the lower half of the channel into two quarters, had shifted from acting as support to becoming resistance. This was confirmed during the US trading session (as indicated by the arrow).
Selling pressure intensified, and the psychologically important 6,000 level — which showed signs of support earlier in June — now appears to be acting as resistance. It is in this area that the E-Mini S&P 500 (US SPX 500 mini on FXOpen) broke below the lower boundary of its uptrend channel.
In addition to ongoing discussions about potential Fed rate cuts this summer, geopolitical risk assessments are now also in focus. It remains unclear how Washington will respond if Iran retaliates.
Meanwhile, Israel’s Defence Minister has declared a state of emergency, warning of an imminent missile and drone attack — further fuelling fears of a possible escalation.
This article represents the opinion of the Companies operating under the FXOpen brand only. It is not to be construed as an offer, solicitation, or recommendation with respect to products and services provided by the Companies operating under the FXOpen brand, nor is it to be considered financial advice.


DOOR TO HELL IS ABOUT TO OPEN AND NO ONE IS READY.Well where do I being, firstly the world has become nonsensical and the average joe thinks they are an expert in the financial field. Little do they know the trap has been set and now it's about to be played and the fools that have been investing for the past decade are about to loose everything they worked hard for.
FOOLS DON'T REALISE THAT THE STOCK MARKET IS ABOVE A 100 YEAR TRENDLINE AND THE PAST TIMES IT HAS HIT THIS TRENDLINES 1929, 2000, 2009, 2021, THE MARKET CRASHED AND PUT THESE IDIOTS IN THEIR GRAVES. YOU CANT FKING DISRESPECT A 100 YEAR TRENDLINE AND THINK IT WILL GO PARALABOLIC, "TO THE FKING MOON THEY SAY". Yes I am a bear, the biggest bear in the forest but I am also trying to make people understand what is about to come no one is ready.
SPX Will crash from 6069 to 420, it will drop 30% with a rebound on the 1.618 fib to 550 and then the mother of all crashes will come into play a 80-90% correction to 160, the 2009 tops. No one is ready for this play.
SPEAD THOSE CHEEKS WIDE BULLS, WHAT IS ABOUT TO HAPPEN THEIR IS NO RETURN. no homo.

Volatility Incoming - But Price Will Say WhenKey levels on SPX and NDX
5905 big gamma level and hedging level for June 30 monthly and quarter expiration
DXY watching for potential bear trap and range trade
Gold, Silver, Bitcoin and others all discussed
Thanks for watching!!!

Bulls game over now 4611 incoming Weekly TF down move incoming..Fasten your seatbelt please..Big move incoming.. Good luck and safe Short from 6040 Tp 4611

update at 12pmMarket has reentered the wedge, not a great sign, but we'll have to see how the day loses. Nat Gas came down hard. Gold is holding support, BTC getting a bounce but I think it goes lower. OIL had a nice bounce but may fall here.

S&P 500 Breaks Out — Trump, Tariffs & Bullish Island PatternDonald Trump has mentioned the US stock market in every meeting he has held in the past few days, which has caused the US stock market indices , including the S&P500 Index ( SP:SPX ), to rise:
"Better go out and buy stocks now".
President Donald Trump told a crowd in Saudi Arabia on Tuesday that the markets are just getting started. “It’s going to get a lot higher,” he said, right as the S&P 500 posted its first gain since late February.
But one of the main reasons for the increase in the S&P 500 Index and US stocks is The United States has dropped its tariffs on Chinese goods to 30% , down from a brutal 145% , while China is slashing its own duties on US imports to just 10% , temporarily, for the next 90 days .
-------------------------------------------------
Now let's take a look at the S&P 500 Index chart on the daily time frame .
S&P500 Index managed to break the Resistance zone($5,737_$5,506) and 21_SMA(Weekly) by Breakaway Gap .
In terms of Classic Technical Analysis , the S&P500 Index has managed to form a Bullish Long Island Pattern , and this pattern is one of the continuing patterns and will be a sign of the continuation of the S&P500 Index's upward trend .
In terms of Elliott Wave theory , it seems that the S&P500 index has completed the corrective wave and is in new impulsive waves , which could cause a new All-Time High(ATH) to form.
I expect the S&P500 index to increase by at least +5% as it approaches the Uptrend line , and we will see the possibility of a new ATH .
Please respect each other's ideas and express them politely if you agree or disagree.
S&P 500 Index Analyze (SPX500USD), Daily time frame.
Be sure to follow the updated ideas.
Do not forget to put a Stop loss for your positions (For every position you want to open).
Please follow your strategy and updates; this is just my Idea, and I will gladly see your ideas in this post.
Please do not forget the ✅' like '✅ button 🙏😊 & Share it with your friends; thanks, and Trade safe.

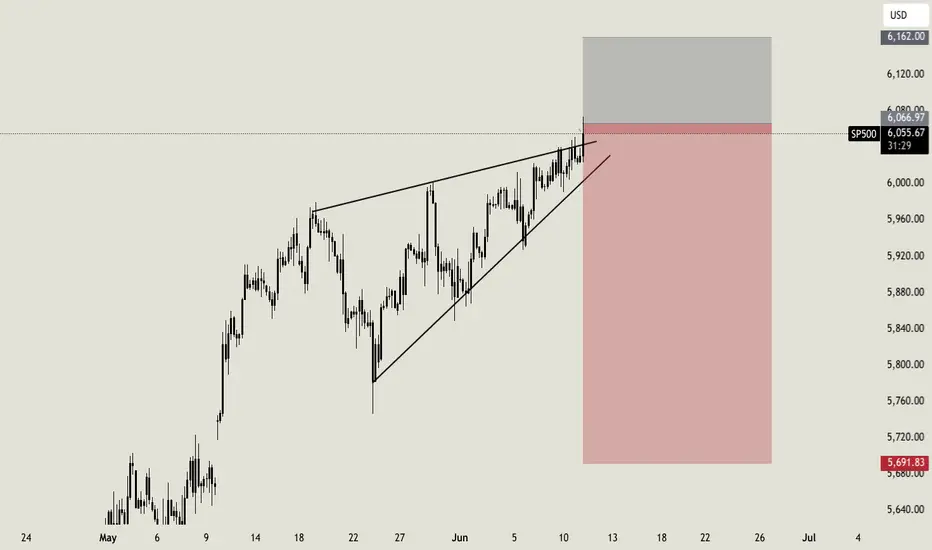
SPX / SP500 Short - RISING WEDGE WARNINGYou can see the index is currently moving in a rising wedge, which is a bearish indicator once the structure breaks down. There might be a small upside for a very limited time, but mid-term we are moving down.

Bulls and Bears zone for 06-12-2025Overall market is continuing to rally in general.
However, market sold off during ETH session and it's trying to recover in the morning.
Level to watch : 6017----6019

Premarket update - SPX USOIL GOLD NAT GAS BTCSPX sold off more overnight, but nothing dramatic yet. I do believe we will have a negative day today. Gold looks good for more upside and possibly to all time highs eventually. NAT GAS looks like a short and so does OIL. BTC probably a bit lower to 105k.

S&P500 INTRADAY consolidation range Boeing Crash: An Air India Boeing 787 crashed after takeoff from Ahmedabad to London, killing all 242 on board. It’s the worst accident involving this model. Boeing shares dropped on renewed safety concerns.
Trump Tariffs: Donald Trump plans to set new tariff rates within 1–2 weeks before a July 9 deadline. The EU may be last to get a trade deal. Japan is cautious about any agreement.
US-UK Trade Deal: The US and UK plan to move quickly on a trade deal. The EU is expected to face delays.
Tariff Pause: The US may extend a 90-day pause on tariffs for countries negotiating seriously.
Middle East Tensions: The US is pulling embassy staff as tensions rise. Iran warned of retaliation if nuclear talks fail. Reports say the US is preparing for a possible Israeli strike on Iran. Oil prices eased.
Key Support and Resistance Levels
Resistance Level 1: 6060
Resistance Level 2: 6120
Resistance Level 3: 6172
Support Level 1: 5960
Support Level 2: 5900
Support Level 3: 5800
This communication is for informational purposes only and should not be viewed as any form of recommendation as to a particular course of action or as investment advice. It is not intended as an offer or solicitation for the purchase or sale of any financial instrument or as an official confirmation of any transaction. Opinions, estimates and assumptions expressed herein are made as of the date of this communication and are subject to change without notice. This communication has been prepared based upon information, including market prices, data and other information, believed to be reliable; however, Trade Nation does not warrant its completeness or accuracy. All market prices and market data contained in or attached to this communication are indicative and subject to change without notice.

SPX500 | Bearish Below 6010 Ahead of PPI – Trade Talks in FocusSPX500 | OVERVIEW
US Futures Edge Lower Ahead of PPI Report
U.S. stock futures dipped on Thursday as investors await the latest PPI data, following a softer-than-expected CPI report that eased pressure on the Federal Reserve to hike rates.
On the geopolitical front, U.S. and Chinese negotiators have reached a preliminary trade agreement during talks in London. However, the deal still requires formal approval from Presidents Trump and Xi.
📉 Technical Outlook:
The index holds a bearish momentum as long as it trades below the pivot level at 6010. If price remains under this level, it may extend the decline toward 5966, and a firm close below this support could open the path to 5938 and 5902.
📈 A bullish reversal may occur if the price breaks above 6010, with confirmation on a 1H close above 6020, targeting higher resistances.
Support Levels: 5966, 5938, 5902
Resistance Levels: 6033, 6056, 6098

S&P 500 Maintains Uptrend — But for How Long?S&P 500 Maintains Uptrend — But for How Long?
As the chart of the S&P 500 (US SPX 500 mini on FXOpen) shows, price movements in June continue to form an upward trend (highlighted in blue).
The bullish momentum is being supported by:
→ News of a potential trade agreement between the United States and China;
→ The latest inflation report. Data released yesterday showed that the Consumer Price Index (CPI) slowed from 0.2% to 0.1% month-on-month.
President Donald Trump described the inflation figures as “excellent” and said that the Federal Reserve should cut interest rates by a full percentage point. In his view, this would stimulate the economy — and serve as another bullish driver.
However, as illustrated by the red arrow, the index pulled back yesterday from its highest level in three and a half months, falling towards the lower boundary of the channel. This decline was triggered by concerning developments in the Middle East. According to media reports, the US is preparing a partial evacuation of its embassy in Iraq, following statements by a senior Iranian official that Tehran may strike US bases in the region if nuclear talks with Washington fail.
Technical Analysis of the S&P 500 Chart
Currently, the price remains near the lower boundary of the ascending channel, reinforced by the psychologically significant 6,000-point level.
However, note that line Q — which divides the lower half of the channel into two quarters — has flipped from support to resistance (as indicated by black arrows). This suggests increasing bearish pressure, and there is a possibility that sellers may soon attempt to push the price below the channel support.
Be prepared for potential spikes in volatility on the E-Mini S&P 500 (US SPX 500 mini on FXOpen) chart as markets await the release of the Producer Price Index (PPI) at 15:30 GMT+3 today.
This article represents the opinion of the Companies operating under the FXOpen brand only. It is not to be construed as an offer, solicitation, or recommendation with respect to products and services provided by the Companies operating under the FXOpen brand, nor is it to be considered financial advice.

SPX'S BULLS !6200 Will get touched easily soon !
because the much vol up there waiting to be hunted at 6100+
𓄀𝓈𝓉𝒶𝓎 𝓉𝓊𝓃ℯ𝒹 𓃓

Recession? Weak. Let's Do a DepressionS&P pulled a fast one — but the real show might be just warming up.
Markets tease, bounce, tempt. And then — they punish.
After a sharp rebound, S&P500 is still below 6,150, with weak volumes. The recent rally looks more like a bear trap than a new impulse.
Trading note:
Possible short entries can be considered from current levels, with 50% now, 25% near 6,000, and 25% at 6,100. Stop-loss only after 4H close above 6,150. No clean levels below that — only noise and traps.
This market isn't about fundamentals. It's about desperation. Participants are chasing returns in a shrinking pie, taking on absurd risks.
And now, buckle up:
We are entering what might be the most dramatic market weeks in decades. This is setting up to be a mega-short, folks. Get ready for turbulence. Fasten your seatbelts.
---
Important:
This is NOT a recommendation to trade. This is an extremely high-risk scenario shared for discussion purposes only. If you've already made such a mistake and entered, respect your money and risk management. Losses are much harder to recover than gains.