The worst drops often come later!Don’t be fooled by the first crash… The worst drops often come later in a bear market.
Let’s break down the brutal truth about the 2008 GFC and what it teaches us today. 🧵
1.
In the 2007–2009 bear market, the S&P 500 had 7 failed rallies before finally bottoming.
Every bounce looked like the bottom — and every one was a trap.
👇
2.
The early drops were steep:
🔻 Down 11%
🔻 Down 17%
But the most violent crashes came after those…
Near the END — not the beginning — of the bear market.
3.
Later stage declines:
❌ Down 28%
❌ Down 36%
❌ Down 29%
That’s when capitulation kicked in.
Investors gave up. Fear took over.
4.
Capitulation volume isn’t a guaranteed bottom.
It feels like it’s over.
But if fundamentals haven’t turned and the trend isn’t broken, the bear can still bite — hard.
5.
Final crashes are like cliffs:
Markets are exhausted.
Hope is crushed.
And that’s finally when the real bottom shows up.
6.
The lesson?
Bear markets are full of traps.
Relief rallies can fool even seasoned pros.
Stay patient. Wait for trend confirmation. Don’t chase fake bottoms.
7.
📉 The biggest crashes usually happen at the end of the bear market.
That’s the final flush — and it sets the stage for true opportunity.
Learn from the past. Don’t get trapped. Stay sharp.
SPX500 trade ideas

Potential bearish drop?S&P500 is rising towards the pivot, which is a pullback resistance that aligns with the 61.8% Fibonacci retracement and could drop to the 1st support.
Pivot: 6,362.20
1st Support: 6,214.78
1st Resistance: 6,436.72
Risk Warning:
Trading Forex and CFDs carries a high level of risk to your capital and you should only trade with money you can afford to lose. Trading Forex and CFDs may not be suitable for all investors, so please ensure that you fully understand the risks involved and seek independent advice if necessary.
Disclaimer:
The above opinions given constitute general market commentary, and do not constitute the opinion or advice of IC Markets or any form of personal or investment advice.
Any opinions, news, research, analyses, prices, other information, or links to third-party sites contained on this website are provided on an "as-is" basis, are intended only to be informative, is not an advice nor a recommendation, nor research, or a record of our trading prices, or an offer of, or solicitation for a transaction in any financial instrument and thus should not be treated as such. The information provided does not involve any specific investment objectives, financial situation and needs of any specific person who may receive it. Please be aware, that past performance is not a reliable indicator of future performance and/or results. Past Performance or Forward-looking scenarios based upon the reasonable beliefs of the third-party provider are not a guarantee of future performance. Actual results may differ materially from those anticipated in forward-looking or past performance statements. IC Markets makes no representation or warranty and assumes no liability as to the accuracy or completeness of the information provided, nor any loss arising from any investment based on a recommendation, forecast or any information supplied by any third-party.

S&P 500 Obeying Elliott Wave TheoryThis is an update of a previous publication. A Flat occurred for Wave 2(Green) and if Wave 3 is over, we can expect a Zigzag for Wave 4. Zigzags have 3 waves. A confirmation at its current location will trigger a sell for Wave 4(Green).
For more information on the same, go to:

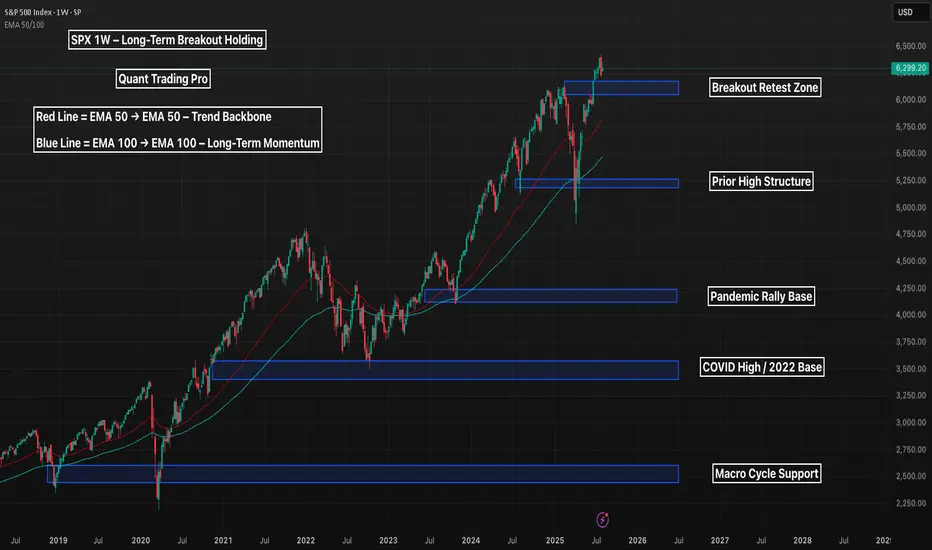
SPX 1W – Long-Term Breakout Holding, Can the Rally Sustain?The S&P 500 just printed a weekly breakout above historical highs, tapping into uncharted territory above 6,300 — but now the question is whether the trend can sustain or if a deeper retest is on the horizon.
🔹 Macro Structure
Multiple clean support levels exist below, each marking prior macro pivots — from the 2020 breakout to the 2022 base.
The most immediate zone of interest is 6,100–6,200, which could act as a bullish retest zone if this breakout is valid.
Deeper downside remains structurally healthy unless 4,250 or below is breached.
🔹 Trend Health
Price remains well above the EMA 50 and 100, showing no signs of structural weakness.
Pullbacks into the EMAs historically triggered trend continuation — and bulls will likely treat those zones as reload points.
🔹 Big Picture
As long as SPX holds above 5,400, the macro bull trend remains intact.
A drop to retest lower zones wouldn’t necessarily break the uptrend — but it would shake sentiment and invite reaccumulation.
Is this the beginning of a new macro leg — or the last shake before a deeper correction?
Let’s chart it out 👇
S&P 500 ETF & Index– Technicals Hint at a Possible Correction📉📊 S&P 500 ETF & Index at Resistance – Technicals Hint at a Possible Correction 🔍⚠️
Everything here is pure technicals— but sometimes, the market whispers loud and clear if you know how to listen. 🧠📐
The VOO ETF, which tracks the S&P 500 , has now reached the upper boundary of a long-term ascending channel, once again brushing against resistance near 590.85. This zone has consistently led to major pullbacks in the past.
On the right panel, the US500 Index mirrors this move—pushing toward all-time highs, right as broader sentiment turns euphoric. Technically, both charts are overextended and pressing into key zones.
👀 Potential Path:
🔻 Rejection from current zone ➝ Down toward 526.17, then 465.72 (green support channel)
🔁 Possible bounce after correction — trend still intact long term
And while we’re keeping it technical, it’s worth noting that the Buffett Indicator (Stocks-to-GDP) i s currently screaming “overvaluation.” This doesn't predict timing—but it adds macro context to an already overheated chart setup.
The lesson? Price respects structure. Whether or not the fundamentals are in agreement, the charts are warning that now may not be the time to chase.
History doesn’t repeat, but it often rhymes. Stay sharp, stay technical. 🎯
One Love,
The FX PROFESSOR 💙
ps. the beauty of these levels? Tight Stop loss- excellent R/R
Disclosure: I am happy to be part of the Trade Nation's Influencer program and receive a monthly fee for using their TradingView charts in my analysis. Awesome broker, where the trader really comes first! 🌟🤝📈


Activation of the rounded pattern? Or a trend reversal?In the previous analysis, we mentioned that the price was at a decision point — and it made its decision, managing to move up slightly before returning to the bottom of the channel.
Now, at the end of the channel, a pattern has formed. We need to see whether it gets activated or turns out to be a fake.
If the pattern fails (turns out fake), the bullish trend could continue more strongly.
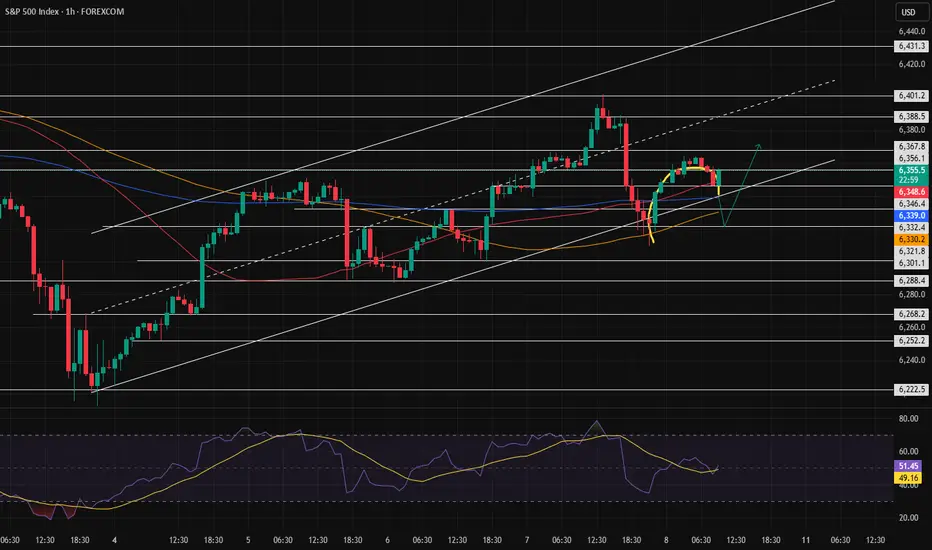
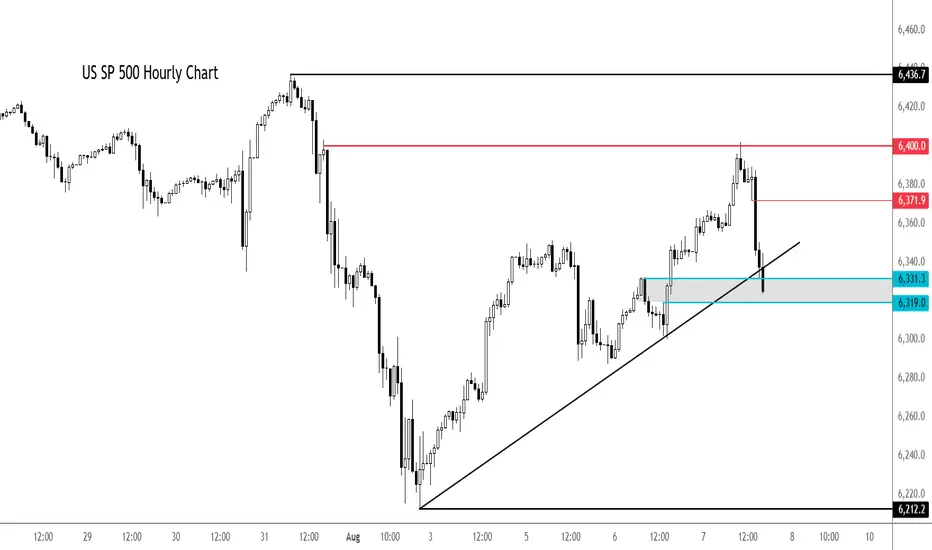
S&P 500 extends drop - can dip buyers come to rescue again?After a decent rally earlier in the day, the major indices and futures started to ease off around mid-morning London trade, before easing further lower in the last couple of hours.
At the time of writing, the S&P was testing its session lows. Here it was probing support and a short-term bullish trend line in the 6319-6331 range. This area needs to hold to keep the bulls happy and in charge. Break this and we could see a bigger correction in the days ahead.
Resistance now comes in at 6372 followed by 6,400.
By Fawad Razaqzada, markets analyst with FOREX>com
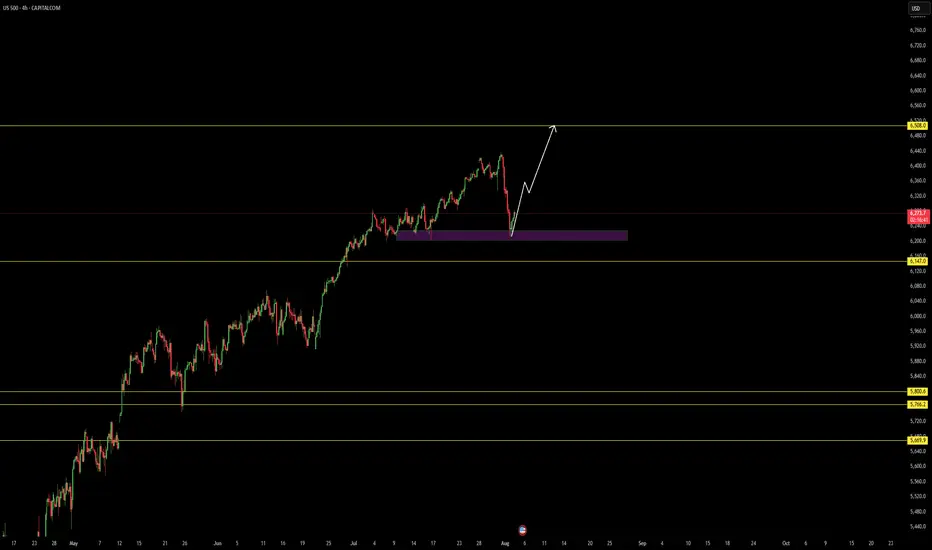
Fundamental end volumeThe S&P 500 has corrected from the margin level, as shown in the previous analysis, and is now rebounding. Large targeted volumes were injected from the 1/2 margin support for a breakout to new highs, with a growth target of 6500 and above. Recommendation: Buy
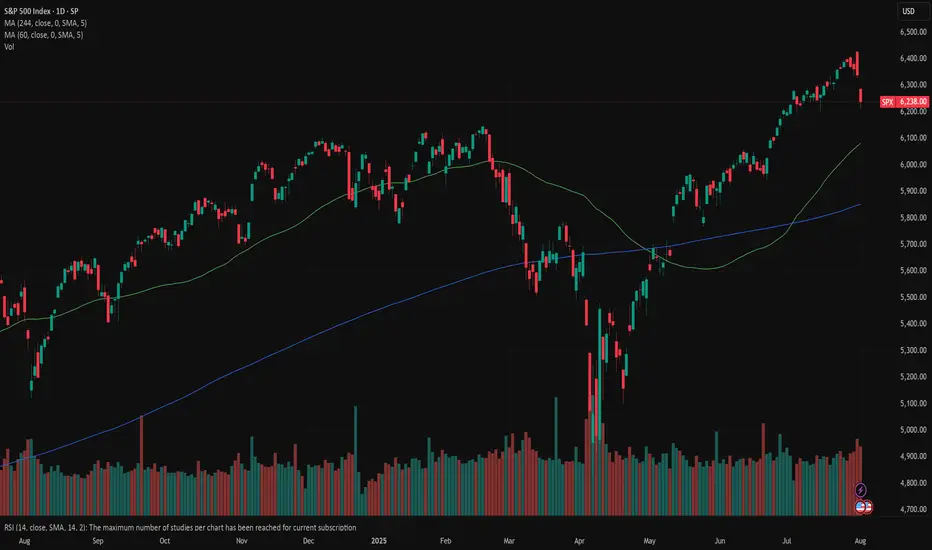
SPX: Investors` defensive positioning? The past week brought a flurry of important US macro data and a high market volatility in line with it. In addition, the FOMC meeting brought up increased nervousness regarding Fed's view on current and future macroeconomic developments. As Fed Chair Powell informed the public, the inflation is perceived to pick-up a bit as a reflection of imposed trade tariffs, but the Fed is not expecting that it will have a significant effect on increasing inflation, but only the one-off effect. Future Fed moves will continue to be data dependent and risk-assessed, in which sense, a direct answer to potential September rate cut was not provided by Fed Chair Powell.
Although Friday brought up some major market corrections in the S&P 500, Thursday's trading session was the one to bring major sentiment and indication over forthcoming correction. Namely, Thursday started in a positive manner, where the index reached a new all time highest level at 6.427, but soon after the market tumbled down, ending the trading day at 6.333. Futures were traded lower on Friday, where the S&P 500 was opened by 1,5% lower, ending the week at 6.238. These movements during the last two trading days are quite important because such strong moves in the value of index could be imposed only by institutional investors, showing their sentiment regarding the macro environment expectations at this moment.
Much of the negative market sentiment was driven by surprisingly weak non-farm payroll data of only 73K in July, which was below market estimate of 110K. At the same time, the unemployment rate modestly picked up in July to 4,2%, from 4,1% posted previously. Some analysts are noting that this could be a summer seasonal effect, however, investors are concerned that this could be a sign of a weakening US economy, due to implemented trade tariffs. During the time of writing this article, CNBC posted a news that the U.S. President Trump ordered immediate release of a duty of a Commissioner of labor statistics, due to continued posts of inaccurate labor data and its frequent revisions, also putting doubts that the July figure of 73K is accurate.
Regardless of actual accuracy of the US jobs data, investors continue to be concerned regarding the effects of implemented trade tariffs on earnings and growth of US companies. As analysts are noting, some of them are trying to lock in gains as earnings risks emerge, but with future uncertainties, a defensive positioning of investors might be wider in the coming period.
SPX 6500 6666 7000Hello Traders,
Here is my latest Fib, Channel, Trendline, and Price Targets SPX Timeline. Lets see how this plays out.

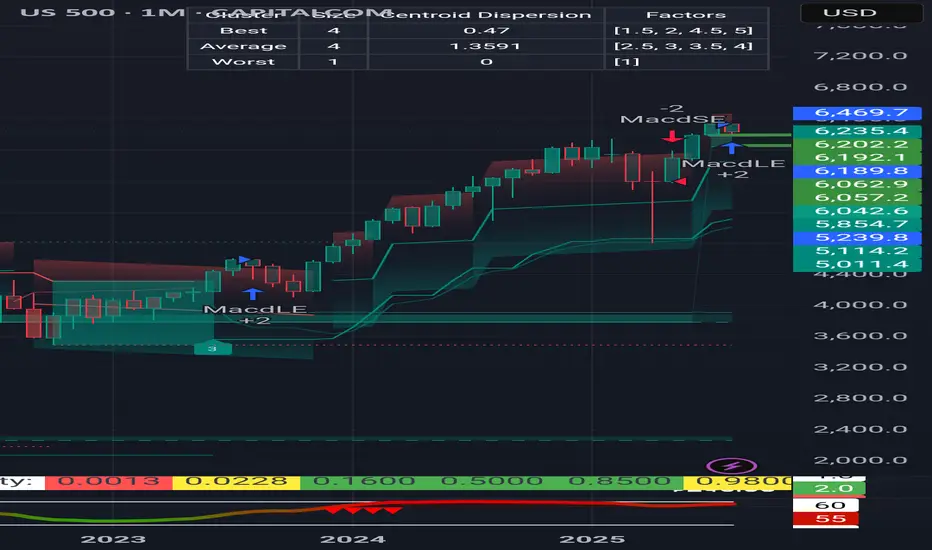
S&PS&P 500 waiting for overbought of 240 min. If it pass 6427 net resistance is about 6615. at this resistance there is a chance to drop 1 oversold of timeframe 240 min. however, it is on a long up trend, which the mid period target is 6952 (2-4 months). however, during this period it may go direcly to 6952 or down for 1 oversold of timeframe day or 240 min is OK. Note that the very importance supporting line,which should not be lower is at 4841. if it not fall below this point. S&P still on the uptrend.

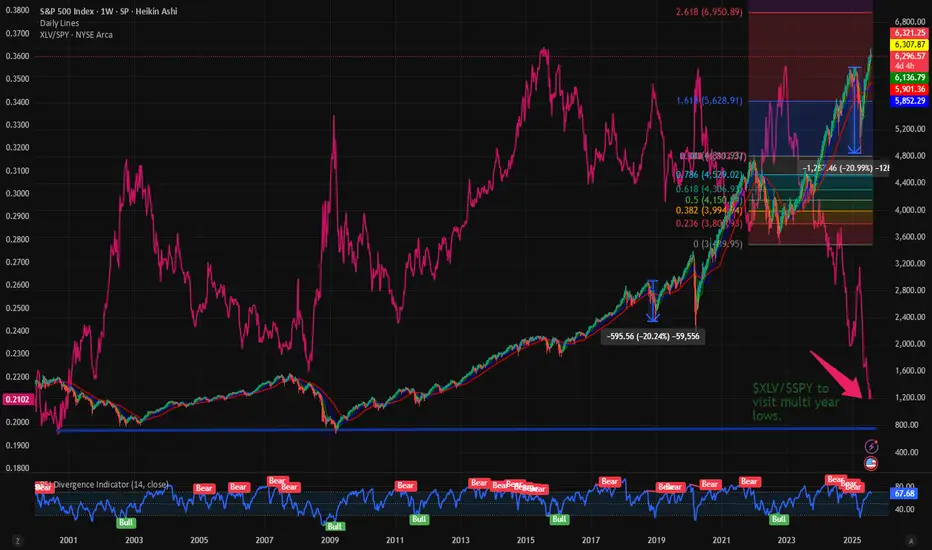
$XLV vs $SPY at multi year low. Is more downside expected? In this space we talk a lot about the market outperformance and how this has resulted in indexes at ATH. The SP:SPX and NASDAQ:NDX and their corresponding ETFs: NASDAQ:QQQ and AMEX:SPY have also made ATHs. But if peel under the surface we can observe that very few sectors have consistently outperformed the S&P 500. The Technology sector represented by AMEX:XLK has consistently outperformed the $SPY. The $XLK/ AMEX:SPY is in a upward channel depicted by the purple line. The SPDR select sector Technology sector has consistently increased its weightage on AMEX:SPY and the ratio $XLK/ AMEX:SPY is currently at 0.41 which is an ATH.
But the same cannot be told about the SPDR Healthcare Sector. The ratio between $XLV/ AMEX:SPY is making multi year low. With the ratio currently at 0.21 it is approaching its multi-year lows of 0.1975. The ratio was so low last in Sept 2000. Hence the question comes what should we expect the AMEX:XLV which is making new lows against the AMEX:SPY ? Will we visit the lows of 0.1975? If it happens then can we expect a upward momentum from his double bottom situation?
In my estimate in this bull market and Tech sector outperforming the AMEX:XLV will make new lows vs AMEX:SPY and the ratio will revisit the 2000 lows. But if on the macro front we have weak jobs numbers and recession risk rising then the AMEX:XLV can in fact draw inflows and outperform the index. Hence my estimate $XLV/ AMEX:SPY will sweep the multi-year low and then bounce back into 2026.
Verdict: Still more downside possible in $XLK/$SPY. Go long AMEX:XLV when the ratio is @ 0.1975 and into 2026.
S&P 500 Daily Chart Analysis For Week of August 1, 2025Technical Analysis and Outlook:
During the trading activity of the previous week, the S&P 500 Index displayed a predominantly bearish movement after completing our Outer Index Rally target of 6420, as highlighted in the prior week’s Daily Chart Analysis, with the primary objective now being to plug our Mean Support at 6200.
It is essential to recognize that the current price movement may trigger a significant further pullback to the Mean Support level of 6090. Following this downturn, it is expected that the index will resume its upward momentum, aiming for a retest of the Outer Index Rally peak at 6420.

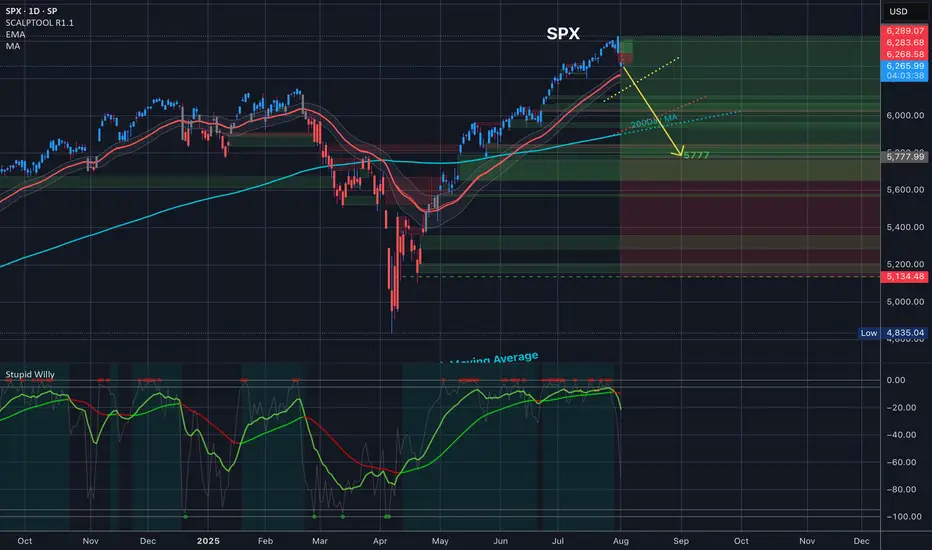
$SPY $SPX 5777 Target for end of AugustAMEX:SPY SP:SPX 5777 Target for end of August
What do you guys think here?
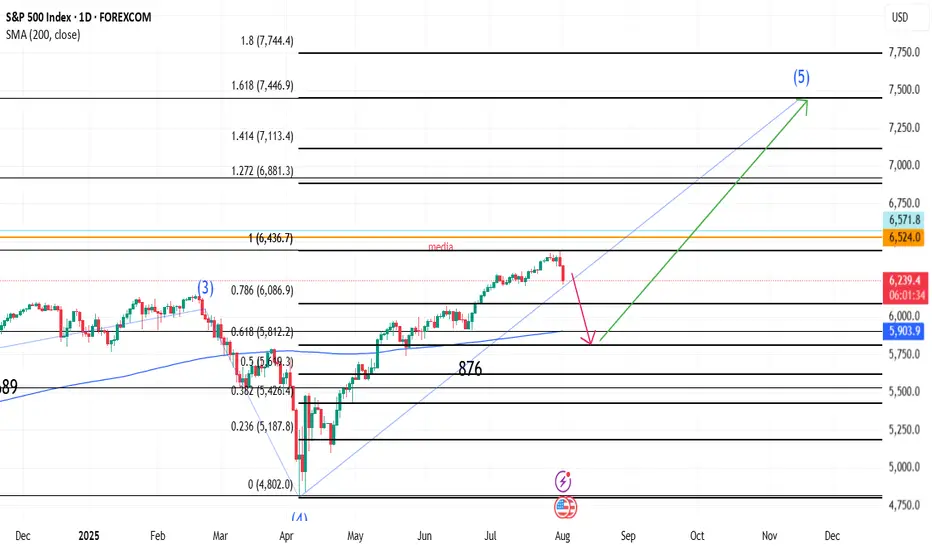
SPX correction to 5800 then 7445In my view current correction could stop in 5800 area where bullish trend could resume to target 7445 area in November
Correction will be to 6050-6190, probably the upper limit Now I notice something very important and things and the analyses of many actually coincide. Monthly support from the accumulated volume lies between 6050 and 6170. 4h indicators show a clear reversal. Separately, at these levels are the previous ATH. In my opinion, it is possible to stop even at 6180-6190. We will probably start with a gap on Monday. Now here comes the moment and over the weekend what will take place as conversations and statements in the media, but it is very likely that the minimum could happen as early as Monday night (USA time) or by Tuesday. I agree that this correction was necessary and should have happened as soon as possible because things became difficult even for bulls like me.
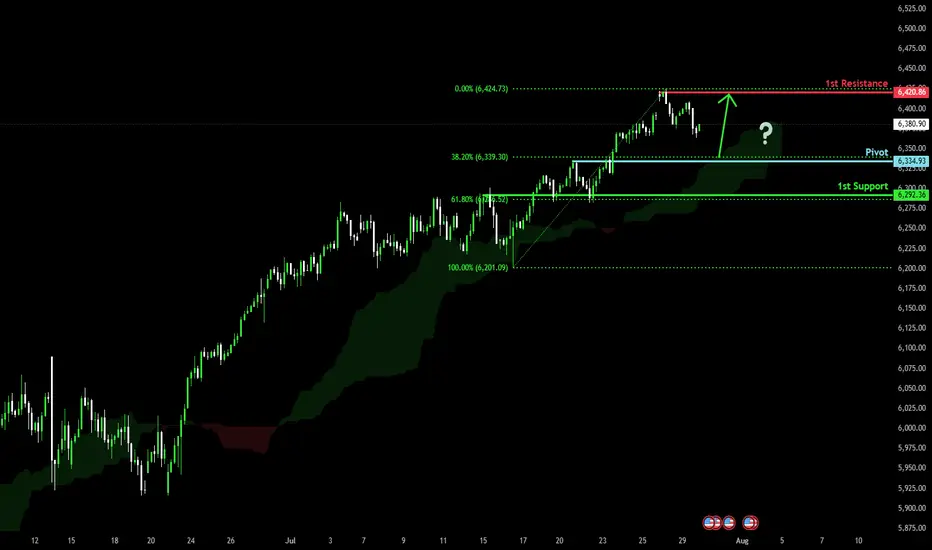
Bullish continuation?S&P500 is falling towards the pivot and could bounce to the swing high resistance.
Pivot: 6,334.93
1st Support: 6,292.36
1st Resistance: 6,420.86
Risk Warning:
Trading Forex and CFDs carries a high level of risk to your capital and you should only trade with money you can afford to lose. Trading Forex and CFDs may not be suitable for all investors, so please ensure that you fully understand the risks involved and seek independent advice if necessary.
Disclaimer:
The above opinions given constitute general market commentary, and do not constitute the opinion or advice of IC Markets or any form of personal or investment advice.
Any opinions, news, research, analyses, prices, other information, or links to third-party sites contained on this website are provided on an "as-is" basis, are intended only to be informative, is not an advice nor a recommendation, nor research, or a record of our trading prices, or an offer of, or solicitation for a transaction in any financial instrument and thus should not be treated as such. The information provided does not involve any specific investment objectives, financial situation and needs of any specific person who may receive it. Please be aware, that past performance is not a reliable indicator of future performance and/or results. Past Performance or Forward-looking scenarios based upon the reasonable beliefs of the third-party provider are not a guarantee of future performance. Actual results may differ materially from those anticipated in forward-looking or past performance statements. IC Markets makes no representation or warranty and assumes no liability as to the accuracy or completeness of the information provided, nor any loss arising from any investment based on a recommendation, forecast or any information supplied by any third-party.
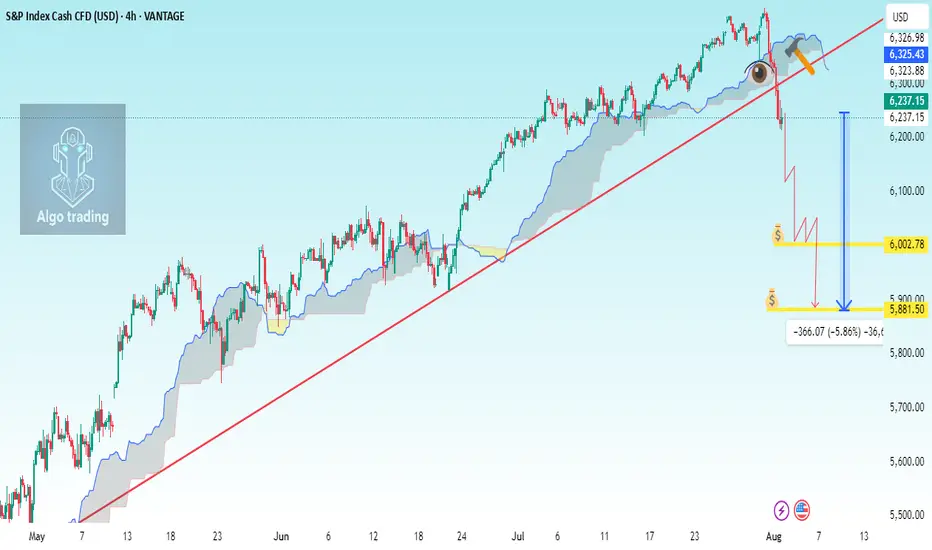
SP500 H4 analysis Breakdown TrendlineChart Components Observed:
Ichimoku Cloud: For trend and support/resistance visualization.
Uptrend line (manually drawn): Connecting higher lows since early May 2025.
Support break: Price has recently broken below the trendline and below the Ichimoku cloud.
Current Price: 6,237.15 (▼ -1.64%)
---
📉 Analysis Summary:
The trendline and Ichimoku cloud were acting as major dynamic support.
A bearish breakdown has occurred — price closed below the trendline and the cloud.
This suggests a potential trend reversal or correction underway.
---
🎯 Trade Setup Suggestion (Short Entry)
🟢 Entry Target (Short Position):
Sell Entry: Around 6,237 – 6,245 (current zone or slight pullback)
If price retests the underside of the broken trendline/cloud, that's a better entry confirmation.
📉 Take Profit Levels:
1. TP1: 6,130 (recent consolidation zone)
2. TP2: 6,000 (psychological + historical support)
3. TP3: 5,880 (next major support based on previous consolidation in early June)
🛡 Stop Loss:
SL: 6,300 – 6,310 (above the cloud and broken trendline for safe buffer)
---
📊 Risk Management:
Position size should be based on your account size, using 1–2% risk per trade.
Watch the S&P futures and macro news (e.g., U.S. data, Fed news) to avoid whipsaw.
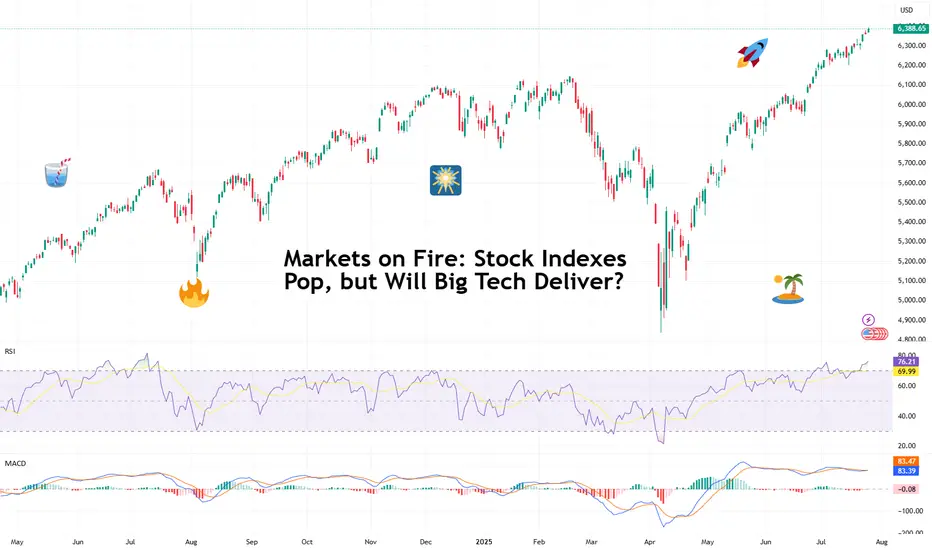
Markets on Fire: Stock Indexes Pop, but Will Big Tech Deliver?S&P 500 and Nasdaq set records. Now it's up to big tech to justify that.
Talk about forward-looking valuation. Tech companies’ valuations are largely based on future potential rather than current performance. And that’s what we’re seeing right now getting priced in across the big indexes.
You’d think we’d be bored of record highs by now. But no — Wall Street keeps hitting refresh on its all-time-high counter. 🎵 Over and over again. 🎵
On Friday, the S&P 500 SP:SPX notched its 14th record close this year, ending at 6,388.64. The Nasdaq Composite NASDAQ:IXIC followed with its 15th at 21,108.32. Even the Dow TVC:DJI — the older sibling who prefers yield over hype — climbed nearly 0.5% to 44,901.92, within a latte’s foam of its December record .
And while indexes are breaking personal bests, investors are buying ahead of some big data deliveries. Why? Because the week ahead is the Super Bowl of Earnings, and the bigger chunk of the Magnificent Seven is up next.
😎 What in the Magnificent Seven?
A highly exclusive club with just seven members, the Mag 7 has entered the earnings spotlight — and the audience isn’t going mild. Traders are pricing perfection, and the script better deliver.
Meta NASDAQ:META kicks things off Wednesday after the close with expected revenue of $44.8 billion and EPS of $5.87. Can Zuckerberg’s AI narrative get investors to forget about the metaverse?
Microsoft NASDAQ:MSFT shows up at the same time, hoping to dazzle with $73.8 billion in revenue and $3.38 EPS. Copilot AI better be doing overtime.
Then on Thursday, again after lights out, Amazon NASDAQ:AMZN joins the chat with its AWS and ecommerce empire expected to pick up $162.1 billion in revenue. Right behind is Apple NASDAQ:AAPL , fighting to stop its slide into meh-land with projected revenue of $89.2 billion and $1.43 EPS. (Fast fact: AAPL is down 12% year to date — among the worst performers in the crew.)
So far, Alphabet NASDAQ:GOOGL already crushed its quarter , posting $96.4 billion in revenue and $2.31 EPS, plus a spicy raise in capex to $85 billion.
Tesla NASDAQ:TSLA ? Not so great. The EV maker reported a 12% revenue drop and a 16% net income decline, spooking investors with a warning of “rough quarters ahead.” The stock is lower by 17% year to date.
Nvidia NASDAQ:NVDA , the AI trailblazer, reports in late August. Until then, it’s chilling on a $4 trillion throne, as per our Top companies rankings, watching its friends sweat it out.
💸 Can the Mag 7 Keep Carrying?
Here’s a harsh dose of reality: the entire S&P 500 is riding on the backs of these seven stocks. Analysts expect them to post 14% earnings growth, while the other 493 companies limp along at 3.4%. Talk about top-heavy things.
So what happens if even one tech titan misses the mark big time and spooks with scary guidance? A market correction? A buy-the-dip opportunity?
And let’s not forget: valuations are stretched. The S&P 500 is now trading at nearly 23x forward earnings (that’s projected profits per share). And the Nasdaq? Don’t even ask. (We’ll tell you anyway — it’s close to 30x). In all that, now’s a great time to keep a close eye on the Earnings Calendar .
📊 Not All Is Big Tech: Fed and Jobs Loom
As if this week wasn’t already packed enough, macro is back on the menu. The Federal Reserve meets Tuesday and Wednesday, and Chair Jay Powell is expected to hold rates steady at 4.5%.
But don’t rule out drama. A single hawkish word and this party could quickly get some rain on. Powell, the man who moves trillions with a simple “Good afternoon,” has a track record of putting markets in their place when they get too euphoric.
And then there’s Friday’s nonfarm payrolls report. Consensus calls for just 108,000 jobs added in July — soft, but not disastrous, and fewer than June’s 147,000 . Blame summer hiring slumps, tariff uncertainty, or the market finally digesting its own hype.
Off to you : Can the Magnificent Seven keep this market magnificent? Or are we about to learn what happens when you ride too close to the sun on AI-generated wings?
S&P Correction Window is official - VOLATILITY AHEADIt's that time of year where the pre-summer push wraps and the summer lull and potential
pause gets underway.
July 31 finished on a bit of a sour note with over 67% of stocks declining today and US indexes finishing RED despite the big gaps and bullish pops on MSFT and META post earnings.f
SPX Key Levels
-watch the 21 day moving average
-watch the 50 day moving average
-more dynamic support in the 100/144/200 moving average cluster
I'll be taking bites at the 5/10/15% correction levels with options and looking for this dip
to be bought by retail and institutions.
Will August 1 US Tariff Deadline matter? After Japan and Eurozone came in and said a deal is being done, I was thinking this would be a dud. BUT, Dr. Copper says "maybe" on the global
tariff deadline with the largest single day move in history (bearish). Being the perfect time of year for a correction (the other being Feb-Apr), and the technicals looking so clean for an
orderly pullback, VIX may float higher and make things more interesting in the next 30-60 days.
Strategies matter, I'll be trading risk defined, but there are great opportunities ahead. A pullback is sure better than literally watching all-time highs every single day.
Thanks for watching!!!

SPY Pull back into another earnings week?An engulfing weekly candle is no joke. Sellers are in control.
There is a strong possibility of a pull back and with bias being short, I am looking for a strong LH on the 1/2HR TF to form at 6330 as 50% or 6370- 6375 near the weekly POC.
Confluences for Pull back scenario
- Price bounced off 38.2% fib from 5930 to ATH
- Price found support at 200 ema on 4HR
- 1 HR MACD is building up bullish signal
Have a great week all!

US500 Pulls Back from 6,400– Correction or Trend Shift?The index has rejected the 6,400 🔼 resistance zone with a strong bearish candle, pulling back toward the 6,200 🔽 support region. Price is still trading within a bullish structure, but this drop may signal early signs of exhaustion.
Support Levels: 6,200 🔽, 6,100 🔽, 6,000 🔽
Resistance Levels: 6,300 🔼, 6,400 🔼
Bias:
🔼 Bullish: If price holds above 6,200 and reclaims 6,300, the uptrend remains intact and bulls may reattempt a push toward 6,400.
🔽 Bearish: A daily close below 6,200 could open a deeper retracement toward 6,100 or even 6,000.
📛 Disclaimer: This is not financial advice. Trade at your own risk.
