S&P 500 Bearish Reversal Setup: Short Entry Below Key ResistanceEntry Point: Around 5,678.79
Stop Loss: Around 5,833.61 (above recent resistance zone)
Target Point: Around 4,831.37 (indicating a bearish target)
2. Technical Patterns:
The price hit a resistance zone (highlighted in purple) and reversed—this is often a bearish signal.
The trendline break (marked with the orange dot and blue arrow down) suggests a potential trend reversal.
The moving averages (likely 50 EMA and 200 EMA) indicate the price is still above the support zone but weakening.
3. Risk/Reward Ratio:
Risk (Stop Loss – Entry): ~154.82 points
Reward (Entry – Target): ~847.42 points
Risk/Reward Ratio: Approximately 1:5.5, which is favorable for shorting.
4. Trade Sentiment:
Bearish bias based on the breakdown from the resistance zone and confirmation from chart patterns.
If the price fails to hold above 5,682.87, a short trade may be validated with the target at 4,831.37.
SPX500 trade ideas

SPX at a Tipping Point Rising Wedge Meets 200 EMAThe SPX is currently trading within a rising wedge a bearish pattern that typically signals exhaustion of upward momentum. Price has now stalled right at the 200 EMA, a key dynamic resistance level, and today's close came just beneath it.
If this rising wedge breaks to the downside especially with a confirmed rejection from the 200 EMA we could see accelerated selling. The next key support level to watch is $5,438.43. A breakdown from here would likely test that zone quickly.
This setup follows our earlier call from March 27, where we highlighted the $4,790 area as a bottom nearly nailed to the point. From that low, SPX rallied, but now the structure is showing signs of strain.
We’re at a decision point: hold the 200 EMA and potentially break higher or confirm the wedge breakdown and begin a new leg down.

The channels are everything We are bouncing around inside the channels. Its very possible we break up from this area, in which case the target will be the bollinger band at 5770 area. If we break down overnight for some reason it will be a large move down. It's difficult to say what will happen, but the channels right now are key to the price action.

US500 + Macro Radar Update | Mongoose Capital Macro DeskThe S&P 500 remains in a structurally elevated range around 5,612 following a technical bounce from recent lows. However, the broader macro environment continues to apply pressure beneath the surface.
The Macro Conditions Score prints 5/7 (71.4%), signaling a moderately restrictive backdrop. Meanwhile, the market-implied probability of a Fed Funds Rate cut sits at 52.25%, reflecting policy indecision rather than a definitive pivot.
Recession risk is cooling: the Recession Score has declined from 4/5 to 2/5 over recent months, indicating subsiding risk but not a full reset to expansionary conditions.
Yield curve signals remain inverted, though stabilization is emerging in key spreads (3M10Y, 2s10s). Fed policy sentiment remains neutral-to-hawkish, suggesting no immediate move toward accommodative policy.
📝 Institutional View:
This remains a macro-neutral market, not decisively risk-on. While equities have rebounded, the fundamental backdrop points toward a constrained upside without further improvement in liquidity or policy stance.
The rally is technical and positioning-driven, not yet macro-validated. The reduction in recession odds is positive but still within a tight policy leash.
“The market wants to believe. The data needs to confirm.”
Key Takeaways:
Tactical opportunities remain in place, but strategic positioning should remain selective.
Recession probability is declining but not eliminated.
The macro ceiling remains intact absent further loosening in financial conditions.
Published by Mongoose Capital | Macro Research Desk
(Chart: Mongoose Recession Radar Pro v1.6)

SPX Update: broken out of rising wedge. What Im seeing for now. Looking for a gap fill into tomorrow. My puts though are red, planning to swing my SPX puts. FOMC tomorrow, de-risk SP:SPX

Bullish continuation?S&P500 is falling towards the support level which is an overlap support that line sup with the 61.8% Fibonacci retracement and could bounce from this level to our take profit.
Entry: 6,520.93
Why we like it:
There is an overlap support level that aligns with the 61.8% Fibonacci retracement.
Stop loss: 5,434.59
Why we like it:
There is a pullback support level that is slightly above the 50% Fibonacci retracement.
Take profit: 5,791.21
Why we lik eit:
There is a pullback resistance level that is slightly below the 78.6% Fibonacci projection.
Enjoying your TradingView experience? Review us!
Please be advised that the information presented on TradingView is provided to Vantage (‘Vantage Global Limited’, ‘we’) by a third-party provider (‘Everest Fortune Group’). Please be reminded that you are solely responsible for the trading decisions on your account. There is a very high degree of risk involved in trading. Any information and/or content is intended entirely for research, educational and informational purposes only and does not constitute investment or consultation advice or investment strategy. The information is not tailored to the investment needs of any specific person and therefore does not involve a consideration of any of the investment objectives, financial situation or needs of any viewer that may receive it. Kindly also note that past performance is not a reliable indicator of future results. Actual results may differ materially from those anticipated in forward-looking or past performance statements. We assume no liability as to the accuracy or completeness of any of the information and/or content provided herein and the Company cannot be held responsible for any omission, mistake nor for any loss or damage including without limitation to any loss of profit which may arise from reliance on any information supplied by Everest Fortune Group.

$SPX Rejection at Resistance – Watch 5582 for the Next Major Mov📉 After tagging the 5685–5750 resistance zone, SP:SPX is flashing major downside risk.
🔍 Key Zones:
✅ Resistance tapped: 5705–5838
🟨 FVG (Fair Value Gap): 5642–5582
❗ Daily close below 5582 → Bearish WXY structure confirmed
🟥 Hard invalidation for bulls: 4835.04
💡 I’m open to a retest of the 200DMA (currently 5746), but below 5582 I wouldn’t expect a new high.
This setup offers clear structure, risk-defined short entries, and a measured breakdown scenario if support fails.

Scalping ideasThis layout is specifically optimized for high-precision scalping on the SPX500 index. It features a clean, minimalistic design focused on speed, clarity, and efficiency. Key components include multiple timeframes (1-minute, 5-minute, and 15-minute charts) to monitor short-term price action and trend shifts. High-volume zones, VWAP, and dynamic support/resistance levels are plotted to capture key intraday reactions. Integrated order flow tools and real-time momentum indicators allow for quick decision-making during volatile moves. Perfect for active scalpers looking to catch micro-movements and capitalize on rapid price fluctuations with tight risk control.

Looking for One More High So far, our minor B wave price action has not thrown us any curveballs, which is somewhat unusual considering B waves can become very complex. As I get into the micro price action, this pattern would fit better completed with at least one more high.
Nonetheless, I will offer a warning, we are in the target box...if you are long, please use stops, and make sure your position size is risk managed.
Best to all,
Chris

11am updateWe had a rally from the channel, but right now I believe it's a correction of the first wave down. Above 5660 and it will likely mean we are headed to 5700+
I'm out for the day - good luck!

SPY/QQQ ES/NQ 6 Mayo 2025Overall Market Context:
This image shows a multi-index SpotGamma-style Liquidity Map for:
SPY/SPX (top-left)
QQQ/NQ (top-right)
SPX Futures (bottom-left)
IWM (Russell 2000, bottom-right)
Each panel displays Gamma levels, Call/Put Walls, Zero Gamma zones, and Volatility Triggers to interpret potential support/resistance zones and expected market behavior.
🔹 Top-Left (SPY / SPX500USD Liquidity Map)
Resistance Zone: Around 558–560 (multiple “Target Corto” or Short Targets noted).
Support Zone: 553.58–555.00 (green zone marked as "Possible Buying Zone").
Call Wall at 575, Put Wall at 555 — this tightens the range.
Vol Trigger: 561 — above this could imply strength.
📌 Implication: Strong overhead resistance from 558–560. Breakdown below 555 may open downside targets to 553.58. Support expected around 555. Zone 553.58 is the last strong line of defense.

Algo Macro ResultsNot bad. Shows the amount of accuracy the algo has on picking trend. Pretty accurate imho.

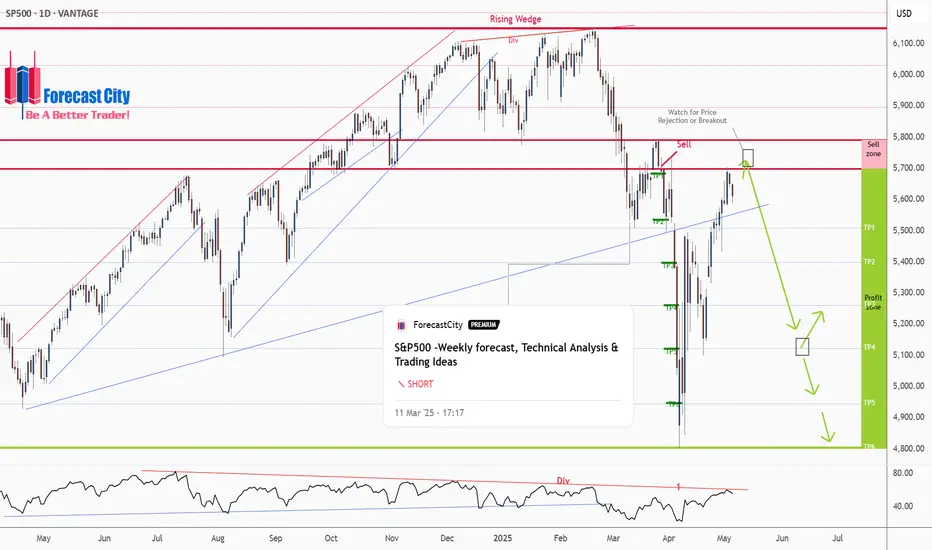
S&P500 -Weekly forecast, Technical Analysis & Trading IdeasPrevious forecast result:
As you can see in the 4CastMachine forecast on 12/03/2025, the price, after rejecting the sell zone, began its sharp decline and touched all TPs.
Midterm forecast:
While the price is below the resistance 6149.57, resumption of downtrend is expected.
We make sure when the support at 4804.01 breaks.
If the resistance at 6149.57 is broken, the short-term forecast -resumption of downtrend- will be invalid. CSEMA:S&P
Technical analysis:
While the RSI downtrend #1 is not broken, bearish wave in price would continue.
A trough is formed in daily chart at 4807.10 on 04/07/2025, so more gains to resistance(s) 5698.65, 5791.00, 5896.50 and maximum to Major Resistance (6149.57) is expected.
Price is above WEMA21, if price drops more, this line can act as dynamic support against more losses.
Relative strength index (RSI) is 55.
Take Profits:
5509.32
5363.90
5261.00
5122.47
4944.41
4804.01
__________________________________________________________________
❤️ If you find this helpful and want more FREE forecasts in TradingView,
. . . . . . . . Hit the 'BOOST' button 👍
. . . . . . . . . . . Drop some feedback in the comments below! (e.g., What did you find most useful? How can we improve?)
🙏 Your support is appreciated!
Now, it's your turn!
Be sure to leave a comment; let us know how you see this opportunity and forecast.
Have a successful week,
ForecastCity Support Team
US500: A correction will give a perfect opportunityHello,
The US500 has rebounded, maintaining its trendline as trade tension concerns subside. A promising trade setup is emerging, pending a minor correction on lower timeframes. The 2-hour and 4-hour charts indicate this correction is underway.
Long term target: $6,953
Consider entering a buy position near the moving averages, aligned with MACD signals.
Disclosure: I am part of Trade Nation's Influencer program and receive a monthly fee for using their TradingView charts in my analysis.

S&P500 buy setup
1>Monthly ERL>IRL (hunted) so now the target is ERL
2>clear MMBM
3>all bullish OBs are being respected
4>DOL seems quite achievable
(i ll be looking for 1h cisd and building positions on each BOS)
Disclaimer:
this is my personal approach to the market not an investment idea/advice, do your own analysis before jumping on the trade.

S&P500 Stuck between the 1D MA50 and 1D MA200.The S&P500 index (SPX) is now on a short-term correction following the impressive recovery of the last 30 days that made it almost test its 1D MA200 (orange trend-line). This is a technical rejection but the fact that the 1D MA50 (blue trend-line) is now the Support can be encouraging.
The reason is that since January 2023, every time the index broke above its 1D MA50 it turned into a Support that held and produced an immediate bullish extension on every occasion except for one time (Sep 2024), which still recovered 1 week after.
As a result, it is more likely for SPX to test its All Time High (ATH) by July than entering a long-term correction again.
-------------------------------------------------------------------------------
** Please LIKE 👍, FOLLOW ✅, SHARE 🙌 and COMMENT ✍ if you enjoy this idea! Also share your ideas and charts in the comments section below! This is best way to keep it relevant, support us, keep the content here free and allow the idea to reach as many people as possible. **
-------------------------------------------------------------------------------
Disclosure: I am part of Trade Nation's Influencer program and receive a monthly fee for using their TradingView charts in my analysis.
💸💸💸💸💸💸
👇 👇 👇 👇 👇 👇

Pre Market Video - the 2 channelsWe are close to the bottom of the uptrend channel. If they can't hold 5580 we will likely start a move down to 5400, the bottom of the blue channel. I expect a fight and attemt to hold 5600 today after open, but personally I think it will fail. There is a possibility of one more move up to the Bollinger Band (at least), so keep that in mind.

May 6, 2025 - Markets Hold Their Breath Before Powell SpeaksHello everyone, it’s May 6, 2025 and markets are once again at the mercy of politics, Powell, and presidential mood swings.
After a 9-day rally, U.S. markets finally took a breather yesterday, with mild profit-taking ahead of the much-anticipated Federal Reserve decision. Investors are caught between two competing visions: Trump’s push for massive rate cuts, insisting inflation is a myth cooked up by bureaucrats, and Powell’s more sober stance acknowledging inflation isn’t dead, the economy is softening, and premature easing could trigger full-blown stagflation.
With Friday’s job report stronger than expected, Powell is expected to hold rates steady, staying cautious while tariffs and growth clouds loom. Markets are pricing in a July cut at best, but uncertainty lingers mostly around what Trump might tweet in reaction to Powell’s speech tomorrow night.
Meanwhile, despite the 90-day tariff moratorium, the trade war narrative hasn’t vanished. NYSE:F suspended its 2025 outlook, citing $1.5 billion in expected tariff costs and four major risks: disrupted supply chains, retaliatory measures, unclear tax policies, and emission rules. NASDAQ:MAT is also hedging its bets shifting production out of China and pausing forecasts, while begging for zero tariffs on toys “for the kids.” Their stocks dropped modestly after hours.
OANDA:XAUUSD surged again to $3,368, as fear and safe-haven demand ticked up. BLACKBULL:WTI rebounded to over $58 following an OPEC statement, helping airline stocks breathe a bit. BINANCE:BTCUSDT continued its meteoric rise, now sitting around $94,400.
On the macro front, inflation data like CPI and PPI are being shrugged off everyone’s waiting to see if Powell plays ball with Trump. There’s hope, too, that all this chaos is just Trump’s way of muscling the world into negotiation especially China and if a “deal” emerges, markets could rip higher. Until then, we’re stuck dancing between uncertainty and hope.
Asia opened strong this morning, led by China’s cautious optimism. Futures point slightly lower in the U.S., and volatility remains king. The Fed could flip the script tomorrow or keep us hanging. Stay buckled in.

S&P500 INTRADAY resistance at 5510US stock futures are signaling a second straight day of losses. Palantir shares dropped 9% pre-market after its earnings disappointed high expectations. Ford also fell, withdrawing its financial guidance and warning that new tariffs would hurt profitability.
In Europe, political uncertainty hit German markets as Friedrich Merz failed to secure a majority vote to become Germany’s next chancellor, delaying his swearing-in and shaking investor confidence. The DAX index slid 1.4% on the news.
Meanwhile, EU-US trade tensions are intensifying. The European Union expects new US trade probes could expose up to €549 billion ($622 billion) worth of EU exports to American tariffs, adding pressure to already strained transatlantic negotiations.
Key Support and Resistance Levels
Resistance Level 1: 5693
Resistance Level 2: 5780
Resistance Level 3: 5876
Support Level 1: 5512
Support Level 2: 5438
Support Level 3: 5390
This communication is for informational purposes only and should not be viewed as any form of recommendation as to a particular course of action or as investment advice. It is not intended as an offer or solicitation for the purchase or sale of any financial instrument or as an official confirmation of any transaction. Opinions, estimates and assumptions expressed herein are made as of the date of this communication and are subject to change without notice. This communication has been prepared based upon information, including market prices, data and other information, believed to be reliable; however, Trade Nation does not warrant its completeness or accuracy. All market prices and market data contained in or attached to this communication are indicative and subject to change without notice.

SPX 500SPX500 Index
- Completed " 1234 " Impulsive Waves
- Break of Structure
- Fibonacci Level - 161.8%
- Bullish Channel in Short and Long Time Frame
- CHOCH
SPX is cooking a strong buyBuyers are strongly in control and now the price is giving a nice discount. Good for sweet risk to reward. Invest wisely...

S&P500 Short Update: Break of TrendlineThis is an update to my short idea 2 days ago. I believed that the reversal for S&P500 has already begun and that I expect a move down from the breaking of the lower trendline.
Apologies for the audio as I am testing out a new setup (with a new portable microphone).

"US500/SPX500" Index Market Money Heist Plan (Day / Swing Trade)🌟Hi! Hola! Ola! Bonjour! Hallo! Marhaba!🌟
Dear Money Makers & Robbers, 🤑💰✈️
Based on 🔥Thief Trading style technical and fundamental analysis🔥, here is our master plan to heist the "US500/SPX500" Index Market. Please adhere to the strategy I've outlined in the chart, which emphasizes short entry. Our aim is the high-risk Pink MA Zone. Risky level, oversold market, consolidation, trend reversal, trap at the level where traders and bullish robbers are stronger. 🏆💸"Take profit and treat yourself, traders. You deserve it!💪🏆🎉
Entry 📈 : "The vault is wide open! Swipe the Bearish loot at any price - the heist is on!
however I advise to Place sell limit orders within a 15 or 30 minute timeframe most nearest or swing, low or high level for Pullback Entries.
Stop Loss 🛑:
📌Thief SL placed at the nearest/swing High or Low level Using the 1D timeframe (5500) Day/Swing trade basis.
📌SL is based on your risk of the trade, lot size and how many multiple orders you have to take.
Target 🎯: 4750 (or) Escape Before the Target
💰💵💸"US500/SPX500" Index Market Heist Plan (Swing/Day Trade) is currently experiencing a Bearish trend.., driven by several key factors.👇👇👇
📰🗞️Get & Read the Fundamental, Macro, COT Report, Geopolitical and News Analysis, Sentimental Outlook, Intermarket Analysis, Index-Specific Analysis, Future trend targets with Overall outlook score... go ahead to check 👉👉👉🔗🔗
⚠️Trading Alert : News Releases and Position Management 📰 🗞️ 🚫🚏
As a reminder, news releases can have a significant impact on market prices and volatility. To minimize potential losses and protect your running positions,
we recommend the following:
Avoid taking new trades during news releases
Use trailing stop-loss orders to protect your running positions and lock in profits
💖Supporting our robbery plan 💥Hit the Boost Button💥 will enable us to effortlessly make and steal money 💰💵. Boost the strength of our robbery team. Every day in this market make money with ease by using the Thief Trading Style.🏆💪🤝❤️🎉🚀
I'll see you soon with another heist plan, so stay tuned 🤑🐱👤🤗🤩
