SHORT ON SPYNice Double Top at a Major supply zone on spy.
I will be selling spy to the next demand zone for almost 900 points. (INSANE)
SPX500 trade ideas

SPX 1st rejection1st rejection of last week's close. I say mark the zone and be cautious. Key levels will be targets (daily hi & lo minimum). If your hit targets, take profit. when aiming above, take the trade from a support level or specific candle shift.
Again... FOMC Wed 5/7. Will update my thoughts daily this week.

S&P 500 2025 and 1998Interesting and striking similarities. I think this week either confirms this or invalidates the idea.

Little Rest For SPXI think the SPX structure is more prone to bearishness. There is a structure that will probably move quickly in one direction. I don't think a good structure has been formed for a bottom. And the rise does not seem very strong. For this reason, I expect an increase after the first fall.
Since this situation will probably reflect on crypto, my bearish contracts are still in place. But I am thinking of buying a bullish contract until the FOMC time.

$SPX / $SP500 – China Deal or Global Meltdown? The Risk/Reward 📉 The S&P 500 ( SP:SPX / VANTAGE:SP500 / $ES_F) is at a geopolitical crossroads.
After the Global Pause, the index rebounded, but only to retest resistance near the 200-day EMA. Now it faces a binary outcome:
Scenario A: ✅ Deal with China
Estimated probability: 20%
Potential upside: +10%
Expected value: +2%
Scenario B: ❌ No Deal with China
Estimated probability: 80%
Potential downside: -50%
Expected value: -40%
📉 Expected move: -38% net Markets are not priced for this. Volatility ( TVC:VIX ) is quietly coiling under the surface (chart 2), ready to explode if the no-deal scenario materializes.

SPX Running Into Important Resistance At 5780Last week we saw a weaker-than-expected Advance GDP in the first release, which led some to believe Powell might consider cutting rates. But Friday’s NFP came in better than expected. Expectations are no change for the Fed, and I honestly don’t believe they’ll move either.
Despite Trump putting pressure on them, inflation is still not at their 2% target, and the job market remains solid—so there may be no real reason to cut yet.
They’re watching markets too, and we've seen a pretty strong rebound, so there’s likely no urgency to act now.
Also, if they were to cut, it could appear politically motivated due to Trump, and that could seriously damage investor trust in the Fed’s independence.
So with that being said, we are wondering if the SPX can find some resistance if FED does not deliver a dovish view at this moment. Well, looking at the price action, it certainly looks overlaping recovery from April low, that can face limited upside near 5780, at April 2nd high.
If by Friday, we close above the 78.6% Fib then we may look at wave 3, alt sceario.
Grega

ETHEREUM LONGPECTRA UPGRADE may 07
Please be informed that the PECTRA system will undergo a scheduled upgrade on Tuesday, May 7.

Important structure reached FridayThe trendline structure from the top was reached FRiday and I believe we may rally back to it at open but fail. There are a LOT of traders calling for a test of the 200 ma again, but I'm not sure it will actually occur. Vix also did not fill it's gap on Friday which could be interpreted as bullish for the VIX

S&P 500 Tests Key Zone Ahead of FOMCThe S&P 500 has reached the 5,700–5,800 zone after a nearly 18% rally in just half a month. This zone could determine whether the rally marks the end of the bearish trend or if more pain lies ahead for the stock market.
The 200-day simple moving average, several previous horizontal support levels, and the most recent top all converge in this area. The upward move has been driven by correction dynamics, optimism around potential trade deals, signs of de-escalation with China, and rising expectations for Fed rate cuts in 2025.
This week, the FOMC may either temper those optimistic rate cut expectations or hint at a more dovish tone. In either case, some profit-taking may occur ahead of the meeting, and the 5,700–5,800 zone is a strong candidate for that to happen.

US Stocks Pare Back All Tariff-Fueled Losses. Are We So Back?Remember “Liberation Day”? The one that felt more like Liquidation Day ? When markets tanked, tickers turned red, and you were afraid to check the markets on the next day? Well, turns out the rumors of the market’s demise were — once again — greatly exaggerated.
If the average recession 10 years ago lasted two years, this year’s recession was approximately 37 minutes (more or less, depending on the day).
Just a month ago, the S&P 500 SP:SPX started crumbling to the point it entered into correction territory (and then got out of correction territory ).
Long story short, it took the punches, went down 15%, stood back up, and is now throwing jabs with a nine-day winning streak — its longest since 2004, when iPods were still a thing and Facebook was just for Harvard students.
So… are we back? Like, really back? Let’s dig in.
💰 Trillions Lost, Trillions Found
On April 2, President Donald Trump dropped the hammer — or rather, the online post — unveiling his “reciprocal tariffs,” which, in true Trumpian fashion, sounded equal parts policy and promo PR.
Markets didn’t take it well. Global stocks collectively threw a tantrum. The S&P 500 dropped like it had a brick in its pocket . Financials cratered, energy took a gut punch, and tech? See for yourself — we don't want to talk about it .
But now? The dip buyers are shopping up, scooping up, snapping up everything from banks to oil stocks to beleaguered megacaps. Suddenly, all those stock discounts look like missed opportunities, and the cash-on-the-sidelines traders are jumping in.
👌 Jobs Data: Not Too Hot, Not Too Cold
Friday was a good day. Why? Because April’s nonfarm payrolls ECONOMICS:USNFP report came in at 177,000 jobs — not too strong to trigger Fed-tightening fears, not too weak to imply economic decay. It was the goldilocks print.
The number was a drop from March’s revised 185,000, but what mattered was the beat: economists had pencilled in just 135,000. Markets took that as permission to throw a party.
The S&P 500 jumped 1.5%, reclaiming the level it had before Trump’s tariff tirade and putting an emphatic end to the selloff. Nine green days in a row? That’s a bull flex Wall Street hasn’t seen in two decades.
💥 Truth Social Posts That Move Markets
Not to be left out of the celebration, Trump hopped onto Truth Social with his usual caps lock enthusiasm:
“THE FED SHOULD LOWER ITS RATE!!!”
Sounds familiar?
Still, even without a rate cut (for now), the market got what it wanted: signs that the US labor market isn’t collapsing, trade talks might be back on the table, and the economy hasn’t lost its way.
😌 A Global Sigh of Relief
While the US led the rally, global markets also joined the rebound chorus. China’s commerce ministry chimed in Friday, saying Washington had expressed a “desire to engage in discussions.” In market-speak, that translates to: "Everyone calm down — we might not blow this up after all."
It doesn’t take much to change sentiment. A tweet here, a headline there, a hint of diplomatic progress — suddenly risk appetite returns and everyone forgets they were panic-selling just three weeks ago.
But don’t go lining up the espresso martinis just yet — not everything is fully recovered. The US dollar, for example, remains nearly 4% below its pre-tariff-announcement level.
🤔 We Are So… Back?
So are we officially back? Short answer — “put the word out there that we back up” for now . Markets are up, volatility is down, and everyone’s pretending they didn’t sell the dip at the worst possible time.
But — and you knew there’d be a “but” — caution still applies. Trade tensions aren’t over. The next Trump post could shake things again. The Fed hasn’t made its next move (that’s coming this Wednesday). And geopolitics remains a powder keg.
Still, what this rebound tells us is clear: the market has resilience. Maybe not logic. Maybe not grace. But resilience? Yes.
It also reminds us that trying to time news-driven selloffs is a dangerous game. Often, the best trades happen when fear peaks and everyone else is running for the hills.
👉 Final Thoughts: Watch the Calendar, Not the Chaos
The key takeaway from this tariff-to-rally rollercoaster? Markets can move fast — but they can also recover faster. If you panicked, you probably sold low. If you stayed focused, checked the earnings calendar , and remembered that market narratives shift like wind direction, you're probably doing well right now.
We’re so back — for now. But stay sharp. This market may have nine lives, but it also has the attention span of a toddler.
Your move : Did you ride the dip? Buy the bounce? Or just mute the chaos and sip your coffee? Drop your best “Liberation Day to Redemption Rally” trade below.

SPX: trade should not be a weaponPositive sentiment continued on the US equity markets during the previous week, after stronger than expected US jobs data. The Non-farm payrolls posted on Friday reached 177K in April, which was significantly above the 130K expected by the market. The market estimate was significantly lower from March data, as analysts were expecting to see a spill over effect of the imposed trade tariffs. As the jobs market seems still quite strong, the positive market sentiment was intact during the week. However, the recession fears are still holding among investors. The S&P 500 continued its 9-days winning streak, ending the week at the level of 5.686.
On a positive side was the news that Chinese authorities are considering starting negotiations with the US Administration regarding trade tariffs. This was another positive boost for investors' sentiment. Berkshire Hathaway was holding shareholders annual meeting on Saturday, where the most attention of both media and investors was on the speech of its founder and famous investor, Warren Buffet. In his address to the shareholders, Buffet strongly criticized the trade tariffs, noting “Trade tariffs are an act of war … trade should not be a weapon’.
For the moment, it could be expected that the positive sentiment might continue also in the future period. However, the FOMC meeting and Fed rate decision is scheduled for Wednesday, May 7th. This could be a day of higher volatility, as Fed Chair Powell will address the public at the press conference after the meeting. The markets will closely watch what he has to say regarding the current state of the US economy and potential rate cuts during the course of this year.

SPX: Short term bearish to touch gap? And fill? Looking like there is apparently “no tariff talks” per China.
We’re still in such an uptrend, but looking for a short-term pull back on negative news. Also we have FOMC this week. Does Powell give what Trump and the people want, a rate cut?
I’m looking for 5678.33 to
- TP1: 5672.46
- TP2: 5635.06
Possible touch or fill gap of below 5603.21?
Let me know what you think. Do your DD, not FA. Let’s see what the week brings.

SPX Bullish Breakout and Wave 5 TargetSPX has successfully broken out of the rounding bottom pattern, confirming a strong bullish reversal. After completing waves 1 to 4 within the upward channel, the index is now poised to advance into Wave 5.
The current momentum supports a rally toward the immediate setup target near 6,690, with an ideal continuation into Wave 5. A decisive breach of this resistance could accelerate the move toward the mid-term target around 7,278, activating a new bullish impulse.
The chart highlights key support in the buy zone and emphasizes the importance of a confirmed breakout, offering a high-probability setup aligned with the Wave progression and ongoing trend strength.

Week ahead analysis May 4th to 11th**Week Ahead Analysis (May 5 – May 11, 2025)**
### **Baseline: Market Expectations**
- **Tariffs & Fed Policy:** Trump's tariff announcement has heightened concerns about economic slowing, prompting bond markets to price in up to four Federal Reserve rate cuts this year.
- **Trade Talks & Sentiment Shift:** Reports suggest China may restart trade negotiations, boosting risk sentiment. However, China insists the U.S. must first remove all unilateral tariffs, adding uncertainty to the discussions.
- **Market Reaction:** Risk assets—equities and high-beta currencies like AUD, NZD, and CAD—are climbing as volatility cools. Meanwhile, safe havens such as JPY, CHF, and gold are facing selling pressure, though overall risk sentiment remains cautious.
### **Potential Surprise Scenarios**
- **Trade Deal Secured:** A deal would likely send equities higher, strengthen risk-sensitive currencies, and drive safe havens lower.
- **No Deal Reached:** In contrast, safe havens could gain while risk assets retreat.
### **Big Picture Outlook**
Regardless of the immediate outcome, the market's medium-term trajectory hinges on the broader effects of trade policy. If tariffs persist, economic uncertainty may sustain the Fed’s dovish stance. A successful trade deal, however, could restore confidence, shifting expectations back toward growth stabili

S&P500 pending short: wave 5 of 5 of C or ZThis is how I will count the S&P500 Elliott waves.
Entry will be at 5757.5. You can wait to a reversal signal instead also. Stop above the high if that's what you choose. Else, give some space. I'll set the stop nearer to 5800.

SP500 - technical analysis I expect it to increase from this moment if the 4h demand zone is valid, if not I expect it to reach the D demand zone and from there to have a reaction
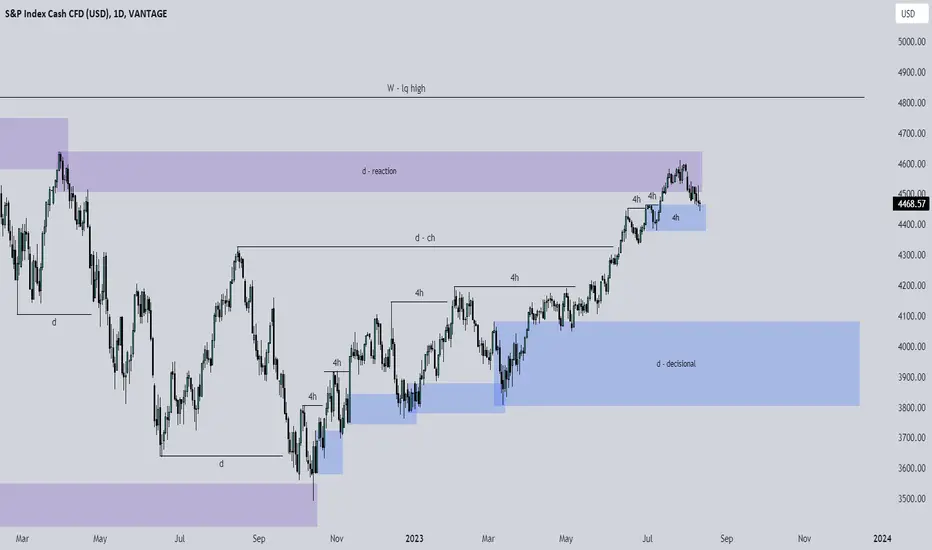
Chart Called It S&P 500 Bottom on April 7 Confirmed the March 27On March 27, 2025, I published an analysis identifying the potential for a major bottom forming in the S&P 500 near 4,790.57:
Original chart and analysis
At that time, the index was consolidating just above key support, with growing downside pressure ahead of major economic reports. Despite broad caution in the market, the technical setup signaled a potential reversal.
The first rising channel developed in March, helping to support the rebound but it later broke to the downside, leading to another test of support. That move did not invalidate the broader structure.
On April 7, the S&P 500 made its cycle low at 4,835.04, just shy of the target. Since then, a second rising channel has formed, with higher lows and momentum supported by volume.
The price is now approaching major resistance at 5,822.
If it gets rejected, a pullback toward the rising trendline or the 5,438 area is likely. As long as price holds above the April 7 low and respects trendline support, the bullish structure remains intact. A confirmed breakdown below that support would increase the risk of a deeper retracement.
This progression underscores the importance of trusting price structure over sentiment.
The market followed the chart.
The bottom was April 7.
The call was made March 27.
The chart led the move.

Down for SPX500USDHi traders,
Last week SPX500USD did not close below the Daily FVG and broke the Weekly FVG. Now the trend has changed to bullish but price is moving very slow. This could indicate a leading diagonal (wave 1).
So next week we could see a (corrective) move down from the Daily FVG above.
Let's see what the market does and react.
Trade idea: Wait for price come into the Daily FVG above and a change in orderflow to bearish, a small impulse wave down and a small correction up on a lower timeframe to trade (short term) shorts.
If you want to learn more about trading FVG's & liquidity sweeps with Wave analysis, then please make sure to follow me.
This shared post is only my point of view on what could be the next move in this pair based on my technical analysis.
Don't be emotional, just trade your plan!
Eduwave

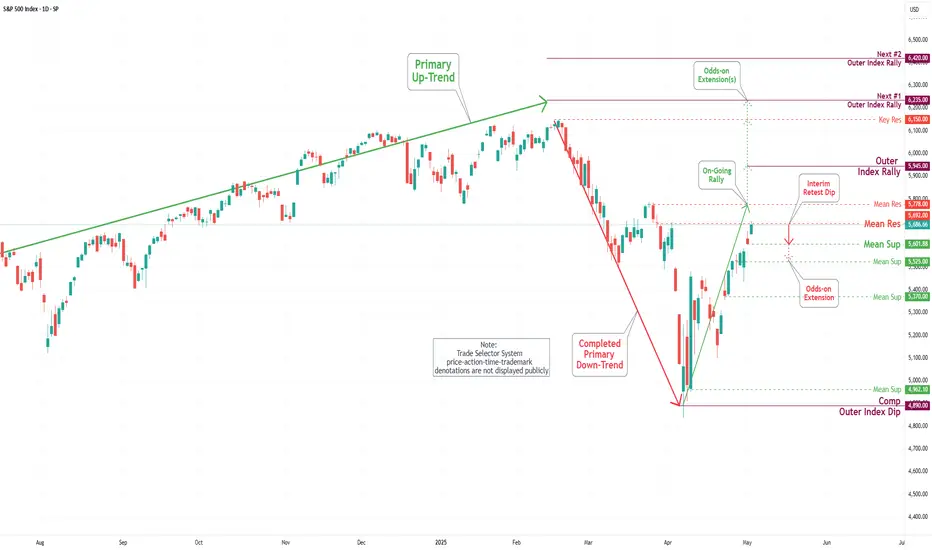
S&P 500 Daily Chart Analysis For Week of May 2, 2025Technical Analysis and Outlook:
During this week's trading session, the Index demonstrated a steady to higher price movement, achieving a key target at the Outer Index Rally level of 5550 and successfully surpassing the Mean Resistance level of 5672. This trajectory establishes the foundation for sustained upward momentum as it approaches the Mean Resistance level of 5778 and sets sights on reaching the next Outer Index Rally target marked at 5945. However, it is essential to acknowledge the substantial risk of a sharp retracement from the current price level to the Mean Support level of 5601, with the potential for further decline to the Mean Support level of 5525.
Weekend Trading Note - 3 May 2025A couple of interesting dynamics in the market over the latter half of the week:
- Minimal reaction to economic data suggests that traders are weighing the pull between deflation and tariffs, which are undoubtedly putting the fed in a bind. Can they raise rates at a time of uncertainty when it comes to tariff-induced inflation. Recent data suggests deflation and a strong economy. Nothing is clear.
- The temporary uncoupling of BTC and the Nasdaq100 is interesting, but such narrative-led decoupling has happened on a short-term basis before. Perhaps this time the anti-dollar trade will continue a while longer, until calm is restored.
- Businesses seem to be reacting to the Trump uncertainty by slowing down their trading activity and hesitating to invest or grow until more clarity is available. The loss of confidence and reassurance of clear direction may be damaging in the longer-term, elevating the potential for a technical recession as business enter more defensive posturing.
- Theres still some potential for good news around a deal between the US and China leading to a return to a risk-on regime in the near-term. The question on whether this will be enough to propel US equities to new all time highs will depend on the pre-existing structural issues with the macroeconomy
Enough macro. Here’s what I’m looking at in markets:
- SPX has retraced back up to the 0.618 fib of the recent downside move. This coincides with the POC on the anchored volume profile (anchored from the ATH). If the SPX is going to retest the lows, I’d expect it this begin in the next 5-10 days. A complete breakdown below its current lows is unlikely at this stage, but a wick slightly below current lows marking the bottom is definitely on the cards.
- BTC’s relative strength is encouraging. A retest of the $88700 level would offer a good entry for a trade back up to the current high at around $109K and perhaps more.

SP500 Ready to RetraceS&P doesn't look good for next week. Probably a gap up to get rid off shorts then drop.

S&P 500 records 9 days of gains, longest streak in 20 years🚨S&P 500 records 9th consecutive day of gains, the longest winning streak in over 20 years..
🚨
MartyBoots here , I have been trading for 17 years and sharing my thoughts on ETH here.
SP:SPX
Watch video for more details

5700 reachedWe are floating up on little volume. I believe qqq is a better chart for fibs and structure - so I show what I see there. VIX likely fills it's gap at 21.80 by the end of today. The close will probably stay bullish, but I think next week will be the start of a move down.
