A Tolled BellThe first bell has rung. A bridge is being paved across the $6000 range.
IF it blows up, it likely won't happen until the bridge is constructed and sentiment improves. Expect a few heartfelt endeavors to shoot above $6,660. Base case is long term crab market.
SPX500 trade ideas

Low Risk SPX opportunitiesLetting the Market decide if it would care to continue Bullish or hold below trendline and daily zone to create New Low.

How Gann’s Square of 9 Reveals Hidden Time Cycles in the US500In today’s fast-moving markets, most traders are stuck reacting, chasing signals, hunting for breakouts, and trying to make sense of noise. But what if you could predict where the market might turn, not just based on price, but on time itself?
That’s exactly what W.D. Gann mastered. His tools, like the Square of 9, weren’t just about charts, they were about timing the rhythm of the market. Today, I’ll walk you through a real-world example on the US500, using Gann’s time technique on the 5-minute chart. This isn't theory. This is how you can bring Gann’s legacy to life in real-time trading.
Step 1: Don’t Start on the 5-Minute—Zoom Out First
The first thing to understand is that not every swing high or low is meaningful. To apply Gann’s time analysis correctly, you must choose swing points that matter—and that means looking at the higher timeframes.
Before diving into the 5-minute chart, I always analyze the 15-minute, 1-hour, and 4-hour charts. If a swing high or low on the 5-minute lines up with a key support or resistance zone from those larger timeframes, that’s your signal. These are levels where institutions and big players act, and that gives your analysis a real edge.
So, once I identified a swing high and low on the 5-minute chart that aligned perfectly with a 1-hour resistance zone and a 4-hour support level, I knew I had something solid.
Step 2: Counting Bars – The Foundation of Time Analysis
From the chosen swing low to the swing high, the market took 9 bars to complete the move. That number isn’t just a count—it becomes our anchor in time.
Using my custom-built Gann Square of 9 spreadsheet, I plugged in this value. The spreadsheet then calculated future bar counts where the 45-degree time angle repeats, based on Gann’s time rotation principle.
The output gave us these key numbers: 16, 25, 36, 49, 64, 81
These are not arbitrary. They are time-based vibration points derived from Gann’s spiral math—each one representing a future window where the market is likely to shift.
Step 3: Letting Time Lead the Trade
Let’s walk through what happened at each of these time windows:
Bar 16: The market attempted to push higher—a classic manipulation move. Then came a sharp reversal. The 45-degree vibration was in effect. This was a textbook Gann-style turning point.
Bar 25: No sharp reversal, but momentum slowed and price started consolidating. This was a structural pause—just as important as a reversal for those watching intraday shifts.
Bar 36: This one was dramatic. The market had been falling, but as we approached the 36th bar, rejection candles started appearing. Selling pressure dried up, and buyers stepped in. Soon after, a bullish breakout followed. The time vibration had called it again.
Bar 49: After a strong bullish run, the price stalled and reversed almost precisely at this time point. This marked a shift back to bearish sentiment.
Bar 64: The downtrend lost steam. Price began forming a new swing low, and as we passed the 64-bar mark, bullish momentum returned. Another clean reversal.
Bar 81: The final vibration in this sequence. The bullish move slowed, candles shrunk, and volume faded. Then came a breakdown. A bearish turn right on time.
What This Means for You as a Trader
This sequence—from bar 16 to 81—is a masterclass in how time drives the market. It shows that price action is not random. It's governed by hidden cycles that most traders overlook. But when you apply Gann’s methods with precision, the market reveals its rhythm.
All we did was:
Identify a meaningful swing (validated by higher timeframes)
Count the bars between the swing low and high
Let the Square of 9 calculate the future time vibrations
From there, we simply watched and waited. And the market played out almost to the bar.
Conclusion: From Reactive to Predictive Trading
The real power of Gann’s techniques lies not in magic, but in mathematical and astrological precision. When you understand how time and price interact, you stop reacting—you start forecasting.
You stop chasing trades—you start anticipating reversals.
Gann’s Square of 9 isn’t just an old-school tool. With the right application, it becomes a modern forecasting machine. And with the help of tools like my custom spreadsheet, the entire process becomes simple, streamlined, and incredibly effective.
So the next time you’re about to take a trade, ask yourself:
Are you following price? Or are you following time?
Because when time is on your side, the market moves in your direction—not the other way around.

SPX path forwardThe SPX appears to be transitioning out of Wave 4 and initiating Wave 5 of the current Elliott Wave cycle. This breakout from Wave 4 suggests the final leg of the broader impulsive structure is underway, typically characterized by renewed momentum and trader interest.
At this stage, we can expect a pullback or bounce near the previous Wave 3 low, which often acts as a key support level during the early stages of Wave 5 development. Should this level hold, price action is likely to resume downward, completing Wave 5 within the projected target zone.
Downside targets for Wave 5 completion are currently in the 4,700 to 4,600 range, aligning with a typical Fibonacci extension (0.618–1.0 of Wave 1 through Wave 3) and previous structure zones that may offer confluence.


Yeah I know, everybody wants to be a "contrarian" bull..Yeah I know, everybody wants to be a "contrarian" stock market bull.
But I would get really scared once the current rally ends.
It can get really skiddish after that.

US500 BULLISH SYMMETRICAL TRIANGLEhi
Fundamental view
The **US500 index** dropped due to several key factors affecting the U.S. stock market:
📉 **Tech Stock Decline** – Technology stocks faced heavy pressure, especially after **Nvidia** plunged **6.9%** due to U.S. restrictions on AI chip exports to China. Other stocks like **AMD (-7.3%)** and **Micron Technology (-2.4%)** also fell.
💰 **Federal Reserve Uncertainty** – Remarks from **Fed Chair Jerome Powell** raised concerns in the market. Powell warned that new tariffs could trigger higher inflation and slow economic growth, making investors uncertain about interest rate policies.
🛍️ **Surge in Retail Sales** – Retail sales jumped **1.4%** in March as consumers rushed to buy before new tariffs took effect. This highlights economic uncertainty, pushing investors to sell their stocks.
Overall, a mix of trade tensions, uncertain monetary policy, and a tech stock sell-off caused the **US500 index to drop 120.93 points (-2.24%)** on **April 16, 2025**.
Technical view
Yes, the **bullish symmetrical triangle** pattern is often a strong signal for upward price movement. When the price moves within this pattern, it usually indicates a **tightening volatility** before a **breakout**, which can present a good market entry opportunity.
🔍 **Breakout Confirmation**
1️⃣ Increased trading volume when price breaks above the **upper trendline**.
2️⃣ A closing candle above the **triangle resistance** for a valid signal.
3️⃣ Price targets can be measured using the pattern’s initial height as a projection.
📈 **Potential Price Movement**
If the breakout happens, the price could surge toward the next **resistance level**. However, if the breakout fails and price moves below support, the pattern could turn **bearish**.
Warren Buffett famously said, “Be greedy when others are fearful.”
good luck
**My trading strategy is not intended to be a signal. It's a process of learning about market structure and sharpening my trading my skills also for my trade journal**
Thanks a lot for your support

ETH LONG, BEARS are Losing controlETH/SPX showing weakening pattern forming around a top formation, that is bullish for ETH
ETH is about to break a pattern that is here since January 2025.

ETHEREUM BULLS regaining control, descending Triangle Descending Triangle, inversely proportional to ETH price,
ETH LONG TRADE
07 may PECTRA Upgrade is a major milestone

$SPX Monthly MACD Cross – Reset or Breakdown?The monthly MACD for the S&P 500 ( SP:SPX ) just crossed to the downside 📉 — a signal we’ve only seen a few times in the past decade.
Looking at the chart, this indicator also triggered during:
📉 2018 (Quick pullback)
🦠 2020 (COVID crash)
🐻 2022 (Extended bear market)
Now in 2025, we’re facing another sharp decline — but the question is:
👉 Is this just another quick reset like '18 & '20... or are we about to grind lower like 2022?
The MACD histogram is already in negative territory, and the price action is following the same pattern we saw before extended drawdowns.
What do you think: is this the beginning of something deeper? Or are we prepping for a snapback rally?
Drop your thoughts below 👇

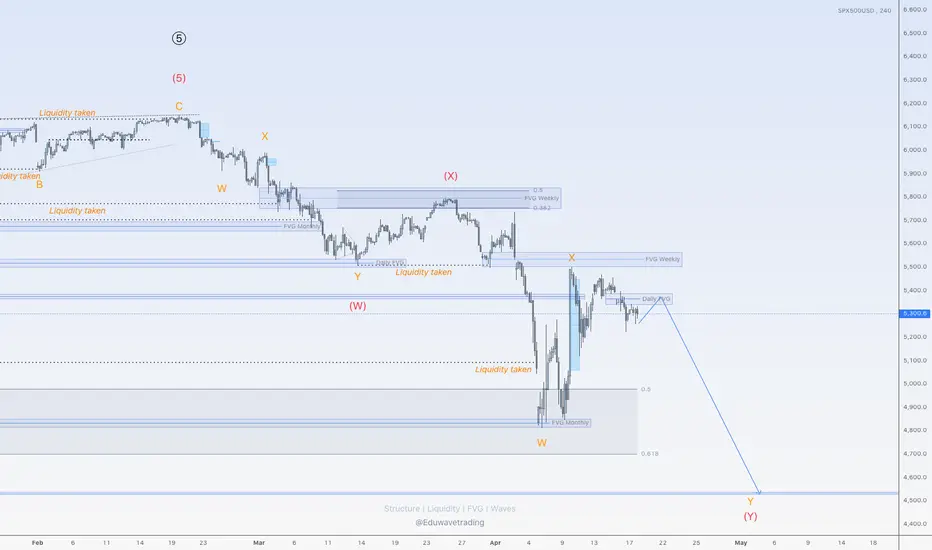
More down for SPX500USDHi traders,
SPX500USD consolidated the whole week last week.
So next week we could see the start of the last impulse wave down to finish the bigger (red) WXY correction.
Let's see what the market does and react.
Trade idea: Wait for a small correction up on a lower timeframe to trade shorts.
If you want to learn more about trading FVG's & liquidity sweeps with Wave analysis, then please make sure to follow me.
This shared post is only my point of view on what could be the next move in this pair based on my technical analysis.
Don't be emotional, just trade your plan!
Eduwave
SPX500Abu Sarah's Daily Pivot Points Indicator
For S&P 500 Index Futures
Automatically updates and identifies important support and resistance areas
Works on all time frames

S&P 500 Daily Chart Analysis For Week of April 17, 2025Technical Analysis and Outlook:
In the recent shortened trading session, the Index recorded steady to lower prices, distancing itself from the Mean Resistance level of 5455, as indicated in the previous week's Daily Chart analysis. This trend establishes a foundation for continuing the downward trajectory, targeting the Mean Support level 5140. Should this downward momentum persist, further declines may extend to the next Mean Support level of 4970 and ultimately reach the completed Outer Index Dip at 4890.
Conversely, it is essential to acknowledge the possibility of upward momentum at the current price level, which may challenge the Mean Resistance of 5455 and extend toward the Outer Index Rally at 5550.

WILL THE S&P 500 COME CRASHING DOWN? TRIPLE RSI DIVERGENCE?!S&P 500 (SPX) Is considered to be one of the primary benchmarks for the U.S economy. Recently it appears to be showing a triple bearish RSI divergence, DMI indicating bearish with ADX above 20, and a bearish MACD on the 1 Month chart. The technical analysis seems to have a highly bearish hypothesis in my opinion. If we give some thought to Ray Dalio's Principles for Dealing with the Changing World Order , some haunting indicators appear to be forming. Could this just be a minor correction? Or is this the beginning of an extended economic downturn?
Disclaimer: Not financial advice.

make it possible, institutionalsJust maybe according to past data. We retailers just wishing well :)

SP 500 to the moon !!!It's painful, I know. But considering Fibonacci, I'm sorry to inform you that I see the SP500 hurtling toward its final extension of its downtrend (not a correction, it's a downtrend. Yes, sir).
