Plan for Full Support Failure We did really well today with lotto puts, hitting over 2,000% on the OTMs taking near the high of the day betting on new lows - but I want to start this post by stating nothing significant happened for bears today. I've been explaining recently how this sort of reaction to the level we were at would be most common.
There are times when the low is made now. As I write this, we trade on support. In a 2021-esk move, we'd be at the low.
In the statistically most common SPX move, we'd be in the first break the 5500.
In the doom move, we'd be entering into a consistent downtrend that would have shallow bounces, a bigger trappier bounce around 5700 and then enter into a period of serious outright capitulation. The type of action almost never seen in indices. I believe contingent on the preceding action hitting this would be a highly probable event on the break.
If we're in a big bear move then it HAS TO BE the case that the first drop was a leg one of Elliot downtrend or a leg A of a correction.
This leg would have to be either the C leg or the 3 leg. Both of those would be capitulation events - and be headline making crashes. Like mainstream news sort of deals.
These moves would be characterised by consistent and strong selling. Only shallow bounces.
If these things are not happening, then it's not a good idea to be a bear.
If these things are happening, trying to buy the dip might get you nailed.
I'll tell you here and now, if the bear break thesis is correct - lots of people will end up margin called.
They will buy the dip and then think they can average out of it buying more and there will not be deep enough rallies to accommodate this.
They'll progressively pick up bigger and bigger positions. Hope and feel it's all over on the first major bounce and then the worst part of the trend will come.
If the sell off is strong, people should respect the risk of it.
To end on an optimistic note - if we make a low somewhere in the area we traded today that is almost always bullish. I'd certainly be bull bias to a new high and if we break the classic spike out risk I'd be ultra bullish.
I strongly believe the trend for the following couple years will be set in this area. I think that's been foreseeable for years. If the downside risk can be overcome - I think the easy bull markets that followed would surpass the ones we've seen.
Or this could become the worse sell off you've seen in SPX.
It's not a time to be overly cocky. Protect risk and be ready to benefit from any outcome.
Big money is likely to be available within the next 9 months. Next 3 if it's a bear thing.
SPX500USD trade ideas

Spx500usdThere u go by decimals, almost there,
Here you go, it might be in bull today, I just hope so
Keep Ur own trades safe guy and DYOR
Do always Your Own Reseach

Spx500usd up? 1min chart at 23h London time?As it is , all I hope is that spx 500usd starts here at that blue line, after all, if it starts at the blue line the stock as might be up again, I'm not into the fundamentals by this time, I'm just making some Elliot and indicators-some mine, others don't, and trend analysis
Hope u guys all in profit
After all we all looking for the same
Keep Ur trades safe
And Do Always Your Own Research
DAYOR
Keep it safe
This my my graph at 1min candles, returned to 15min chart
Keep it safe.
And keep cool.

Is minor B done?In my last post…” We Have a Full Pattern into The Target Box” … I stated, “I am now looking for a 5-wave pattern to develop to the downside, followed by a 3-wave retrace, that in the coming weeks can take us back out of the target box to the downside.”
That pattern may have begun today in the very micro sense. This is very preliminary, so we need follow through to the downside so that in the days and weeks to come, we can confirm a top in minor B.

SPY pull back startAs we can see, it appears that today marked the beginning of a pullback, with the price breaking below the trendline and dropping by 1.20%.
Interestingly, the price has now reached the 10 EMA, which often acts as dynamic support. From here, we need to remain patient — either waiting for a bullish reaction at this level or allowing the price to continue pulling back to a deeper point of interest (POI).
Based on how the market reacts at each POI, we can then begin to take action on the trades from our watchlist.

Hard to trust thisYes, we got the move down, but we're at support and the RSI is very oversold on small time frames. Caution is needed.

SPX500 | Macro-Fib Confluence Levels + Risk Roadmap🕰️ Daily Chart | May 21, 2025
🏢 Posted by: Wavervanir_International_LLC
After a sharp retracement and subsequent rally, the S&P 500 Index ( FOREXCOM:SPX500 ) is now facing overhead resistance near the 0.886 Fib retracement (~5,875-5,953) from the previous swing high.
🔍 Technical Overview:
Confluence Resistance: 5,875–5,953 zone (0.886 Fib)
Micro W-Pattern Setup: Pullback expected to 5,640–5,700 before a potential higher low sets up a breakout.
Bull Targets:
6,182 (1.236 Fib ext)
6,512 (1.618 Fib ext, potential exhaustion zone)
🧠 Macro + Volatility Context:
Monetary Policy: Fed remains data-dependent. July rate cut odds are increasing, but the market remains bifurcated between sticky services inflation and weakening real GDP prints.
Bond Market: Yield curve remains inverted. A breakout above 6,182 will likely need bond volatility (MOVE index) to stabilize under 100.
Global Flow Risks: Continued capital inflows into U.S. equities amid geopolitical hedging, but China liquidity injections and BOJ FX defense add noise.
🛡️ Risk Management Notes:
Pullback Zone: 5,640–5,700 = high-conviction buy zone (0.5–0.618 retracement of last impulse)
Invalidation: Daily close below 5,573 or breach of 5,475 = reassess long thesis.
Position Sizing: Favor partial scaling-in with tight trailing stop until breakout confirmation.
📌 Strategy Summary:
We are watching for a tactical pullback into the golden zone followed by a measured continuation toward 6,182+ if macro tailwinds align (i.e., dovish Fed tone + improving liquidity metrics). The setup mirrors late-cycle rallies and should be monitored alongside bond yields and dollar strength.
⚠️ Patience > Chase. Let the W structure play out.
—
🔗 #SPX500 #Fibonacci #MacroTrading #Wavervanir #SMC #RiskManagement #TradingViewAnalysis

S&P 500 1W forecast until mid June 2025It's in reversal now. Uptrend has finished and downtrend is starting. A fall downto 5105 is on the table. It may last until the middle of June 2025.
This view is also supported by my VIX forecast.
Weekly updates of 1D chart are available through social media links in my profile.

S&P500: First Trade War indicates that ATH comes soon.S&P500 is a very healthy bullish levels on its 1D technical outlook (RSI = 65.213, MACD = 111.000, ADX = 49.249), being considerably over its 1D MA200, with the 1D RSI very close to the overbought zone. This resembles the first Trade War in 2018, when once the 1D MA200 was crossed, it became a Support level and extended the rally to the index Highs and the R1. We remain bullish on SPX with TP = 6,150.
See how our prior idea has worked out:
## If you like our free content follow our profile to get more daily ideas. ##
## Comments and likes are greatly appreciated. ##

$SPX Weekly – 2025 Trendline Bounce Confirmed Again📈 The S&P 500 ( VANTAGE:SP500 ) just bounced cleanly off the long-term trendline that has defined this bull market since the COVID low in 2020.
🟢 Touchpoints:
March 2020 🦠
June 2022 (inflation bottom)
October 2023 (Fed pause)
Now again in 2025
That’s four successful tests in five years. Price action suggests that this trendline remains the key support for bulls — as long as it holds, the trend remains intact.
But if it breaks in the future… buckle up.

Is a Range Forming?The S&P 500 has enjoyed a powerful rally in the last month, and now some traders may anticipate a sideways move.
The first pattern on today’s chart is 5,971, the final weekly close of 2024. The index chopped on either side of that level a few times in January and early February. It stalled there in late February and early March as tariffs were confirmed on Mexico and Canada. SPX peaked just three points below that price on Monday before halting. Is the old resistance still in effect?
Second, SPX made a lower low and a higher high that session. Tuesday was just the opposite. That combination of an outside candle, followed by an inside candle, may suggest a change of direction is coming.
Third, Wilder’s Relative Strength Index (RSI) has turned down after nearing an overbought condition.
If a pullback occurs, traders may eye roughly 5,773 as support. That was the low in January and a high in late March.
Next, prices are historically far above the 50-day simple moving average (SMA). However, the SMA is turning upward. That could suggest the intermediate-term trend has grown more positive, which may keep pullbacks shallow.
Finally, few important events appear to be scheduled before next Wednesday. (Minutes from the last Federal Reserve meeting and Nvidia earnings are both due then.) That lack of catalysts may also create drift – especially with a long holiday weekend approaching.
Check out TradingView's The Leap competition sponsored by TradeStation.
TradeStation has, for decades, advanced the trading industry, providing access to stocks, options and futures. If you're born to trade, we could be for you. See our Overview for more.
Past performance, whether actual or indicated by historical tests of strategies, is no guarantee of future performance or success. There is a possibility that you may sustain a loss equal to or greater than your entire investment regardless of which asset class you trade (equities, options or futures); therefore, you should not invest or risk money that you cannot afford to lose. Online trading is not suitable for all investors. View the document titled Characteristics and Risks of Standardized Options at www.TradeStation.com . Before trading any asset class, customers must read the relevant risk disclosure statements on www.TradeStation.com . System access and trade placement and execution may be delayed or fail due to market volatility and volume, quote delays, system and software errors, Internet traffic, outages and other factors.
Securities and futures trading is offered to self-directed customers by TradeStation Securities, Inc., a broker-dealer registered with the Securities and Exchange Commission and a futures commission merchant licensed with the Commodity Futures Trading Commission). TradeStation Securities is a member of the Financial Industry Regulatory Authority, the National Futures Association, and a number of exchanges.
TradeStation Securities, Inc. and TradeStation Technologies, Inc. are each wholly owned subsidiaries of TradeStation Group, Inc., both operating, and providing products and services, under the TradeStation brand and trademark. When applying for, or purchasing, accounts, subscriptions, products and services, it is important that you know which company you will be dealing with. Visit www.TradeStation.com for further important information explaining what this means.

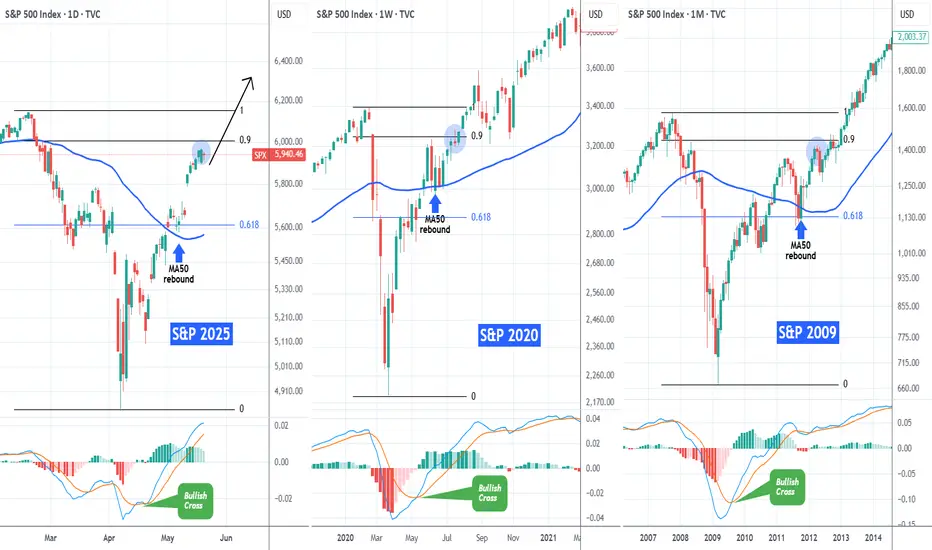
S&P500 Same recovery path with 2020 and 2009The S&P500 index (SPX) has recovered almost 90% of its losses since the February 19 2025 All Time High (ATH) and many have already started calling for a technical correction.
If we compare however this 2025 Tariff fueled correction with the recent most aggressive ones (COVID crash in 2020 and Housing Crisis 2008/2009) we see a different picture.
On their respective 0.9 Fibonacci levels (close to which we are today), both of those market recoveries went straight to new ATHs, without testing their MA50 (blue trend-line) until the next Cycle peak. They had that tested before when the price was trading near (or on)the 0.618 Fib. Notice also how a MACD Bullish on all three charts, confirmed the aggressive recovery pattern straight after the bottom.
Instead of a correction, history shows that we might be looking at new ATH soon.
-------------------------------------------------------------------------------
** Please LIKE 👍, FOLLOW ✅, SHARE 🙌 and COMMENT ✍ if you enjoy this idea! Also share your ideas and charts in the comments section below! This is best way to keep it relevant, support us, keep the content here free and allow the idea to reach as many people as possible. **
-------------------------------------------------------------------------------
💸💸💸💸💸💸
👇 👇 👇 👇 👇 👇
05/20/25 Trade Journal, and Where is the Stock Market going tomoEOD accountability report: +293.75
Sleep: 4.5 hours , Overall health: Calm and tired. need to catch up on sleep.
What was my initial plan?
Market structure was bearish so, I started the day shorting, but once market flipped bullish, I switched to BTD mode.
Daily Trade recap based on VX Algo System
— 9:00 AM Market Structure flipped bearish on VX Algo X3!
— 10:20 AM VXAlgo NQ X1 Buy Signal
— 11:18 AM Market Structure flipped bullish on VX Algo X3!
— 12:30 PM Market Structure flipped bearish on VX Algo X3!
— 1:20 PM VXAlgo NQ X1 Sell Signal
— 3:13 PM VXAlgo ES X1 Buy signal 2x signal (C+ set up)
Next day plan--> Above 5900 = Bullish, if we lose 48min support at 5900--> 5800 next
Video Recaps -->https://www.tradingview.com/u/WallSt007/#published-charts

The Three Main Things That Happen at 86 Fibs.As some of you may know, I have a bit of an interest in how trend moves have historically formed and failed.
I am interested in the subject generally, with me having put a fair amount of time into just understanding the basic timeline of historic events, reading the different studies on market hypothesis' and checking how these perform or fail in the fat tail events, but when it comes to trading I have a few main interests.
--How can we approximate what zone a top would generally come if we're topping.
--How do we survive being early on that.
--How do we know it's wrong and we should flip long.
--The typical break/capitulation level for bear trends.
--Where we tend to bull trap from.
--Styles bull traps and market recoveries.
--How markets generally bottom after extreme events.
The answer all of those questions is an optimistic endeavour but these are the main things you have to understand to make it viable to be able to bet on the major turning points in these fat tail events and to be able to take exposure without going broke if you get it wrong. Be that trying to buy lows or fade highs.
During the last bear move we posted short analysis at the top, throughout and then posted the different possible bull traps while we were at the low. To this point, the general norms of the historic analysis have held up. Now, we're into the 86 fib which has tended to be a critical area for the trend decision.
In this piece I'm going to go through the main types of reactions we get here and how one can aim to make a plan that will be profitable in all types of scenarios.
Many of the things I'll be discussing are generic retracement rules and if you follow my work you'll know them from my 76/86 theories that I discuss regularly, but all of what I am about to cover here also checks out on the SPX chart. I have manually went through every single drop of over 10% in the SPX and then modelled the different rallies from there. Be them recoveries or crashes - these rules tended to be useful in most of them.
Let me start by giving a very brief history of my use of the 76/86 fibs. The original rules I had for this was a reversal should come just a little bit before the 76 fib. I'd buy/sell close to the 76 fib and use a 76 hit as my stop loss. These were great times. It would work a lot and it'd pay over 1:10 RR sometimes when it did.
Over time this became a little harder and I had to increase my tolerance zone for spikes above the 76. My rules then became to trade close to the 76 and if the 86 hit then I'd stop out because I think it'll go higher. Most of the time we pullback first, but the 86 hitting I used to class as a failure of the reversal.
This worked well (Albeit with reduced RR) for a long time but during the 2022 bear market this theory has significant failures with us tending to trade to the 86 and then put in full reversals. Given my bias is trade the reversal on the 76 and expect continuation if the 86 hits, this was a problem. My default rules would pick up losing signals on both sides. So I had make some further amendments to the idea in 2022.
I've used the general idea for about a decade in total now, with some minor adjustments along the way.
This framing is important because the general default rule I'd have here is now we 86 has hit we probably pullback a bit but it's a net bull bias- however, that strategy has weakened and I have to be a bit more agnostic now. Before, by this point I only have bull plans and ideas of how to stop out if I am wrong. With the new tendency for 86 hits, I need a bear plan also.
First we'll deal with the outcome that I find happens least often, the clean 86 break.
I hate this move. Be it on the upside or the downside I always find it easer to make money when something happens at the 86. I don't even care what. When it trends through I don't expect it because it only happens about 20% of the time and I can end up in a tricky situation where the market jumps from one resistance level to the next and I never want to buy and generally am bias towards fading the move - which can go really bad if the reversal thesis is wrong.
When this clean break is made it's usually built in a trending way. Higher lows in an uptrend. I've found the best way to deal with this risk is if there's any credible risk of the 86 breaking I start to buy all the dips when they're at deep retracement levels. What I "Think" will happen doesn't matter. I know if we head into the type of break I dislike I'll do poorly if I do not start to fade the 86 early. I'd rather lose one or two small trades trying this than end up in a situation where I find it hard to know what to do for months.
If we get back above the 86, this is the plan. Just buy all the dips until it fails. If it fails early I'll probably lose 2-3% over a few trades. If one trade works and I lose after I'll end up even. If they all work I'll end up with over 30% for my 3% risk. Although I do not "Think" this move is likely, when you can risk 3% to make 30% and cover yourself from the things that are tough to deal with - that's a good deal.
The most typical result in SPX history (and in general 86 theory) is we make a crash like move off it but this only goes to the 50 fib.
Very common. You'll find this in SPX recoveries from as early as 1920. Obvious ones after the 2008 crash etc.
This is a net super bullish setup but we'd be in for a drop of about 10% first. It's the most common outcome and if it was not for the need to edit rules due to stop hunting this would be the only main plan I had right now. The plan would be to trade this and everything else would be planning how to not lose too much if something else happened.
If the 5o fib breaks, we tend to capitulate to the 23 fib.
From here is a bit of a tricky spot because a lot of different types of things can happen but inside the context of the overall move we have, this could foreshadow a massive break. If and when we get there I'll discuss more about the tactical trading decisions one can make in this area.
I think for the bear thesis to have a chance we need to the monthly candle to close with a wick on the top. A drop of several 100 points into the end of the month.
Giving the size and speed I'd expect this move to be, it'd almost certainly be a news related move.
If that marker hits, then we'll discuss the decisions to be made into the support levels.
If we uptrend above the 86, then it's buy all dips until it stops working, review after.
But one thing is for sure, this is historically the riskiest spot to be short term bullish. Even in a bull setup, you're wrong 3/4 times on long entries here. In a bear setup, things get really nasty.
Bulls should be super careful if the 86 can not break. Bears should be careful if it does.
The historical analysis clearly shows if you make mistakes here on either side you can take crippling losses. No one should be overconfident at these prices (most people are though).
The bears have the edge for the next 10% under the 86 but if they are wrong there are so many different ways it can end up terribly.
Bulls are at the point where they should be most careful, but as it generally is - this is when they feel bulletproof.
Interesting spot.
For my part, I plan for everything and trade what happens.
Being profitable is more important than making bold and clever predictions if you do this for a living.

SPX updateI expect a correction to retest 5400 area before last bullish leg to new ATH@6180 then in my view bearish cycle will start and push SPX to at least 4100 area

S&P500 Short: Attempting to break the trendlineAs an update to my previous idea to short S&P500, this is a short video to update the stop and to point out the break of the longer-term trendline.

Temporary euphoria fades, a sharp correction is likelyThe current index surge appears increasingly disconnected from core fundamentals. Markets have been brushing aside key economic data, rallying instead on short-term sentiment and speculative flows.
⚠️ Once this temporary momentum fades, I expect a pullback to 4800, with a possible extension toward 3900 if macro headwinds intensify. This setup reflects a growing divergence between price action and economic reality—something that rarely lasts.

S&P500 short: Bigger Picture AnalysisOver here, I updated the wave counts and commented on that the alternate count is still a bearish count. The upper trendline will be where we can consider shorting if price does make a higher high, and the lower trendline will be the breakdown line.

If We Break Here, Trend Decision is Likely Around 5500.I've recently posted various different bullish considerations for breakouts because given the macro context of where we are, if these are made they could be extremely strong.
However, at the exact moment in time we're still trading right at a major resistance level. We trade at the 86 fib. Historically, SPX pulls back from here about 80% of the time. Usually a correction, some have become crashes.
If we uptrend above the 86 - this is extremely bullish bias and the plan is buy all dips betting on the local trend structure to hold. Getting out as soon as there's not flawless higher lows on the dumps.
We have traded a tiny bit above the 86 recently but if we do not break it again then the chances of a 10% drop are strong.
At this point SPX could easily drop to around 5900 in the bullish move. That'd be expected at this point I'd say. Part of a simple trend development- but if the 5900 level breaks, then we're likely heading down close to 5500.
The 5500 forecast is the bullish forecast.
In the event of us seeing this month closing down with a big wick candle above it and then us making a bear break - next month could be a huge bearish engulfing candle.
We really are at a very interesting spot.
Sized up on various different types of bear bets here at 5940.
If we continue to see local uptrend I plan to buy all dips and trail stops and hopefully this could build into what may become a sensational breakout. But if supports start to fail - I do not think this is going to be a drop to be buying. I'll be extremely bear bias on the breaking of 5870 or so = and in terms of the RR on the move, the bear bet now is optimal.
Big decisions to be made in this area. We must be close to them.

Pretty bullishUntil the 50MA (monthly) is not broken down and the parabolic move is neither broken down. 7000 pips are coming soon.

The Bullish view under ELLIOT WAVE top of 3 6181/6235Based On what has been happening in the structure in The SP 500 I tend to think the sp cash sees a retest at 6417 or extend the rally to 6181 alt 6230 for the top of #wave 3 or Wave B . both should see a 350 point decline back to 5830/ If 5 is equal to One a 646 point rally should be seen in wave 5

US500: Bullish Trend Holds Despite Moody’s DowngradeUS500: Bullish Trend Holds Despite Moody’s Downgrade
On Sunday, Moody’s downgraded U.S. debt to AA1, citing rising interest costs and unsustainable debt growth. They noted that U.S. debt funding costs are much higher compared to similar economies, with interest payments significantly exceeding those of similarly rated countries.
At the market open on Monday, US500 dropped from 5959 to 5874, losing nearly 1.40%. While this downgrade was expected to have a bigger impact, the index quickly recovered, reaching a new high of 5972 after the U.S. market opened.
Despite the initial dip, US500 remains in a strong bullish trend. Unless a major event shifts market sentiment, the index is likely to continue rising. Even if small corrections occur, the overall trend is still intact.
You may find more details in the chart!
Thank you and Good Luck!
❤️PS: Please support with a like or comment if you find this analysis useful for your trading day❤️

Why You Shouldn't "Hope" for Bear Markets.A lot of the underlying TA analysis to support this is contained in my other post about the 4.23. It's recommended you read that first to understand context.
Click below;
This isn't an analysis post. In this post we won't be dealing at all with the idea of if you should expect, plan for or take steps to protect yourself against bear markets. We're going to focus solely on the fact some people really want it. They want it bad. You can tell by how extremely excited they get whenever there's even a mild hint it will happen.
Some people think I want this. They say the funniest of things. The amount of times I've had someone say something like, "Don't worry there will be a crash (some variation of "But when I say so" usually goes here) - which silly concept. The idea I "Worry" there will not be a crash. That I have a thesis in which millions of people get hurt, but at least my idea was right.
If you understand the scope of things that happen in a true bear market, to think this way is very shallow and selfish. People are liable to lose everything they worked their whole life for. Families losing security. Kids can end up on the streets. It's a dire tale - and to hope for this to happen just so you can say "Told you so" is a terrible way to be.
There are two good reasons as a trader you may want the market to go down.
1: Volatility. Markets get faster on the downside and if you're good, that means more money.
2: Benchmark beating. Unleveraged it's hard to beat SPX in an uptrend. Pullbacks help, a lot.
Both of these are now what I'd consider largely invalid reasons. They were good ones to have before but now we have massive volatility on both sides. We're inside an expansion of volatility which will likely continue whether we go up or down.
On benchmarking, it's important if you're in the asset management game but at this point you should be so far ahead of the benchmark that it's irrelevant. Good active traders at this point should be streets ahead of passive investors and passive investors should not even know it because we're back at highs and they think that means they have optimal performance. What they think doesn't matter, you can show people with money your results and being so far ahead of the benchmark greatly benefits you.
At this point in time you can be suitable ahead of the benchmark on a risk adjusted basis and have the prospect of heading into hyper volatile markets where you can make a fortune on either side. And if you're not in this sort of situation, you're not going to make a lot of money in a bear market - anyway. You probably have too strong a leading bias on the bear side which has led to you round tripping gains and even in a sustained bear market this same thing will happen in the bear market rallies.
A prominent reason some people hope for a bear market is simply want to see bulls fail. It seemingly annoys them no end to see other people doing well by doing something they think they should be punished for. While they often won't outright admit this, it's clear in the tone of how they speak. The way they celebrate any time someone bullish might have maybe lost some money - and they are eager to tell you how they are going to go broke in the next leg.
This is a bad way to be. In life. You should not be too bothered about what other people are doing. How they get on with that. And you should not expressly hope people fail and suffer just because they have a different idea of market analysis from you. It's not a healthy way to be. It's bitter and caustic - and that isn't stuff you want to cultivate as personality traits.
You can spot people who are like this easily. They'll generally dress it up as "Warning people" but it's not warning people when you cheer and jeer if the bad thing happens to them. That's called "Gloating" and if you were really interested in the helping of people, you'd not gloat. Indeed, the bad thing happening to them would be consider a failure on your part. Your warning sucked and no one listened.
When it becomes stupidly obvious what motivates these people is when the market goes up and they get mad. If this happens, you're not "Trying to help". You are hoping they will fail so it validates yourself in some way. Which is bad ... You want to address that and find a way to validate yourself without needing others to suffer for you to have "Told them so".
If the 4.23 thesis is correct them whatever way to market resolves there's liable to be a mega trend. If you're in the game to make money - which way is better. Up or down?
It's up. Clearly. Because when the market goes up your risk is contained to things like fraud and malpractice with your counter parts. You bank and broker are only going to go under if something extremely shocking is unearthed. In a downside market, it only takes one thing to have a problem and through the magic on contagion all of your banks and brokerages now have a problem.
You know what problems with banks and brokerages mean? They mean you put effort into making money you might not get. It's not the thing to be "Hoping" for. Is it?
It's really dump, to be blunt about it.
When you drill down into it the two main reasons people want a bear market are they don't like seeing bulls succeed and they want to be able to say they got it right. That's the bottom line with most bear forecasts. And you can always tell because they'll be upset if the market goes up.
The other is basic ideology of how markets "Should act" but this is basically just hoping the bulls fail and also generally totally detached from the reality of how markets have always acted. Markets have never acted "As they should". Never in 200 years. Why show up now and moan about it?
These things are all entirely non important. When you weigh them against the known outcomes of bear markets. Millions of people suffering. Risk to financial structures. Increased chance of slippage and gap events in the market making it hard to understand and control risk. Just so you can "Be right". Or just so people you don't know can suffer because they did something you didn't do and you're not happy that went well for them.
At the risk of repeating myself ... not a good way to be.
There used to be a bit of a good reason when it comes to social media because sites like this have become increasingly less useful/interesting as the uppy markets continue. More and more we have the future knowers that will insist you use their ideas. You may not even discuss your ideas. If you do, you should be mocked and branded as .
While a solid bear market would bring an end to this we'd run into a couple problems. One - the bears would take their place. We seen this at the April lows. When I posted bull analysis at the April lows bears showed up with all the same tone and noise of bulls when you post into resistance. Like the bulls, if they're right they come back to tell you how stupid you were and if they're wrong you'll just not see them again until they're right. Where they'll come back to remind you how stupid you were, even if you've already banked profits on all your ideas at this point.
This is mildly annoying but it's not the sort of thing that you should pick global disaster over. All you have to do is just not read the comments. Granted .... the fact you have to post analysis that's the popular idea here or you should not bother reading the comments because it's be full of childish nonsense isn't ideal for social networking. It doens't make these kinda place "Fun" places to be. But it's better than the wipe out event.
And now even the wipe out event will not significantly improve the content one should expect. It used to be the case if there was a wipe out event then most of the people posting would be -people who have some deep experience trading either side of the market and can offer insightful ideas.
In the previous drop we seen how this will play out now. People will not know what they're talking about but rather than let that slow them, they'll just get ChatGPT to write the post for them. And it will be entirely standard and predictable posts. Most of the "Bear market analysis" I seen in April can be duplicated by putting about 6 words into ChatGPT.
If I can prompt ChatGPT and read your post - why would I read your post? I can ask ChatGPT the same thing. Can ask for more detail. Give more context. Chat back and forth about different outcomes. Or I can come to social media and read the same 5 bulletpoints over and over again. It's not hard to see which is more interesting.
So even the idea that we'll have more interesting content from more objective traders is largely out the window now. We'll probably just have generic ChatGPT posts.
"Hey ChatGPT, write me an essay on tips to trade a bear market".
That's how most of the bear analysis in April was written.
All in all, the only two reasons people hope for bear markets at this point is ideology and ego. Both are things you should leave at the door when you enter the market.
Whether it will happen or not is something yet to be determined, but it's not something to hope for.
Although I will say this, if the 4.23 breakout comes I think sites like this will become essentially unusable for people interested in discussing strategy, odds and contingency planning in markets. It kinda already is and it would get much worse. Unless you want to post, "I too agree with the popular idea" you may as well not post.
And if everyone is posting the same thing, you may as well not post.
But these are small prices to pay to know your broker is probably going to stay in business.
