SPXUSDT trade ideas

SPXUSDT Approaching Breakout Zone – 20% Potential Move?SPXUSDT is gearing up for a potential breakout after consolidating in an ascending triangle. Price is once again testing the key horizontal resistance at $1.38, which has held for several days.
Structure:
Ascending triangle on the 4H timeframe – typically bullish
Multiple rejections at the $1.38 level indicate a strong breakout if flipped
RSI is around 63, signaling growing momentum
Trade Setup (If Breakout Confirms):
Entry: Candle closes above $1.38 resistance
Stop Loss: Below $1.3422 support zone
Targets:
$1.4753
$1.5679
$1.7019
Potential upside of ~20% if momentum holds.
Support & Resistance:
Immediate Support: $1.3422 & $1.2962
Major Resistance: $1.38 → $1.4753 → $1.5679 → $1.7019
A breakout from this structure can trigger a strong bullish move. Watch for confirmation and volume.
DYOR. Not financial advice.

SPX/USDT – Breakout WatchSPX is currently testing a major horizontal resistance zone around 1.34–1.36, after a consistent series of higher lows forming an ascending triangle.
Trade Setup:
Entry (after breakout and retest): 1.34–1.36
Targets:
First target: 1.475
Second target: 1.567
Final target: 1.701
Stop Loss: Below 1.29
Structure: Ascending triangle showing compression and bullish pressure
RSI: Trending up, signaling possible continuation
This setup requires patience — the ideal long entry is after a breakout with successful retest. Rushing in early can be risky.
Do your own research. Not financial advice.

SPX6900 — Dream Scenario1. Wait for price to sweep EQ lows (buy zone)
2. Enter long only after SFP / bullish confirmation
3. Target: 2.13+
4. Stop: below buy zone
If no sweep — no trade!


$SPX - Short-Term OutlookMEXC:SPXUSDT | 4h
Price is now trading above its previous resistance 1.40
We may fill the gap around 1.39s, but this one looks solid so long as we stay above 1.36
Local Support: 1.40-1.38
TPs:
1.54 to 1.58
1.67 to 1.72
1.86 to 1.92

SPX - Space X?SPX means SpaceX? LOL NOO, but this coin has traits of the rockets. to move up, as stated

SPX Swing SetupSPX will rise, Some understand many will #CULT, Since the FDV for 2025 is uprising and the agenda is to invest in communities not in any financial institute, Strong communities are running behind to make the algorithm into real manifestation. #SPX6900

SPX/USDT CUP&Handle On the daily time frame, SPX/USDT has formed a classic Cup and Handle pattern, one of the most reliable bullish continuation setups. The structure shows a smooth rounded base followed by a brief consolidation forming the handle.
Now, the price is attempting a breakout from the handle zone, signaling momentum for the next leg up. A daily candle close above the handle resistance will confirm the pattern breakout and likely trigger strong upside movement.

This SPX will outlive the American index?Well not to say loooks good for scalp if holds the green line or the boxooxox!

SPX6900 Bidding 4H S/R + FVG Zone — Looking for New Highs✅ 4H S/R + FVG provides strong support and bid opportunity
✅ 200EMA adds further confluence to the setup
✅ Invalidation = 1h closes/consolidates below $1.14
Active Setup:
Long Entry: In $1.08–$1.14 zone (confirmation: reclaim or bullish trigger in area)
Target: $1.72 (new highs/ATH)
Manual Invalidation: Cut if 1h candles close and consolidate below $1.14
🔔 Triggers & Confirmations:
Only bid on strong reaction or reversal in FVG/S/R zone
Exit if 1h PA settles below $1.14 (red pattern bars area)
🚨 Risk Warning:
Aggressive longs — keep risk tight, cut quickly if invalidated

SPX - Space X?I dont know whats the full form, but its just flowing and when it flows - we say LET IT FLOWW!

SPX 6900 Forms Bullish Pennant After 18% Rally — $2.20 in SightSPX 6900 has surged 18.20% on the day, continuing a strong bullish market structure that began at the $0.25 low. Since then, price has consistently posted higher highs and higher lows, reclaiming major volume levels and flipping resistance into support.
The latest pivot came from a clean reaction off the 0.618 Fibonacci retracement, propelling price into the ATH region. Now, SPX appears to be forming a bullish pennant, with converging support and resistance signaling a potential breakout setup.
Volume remains elevated, which confirms healthy trend participation. The $1.42 level is now acting as a key support zone, aligned with the value area high and a daily level. As long as this region holds, the current consolidation is likely a continuation pattern.
A confirmed breakout from this pennant structure would project a move toward the $2.20 Fibonacci extension, taken from the previous swing low to high.
Key Levels:
Support: $1.42
Resistance: ATH / Breakout Zone
Target: $2.20 (Fibonacci Extension)

SPX | HTF Breakout Confirmed, Watching for Pullback EntryHTF still bullish — watching W iFVG & weekly OB below as major bid zone.
Breakout to 2.13 next if structure holds.
Lose W OB? Full reset.
Best R:R for swings if we get a flush into 0.75–0.95.

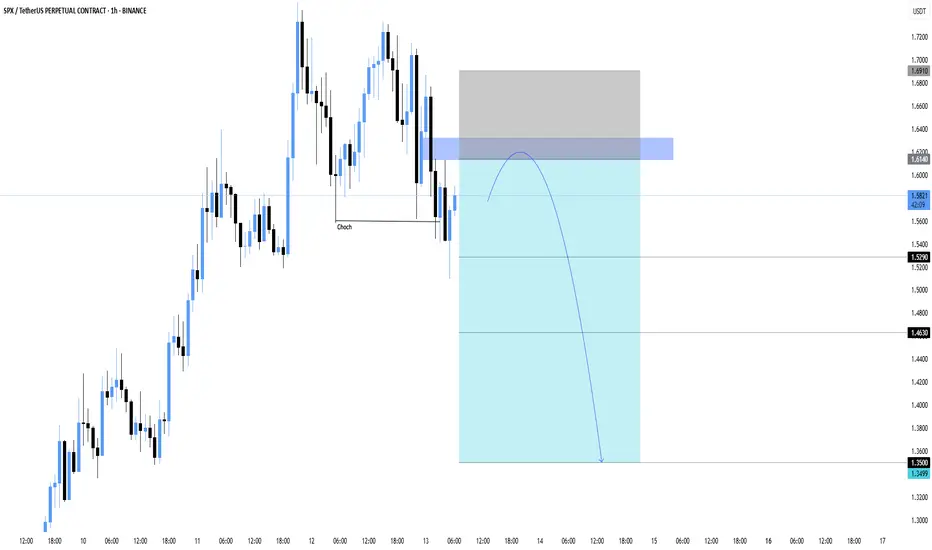
SPX/USDT — Change of Character Signals Bearish Move Incoming The structure has shifted with a clear CHoCH (Change of Character), suggesting that bullish momentum is weakening. Price recently pulled back into a supply zone around 1.6140–1.6910, setting up a potential short opportunity.
🔍 Technical Breakdown:
Price broke below recent higher low = CHoCH confirmed
Bearish BOS followed by retracement into premium zone (FVG/Supply)
Expecting rejection and continuation to downside if price fails to reclaim 1.6140
🔧 Trade Plan:
Entry Area: 1.6140
Stoploss: Above 1.6910
Targets:
• TP1: 1.5290
• TP2: 1.4630
• TP3: 1.3500
This setup aligns with internal structure + supply zone + CHoCH. Wait for confirmation candle or bearish engulfing in entry area before executing.
SPX SHORT SETUP SPX SHORT SETUP
ENTRY : 1.3416
PROFIT : 0.7648
STOP : 1.5336
ALL trading ideas have entry point + stop loss + take profit + Risk level.
hello Traders, here is the full analysis for this pair, let me know in the comment section below if you have any questions, the entry will be taken only if all rules of the strategies will be satisfied. I suggest you keep this pair on your watchlist and see if the rules of your strategy are satisfied. Please also refer to the Important Risk Notice linked below.
Disclaimer

SPXUSDT Wave Structure and Bullish OutlookAfter a clean break from the descending structure, SPXUSDT established a solid base within the strong demand zone, followed by a bullish pennant breakout.
The wave count suggests the current move is targeting the $1.77 zone as wave (3) before a minor correction for wave (4), with the projected end of this bullish cycle aiming around $3.20. Immediate support remains at $1.14, and invalidation only occurs on a break below the previous base. Structure remains bullish unless proven otherwise.

SPX Technical Analysis – Bullish StructureSPX Technical Analysis – Bullish Structure
The overall trend of SPX appears bullish, and based on the current structure, the asset shows potential for a 20% upside, with a possible move toward the $1.25 level.
Key support zones to watch are:
$0.90, which is approximately 11% below the current price
$0.80, which is around 21% below and can be considered the main support
As long as the price holds above these key levels and the bullish trend remains intact, the outlook stays optimistic for further upward continuation.
📌 This analysis is for educational and informational purposes only and does not constitute financial advice.
📝 Follow for more updates on SPX and other assets

SPXUSDT bounce setup — Low Conviction Play Off Demand ZoneMEXC:SPXUSDT is testing a demand zone built from the H1 order block + H4 swing failure pattern (SFP). While the structure remains weak, the current zone offers bounce potential — but conviction is low.
Setup:
🟩 Demand Zone: $0.90–$0.93
• Area of previous demand, also aligned with SFP
• Bounce possible, but high risk of fading without strength
🎯 First Target: $1.11 (Daily S/R)
🟥 Major Resistance: $1.20 — monthly level, likely hard cap
🚫 Invalidation:
• Clean break below $0.90 opens door to deeper drop
• No setup continuation if zone fails to hold
Plan:
• Short-term bounce trade only
• Not a high conviction long — manage risk closely
• Reassess if reclaim and structure form above $1.00+
📌 Dead cat bounce potential — keep stops tight and expectations measured.

SPX6900After hitting the 1.2000 level, SPX6900 has been failing to break above and created a key resistance on the intraday/4h chart at 1.1700 level. After multiple failed attempts to break 1.1700, price has slowed down and found support at the 0.9900 level, which I consider a key weekly level.
A slow build-up of momentum has taken price from the weekly support back towards 1.1700 level for another potential attempt at breaking the resistance. With the new month ongoing and general cycle on BTC still bullish (BTC above EMA50), I expect a successful breakthrough from the current price action.
Looking to trade the SPX futures towards next weekly level of 1.6500 and above to price discovery as soon as a clear break of structure is confirmed on the 1-hour timeframe and price closes above 1.1100, to which at this point I have about 3 minutes to go.
No clear stop loss however, IF price continues to fall and 4h closes below 0.98, I will consider the market to have turned bearish and close my trade.

SPX/USDTKey Level Zone: 0.9650 - 0.9950
HMT v8.1 detected. The setup looks promising, supported by a previous upward/downward trend with increasing volume and momentum, presenting an excellent reward-to-risk opportunity.
HMT (High Momentum Trending):
HMT is based on trend, momentum, volume, and market structure across multiple timeframes. It highlights setups with strong potential for upward movement and higher rewards.
Whenever I spot a signal for my own trading, I’ll share it. Please note that conducting a comprehensive analysis on a single timeframe chart can be quite challenging and sometimes confusing. I appreciate your understanding of the effort involved.
Important Note :
Role of Key Levels:
- These zones are critical for analyzing price trends. If the key level zone holds, the price may continue trending in the expected direction. However, momentum may increase or decrease based on subsequent patterns.
- Breakouts: If the key level zone breaks, it signals a stop-out. For reversal traders, this presents an opportunity to consider switching direction, as the price often retests these zones, which may act as strong support-turned-resistance (or vice versa).
My Trading Rules
Risk Management
- Maximum risk per trade: 2.5%.
- Leverage: 5x.
Exit Strategy
Profit-Taking:
- Sell at least 70% on the 3rd wave up (LTF Wave 5).
- Typically, sell 50% during a high-volume spike.
- Adjust stop-loss to breakeven once the trade achieves a 1.5:1 reward-to-risk ratio.
- If the market shows signs of losing momentum or divergence, ill will exit at breakeven.
The market is highly dynamic and constantly changing. HMT signals and target profit (TP) levels are based on the current price and movement, but market conditions can shift instantly, so it is crucial to remain adaptable and follow the market's movement.
If you find this signal/analysis meaningful, kindly like and share it.
Thank you for your support~
Sharing this with love!
HMT v2.0:
- Major update to the Momentum indicator
- Reduced false signals from inaccurate momentum detection
- New screener with improved accuracy and fewer signals
HMT v3.0:
- Added liquidity factor to enhance trend continuation
- Improved potential for momentum-based plays
- Increased winning probability by reducing entries during peaks
HMT v3.1:
- Enhanced entry confirmation for improved reward-to-risk ratios
HMT v4.0:
- Incorporated buying and selling pressure in lower timeframes to enhance the probability of trending moves while optimizing entry timing and scaling
HMT v4.1:
- Enhanced take-profit (TP) target by incorporating market structure analysis
HMT v5 :
Date: 23/01/2025
- Refined wave analysis for trending conditions
- Incorporated lower timeframe (LTF) momentum to strengthen trend reliability
- Re-aligned and re-balanced entry conditions for improved accuracy
HMT v6 :
Date : 15/02/2025
- Integrated strong accumulation activity into in-depth wave analysis
HMT v7 :
Date : 20/03/2025
- Refined wave analysis along with accumulation and market sentiment
HMT v8 :
Date : 16/04/2025
- Fully restructured strategy logic
HMT v8.1 :
Date : 18/04/2025
- Refined Take Profit (TP) logic to be more conservative for improved win consistency

SPX/USDT Breakout SPXUSDT:
SPX is now trading around $0.7255. #SPX has already broken out of the bull flag pattern and looks bullish. So, the possible scenario is that, as a bull flag is a bullish pattern, we can expect bullish momentum. Otherwise, if the price dumps and trades inside the bull flag channel, the breakout will be considered a fakeout. Keep an eye on it.

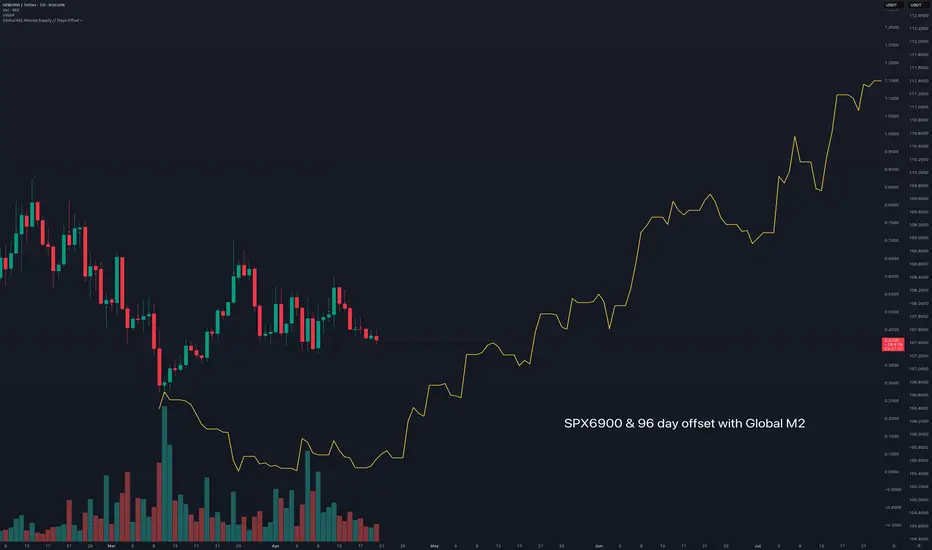
$SPX6900 following Global M2 money supplyFollowing Colin Talks Crypto's BTC & Global M2 money supply.
I'm using his script to generate global M2, in his version there is a 108 day - 86 day offset.
Here with SPX I adjusted to between that range at 96 days.
This sets up a strong outlook for SPX6900 going into the new few months.